Subgenual Prefrontal Cortex Volumes in Major Depressive Disorder and Schizophrenia: Diagnostic Specificity and Prognostic Implications
Abstract
OBJECTIVE: A variety of findings have implicated the portion of the anterior cingulate cortex ventral to the corpus callosum in the pathophysiology of familial depressive disorder. There are, as yet, few data to address the specificity of these abnormalities to depressive disorders or to characterize their stability over time. METHOD: The authors studied 10 subjects who were judged to have had major depressive disorder with psychotic features, who underwent magnetic resonance imaging (MRI) protocols, and who participated in a longitudinal study of recent-onset psychosis. These were group-matched to 10 subjects with schizophrenia and to 10 well comparison subjects. Volumetric measures were made of the posterior and anterior portions of the subgenual prefrontal cortex for these 30 subjects. Follow-up scans done an average of 4 years after intake were available for seven subjects with major depressive disorder, nine subjects with schizophrenia, and five well comparison subjects. RESULTS: Volumes of the left side of the posterior subgenual prefrontal cortex differed significantly by group and were smallest for the group with psychotic major depressive disorder. Volumes of the anterior subgenual prefrontal cortex did not differ significantly by group. Patients with major depressive disorder were more likely to show increases in posterior subgenual prefrontal cortex volume on follow-up than were comparison subjects or patients with schizophrenia. CONCLUSIONS: These findings add to the evidence that abnormalities in the subgenual region of the anterior cingulate play a role in at least some types of mood disorder.
A convergence of findings indicates that the subgenual prefrontal cortex has particular importance among the various brain structures thought to play a role in depression. Positron emission tomography (PET) studies have demonstrated increased blood flow in this area when sadness is induced in non-ill subjects (1–3), and such changes are particularly marked in depressed patients (4). Lesions of this area block the extinction of fear conditioning in animal studies (5), and in humans the area is thought to be important in the evaluation of the consequences of social behavior (2). It may thus play a role in the heightened self-criticism and pessimistic ruminations that characterize depressive episodes (6).
PET studies of depressed patients at rest have likewise found abnormalities in the left subgenual prefrontal cortex (6–9). Resting flow abnormalities in this area have characterized depressed patients who were recovered (10) and, in particular, those who then relapsed with tryptophan depletion (11).
Five studies have compared the volumes of the subgenual prefrontal cortex in depressed patients to those in matched comparison subjects. Three found the former to have significant volumetric deficits in the left subgenual prefrontal cortex, ranging from 19% to 48% of the values for the comparison subjects (12–14). The study that reported the largest difference between patients and comparison subjects was restricted to patients with familial pure depressive disorder (12). This diagnosis requires that one or more first-degree relatives have major depressive disorder and that none have alcoholism or antisocial personality (15).
Another of these three studies compared patients with affective disorder who had a family history of affective disorder both to those who lacked such a history and to patients with schizophrenia, and that study found that the abnormality was confined to the group with familial affective disorder (14). Bremner et al. (16) described a nonsignificant 7% reduction in subgenual prefrontal cortex volume but did not characterize the subjects by family history and did not compare left and right sides separately. Kegeles et al. (17) did confine their study group to subjects with a positive family history but found no difference in subgenual volumes on either side.
Also relevant is a volumetric study of depressed patients ages 9–17 years that measured the medial prefrontal cortex, a structure that includes the subgenual prefrontal cortex (18). Subjects with familial major depressive disorder, but not those who lacked a family history of affective disorder, had volumes of the left medial prefrontal cortex that were significantly lower than those of comparison subjects.
Two reports have provided evidence that the structural abnormality of the subgenual prefrontal cortex is stable over time. In one of these studies (13), patients with first-onset depression had the same degree of volumetric reduction as did patients who had had recurrent episodes. Another (12) found no change when patients were rescanned after a 3-month interval, regardless of whether their symptoms had resolved.
The analysis described in this article drew from an existing pool of subjects who underwent baseline magnetic resonance imaging (MRI) scans, thorough diagnostic assessments, and a prospective follow-up. Its purposes were to further test the diagnostic specificity of deficits in the volume of the left subgenual prefrontal cortex to major depression and to determine whether that specificity is stable over a follow-up of years rather than months.
The group with major depressive disorder was confined to individuals with mood-congruent or mood-incongruent psychotic features rather than to those with a positive family history of depression. Earlier studies have shown that many patients in episodes of familial pure depression have evidence of hypothalamic-pituitary-adrenal (HPA) axis hyperactivity as manifested in abnormal results on the dexamethasone suppression test (19–21). High proportions of patients with psychotic depression likewise show evidence of HPA axis hyperactivity (22). Because abnormalities in the subgenual prefrontal cortex are likely to affect hypothalamic functioning, we predicted that the volumetric deficits described in familial depressive disorder should manifest as well among depressed patients who have psychotic features.
Method
Subjects
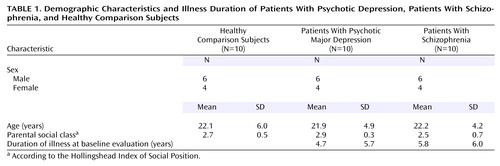
All the subjects described were enrolled in the Iowa Longitudinal Study of the Outcome of Early Psychosis (23) at the University of Iowa Mental Health Clinical Research Center (24). The database included 10 patients who, after the completion of baseline assessments, were judged to have major depressive disorder with psychotic features and who underwent MRI protocols using a 1.5-T scanner. Participation in the longitudinal study required that the subjects had been first hospitalized no more than 5 years prior to intake and that they were no older than 35 years. The 10 subjects were group-matched by age, sex, handedness, and parental socioeconomic status to 10 subjects with DSM-III-R schizophrenia and to 10 healthy comparison subjects (Table 1).
Diagnostic Assessment
Raters trained to a requisite level of reliability used the Comprehensive Assessment of Symptoms and History (25) to interview participants. Item ratings integrated the subjects’ responses with information from informants and from medical records. Senior medical staff considered this information in consensus diagnostic meetings held shortly after admission and again at discharge. Final diagnostic determinations thus reflected repeated assessments during the course of the index hospitalization.
Image Processing
MR data were processed on Silicon Graphics workstations (Silicon Graphics, Mountain View, Calif.) by using locally developed software, BRAINS2 (26). The T1-weighted images were spatially normalized and resampled to 1.0-mm3 voxels so that the anterior-posterior axis of the brain was realigned parallel to the anterior commissure-posterior commissure line and the interhemispheric fissure aligned on the other two axes. The T2- and proton-density-weighted images were aligned to the spatially normalized T1-weighted image. The data sets were then segmented by using the multispectral data and a discriminant analysis method based on automated training class selection (27). Tissue-classified images were processed by using the BRAINSURF program (28), which generates a visual map and quantitative measures of brain surface anatomy. The segmented image was used to extract a triangle-based polygonal model of an iso-surface by using a threshold of 130. This represented pure gray matter and corresponded to the parametric center of the cortex. The triangulated surface was used as the basis for our calculations of cortical area (in square millimeters), depth (in millimeters, representing an average value for the entire region of interest), and volume (in cubic centimeters) (29).
Definition of Regions of Interest
We adopted the guidelines for topographic segmentation developed in the Iowa Image Processing Laboratory (29) by using an approach that took advantage of simultaneous visualization in three planes to better reflect interindividual variation. This work yielded guidelines for 41 subregions of the cerebral cortex, one of which was designated the subcallosal area.
The subcallosal area overlaps with Brodmann’s area 25 and differs from the subgenual prefrontal cortex described by Drevets et al. (12). While both structures lie beneath the genual area of the corpus callosum, the area described by Drevets et al. is the more anterior portion and the subcallosal area is directly posterior. For simplicity, the following will refer to the subcallosal area as the posterior subgenual prefrontal cortex. The anterior subgenual prefrontal cortex, the subgenual prefrontal cortex described by Drevets et al., begins at the coronal plane defined by the rostral extreme of the genu of the corpus. From this plane, proceeding caudally, the anterior subgenual prefrontal cortex is traced on each consecutive coronal slice with the corpus callosum as the superior boundary and the cingulate sulcus as the inferior boundary. The posterior boundary of the anterior subgenual prefrontal cortex is a coronal plane defined as the last slice before the internal capsule is first visualized. This plane then is also the anterior boundary of the posterior subgenual prefrontal cortex. The posterior subgenual prefrontal cortex was traced in each consecutive coronal slice with the inferior border of the corpus callosum as the superior boundary and the medial border of the straight gyrus (gyrus rectus) as the inferior boundary. The posterior subgenual prefrontal cortex extends caudally to the natural limit of the gyrus (Figure 1).
We predicted that subjects with psychotic major depression would have lower mean volumes of both the anterior and posterior subgenual prefrontal cortex than would either the normal comparison subjects or the subjects with schizophrenia. A finding of smaller anterior volumes would replicate earlier results (12–14). We anticipated similar, if not greater, volumetric differences for the posterior subgenual prefrontal cortex because of its extensive overlap with Brodmann’s area 25 and because of evidence that this area has the heaviest projections to the medial hypothalamus (30–32).
Reliability
The interrater reliability for the anterior subgenual prefrontal cortex was performed on a set of 10 brains separate from the data set. The intraclass R coefficient for this region was R=0.96 for the left side and R=0.91 for the right side. The posterior subgenual prefrontal cortex region was developed locally. Thus, this region was available on a set of 10 “gold standard” brains to determine interrater reliability. The intraclass R coefficient for the right side was R=0.92 and for the left side was R=0.92.
For the current analysis one of the authors (W.C.) reviewed all follow-up assessments for the 10 patients initially thought to have major depressive disorder with psychotic features and for the matching patients with schizophrenia. This review showed all of the subjects to be diagnostically stable on follow-up with the exception of two of the depressed subjects, who developed manic episodes following their index hospitalizations and thus proved to have bipolar type I affective disorder.
Follow-Up
Follow-up assessments took place at 6-month intervals and were conducted with the Psychosocial Status You Currently Have—on Follow-Up (PSYCH-UP), an instrument adapted from the Longitudinal Interval Follow-Up Evaluation (33). As with the baseline assessments, the follow-up ratings integrated information from the direct interview of the subject with that from medical records and from informants when this was available. The PSYCH-UP uses the scores on the Global Assessment Scale (GAS) (34) as an index of overall severity of illness. Scores were calculated as the worst level that the subject maintained for at least 1 week in each of the previous 6 months. These six GAS scores were then summed and averaged for each follow-up GAS score.
To quantify changes over time in gray matter amounts, we determined the absolute difference between the baseline MRI measure and the last available MRI measure. A change was assigned a positive or negative value if the measure had increased or decreased, respectively.
Data Analysis
Group comparisons for the baseline and follow-up volume measures used analyses of covariance (ANCOVAs) with diagnostic group (comparison versus depression versus schizophrenia) as the between-subjects factor and covaried for age and total frontal lobe volume. Significant group differences in the main ANCOVA were followed by pairwise comparisons using post hoc t tests. Structure and function relationships were explored by using Spearman partial correlations (correcting for age) between the structural measures and the follow-up GAS score. In order to minimize type I error, the correlational analyses were limited to those regions of interest that differed significantly from those of the comparison group.
Results
Baseline Volumetric Measures
The volumes of the anterior subgenual prefrontal cortex were not significantly different across the groups. The volumes of the left-sided posterior subgenual prefrontal cortex confirmed our predictions that the diagnostic groups would differ and that the patients with psychotic major depression would have the smallest volumes (Table 2). Post hoc pairwise tests were significant only for the comparison between major depressive disorder and schizophrenia, however. The difference in left-sided posterior subgenual prefrontal cortex volumes was explored further by comparing other measures of structure in this region—surface area and cortical depth. Although surface area did not differ significantly among the three groups, the depth was substantially less in the major depression group than in the comparison group.
Follow-Up Measures
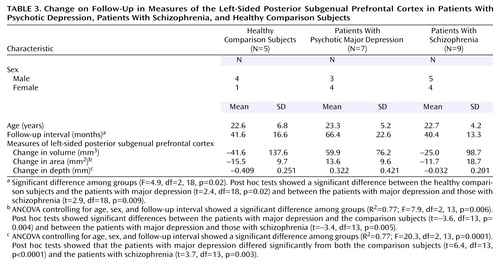
Follow-up MRI scans were available for five of the comparison subjects, seven of the subjects with major depressive disorder, and nine of the subjects with schizophrenia. Because follow-up intervals differed significantly by diagnosis (Table 3), group comparisons controlled for follow-up interval as well as for sex and age. According to paired-comparison t tests, none of the three groups showed a significant change from baseline to follow-up in the volume of the left-sided posterior subgenual prefrontal cortex, and the group ranking by volume on follow-up resembled that at the baseline scan (Figure 2). Moreover, the degree to which the volume increased in the depressed group was unaffected by removal of the two subjects who manifested bipolarity during follow-up. The unadjusted mean increases in volume were 77.4 mm3 (SD=53.1) with these two individuals and 80.1 mm3 (SD=64.7) without them.
The patients with major depressive disorder and those with schizophrenia had mean GAS scores on follow-up of 53.9 (SD=13.6) and 40.4 (SD=3.9), respectively (t=3.0, df=10.6, p=0.02). The baseline volume of the left-sided posterior subgenual prefrontal cortex did not correlate with the follow-up GAS score for either illness, but for the depressed group the baseline depth of the posterior subgenual prefrontal cortex predicted outcome, such that those with the more abnormal baseline measures had poorer outcomes (rs=0.92, N=7, p=0.01).
The groups differed significantly by the amounts of change in area and depth (Table 3), and only the volume of the subjects with major depressive disorder registered a tendency to increase (Figure 2). Six of the seven patients in the depressed group had volumes that had increased at least somewhat on follow-up, while this was true of only three of the nine subjects with schizophrenia (p=0.051, Fisher’s exact test). Increase in volume was significantly correlated with follow-up GAS score for those with major depressive disorder (rs=0.88, N=7, p=0.02), but there was no relationship between volume change and final GAS score for the schizophrenia group (rs=0.37).
Discussion
The results did not confirm the predictions regarding the anterior subgenual prefrontal cortex. The group differences did not reach significance, and although the depression group had somewhat smaller volumes than the healthy comparison subjects, the differences were not greater on the left and the schizophrenia group had the smallest volumes bilaterally.
These analyses did show the predicted relationships between diagnosis and volume of the left-sided posterior subgenual prefrontal cortex. The group with psychotic major depression had the smallest volumes bilaterally, and the group difference was significant for the left side. The post hoc, pairwise analysis revealed a significant difference between the depression group and the schizophrenia group but not between the depression group and the healthy comparison subjects. However, the ratio of the volumes of the depressed and comparison groups, 0.83, was close to the 0.80 reported by Hirayasu et al. (14) and the 0.78 found by Botteron et al. (13) in their comparisons of anterior subgenual prefrontal cortex volumes.
The follow-up group comparisons by volume area and depth were exploratory, in that we had no predictions that one rather than the other would show significant differences. We can consider the three three-way group comparisons of changes in posterior subgenual prefrontal cortex volume, area, and depth to be exploratory, and the p values for changes in area and depth were both smaller than the corrected alpha level of 0.017. We explored relationships between baseline volumetric measures and outcome with the intuitive expectation that greater baseline abnormality in the group with major depressive disorder would be associated with more morbidity on follow-up. We had no predictions for which of the three baseline measures would best show this association, however. Nevertheless, the correlation between baseline depth and later GAS score was in the expected direction and generated a p value less than the alpha of 0.017 adjusted for three exploratory tests. We also expected that the changes in volumetric measures toward the values for the healthy comparison group would be associated with better outcomes. The correlation between volume change and final GAS score was in the expected direction, but the p value was greater than the corrected alpha value.
That the group with psychotic major depression was the only one that showed increases in gray matter area and depth is nevertheless remarkable given the repeatedly described loss of gray matter across the age span among normal individuals. Some studies that have focused on age effects in normal individuals have found linear relationships between age and decreases in gray matter (35, 36), while others have found a curvilinear relationship (37). All described gray matter loss in the prefrontal region for individuals in the age range that characterizes the study group described here. Thus, the healthy comparison group showed qualitatively normal changes in gray matter measures over time. In contrast, the depressed group began the observation period with gray matter depth measures significantly lower than those of the well comparison subjects and then showed an increase in depth over time. Gray matter depth in this area may therefore reflect the ongoing severity of the pathological mechanisms underlying depressive disorder. Gray matter amounts may be smallest when the illness is most active and may then change toward volume restoration to the extent that the underlying illness remits.
The literature is complicated by variance in the use of the term “subgenual” as it applies to the anterior cingulate gyrus. The Drevets group (6), for example, described a portion of Brodmann’s area 24, Mayberg et al. (1, 38) consistently referred to Brodmann’s area 25 as the subgenual area, and Kegeles et al. (17) included sections of Brodmann’s areas 32 and 33 together with Brodmann’s area 24. Although the area described by Drevets et al. (6) does not overlap with the area described here, both lie beneath the genu of the corpus callosum and can thus be properly called subgenual. The two areas may play somewhat different roles in affective disorder, however. The posterior subgenual prefrontal cortex overlaps substantially with Brodmann’s area 25, the portion of the anterior cingulate with the heaviest projections to and from the medial hypothalamus (30–32). There is now considerable evidence that abnormalities in the medial prefrontal cortex disinhibit the HPA axis (39–41) and that high concentrations of glucocorticoids limit the proliferation of glia in the medial prefrontal cortex. The possibility that this reciprocal relationship may be particularly strong in the posterior subgenual prefrontal cortex is relevant to our findings. Hyperactivity of the HPA axis is more likely in major depressive disorder with psychotic features than in any other subtype of major depressive disorder (22). While familial pure depressive disorder has also been associated with HPA axis hyperactivity (19), a number of studies have failed to confirm this (42–44). The pathophysiology that underlies the volumetric abnormalities in the anterior subgenual prefrontal cortex of patients with familial pure depressive disorder may therefore differ from the process that leads to the lower volumes in the posterior subgenual prefrontal cortex described in the current, psychotic subjects.
Depth was the only baseline measure that significantly distinguished the subjects with psychotic depression from the comparison subjects. The observation that the patients with major depression who differed the most from the well comparison subjects in baseline depth of the posterior subgenual prefrontal cortex were also the ones with the poorest outcome a mean of 5.5 years later raises several possibilities. This measure may reflect a congenital abnormality in the posterior subgenual prefrontal cortex that leaves the HPA axis particularly prone to disinhibition. This propensity to disinhibition would then tend to prolong depressive episodes and shorten symptom-free periods. Cortical depth in this area may, on the other hand, reflect the intensity and persistence of HPA axis inhibition that predated baseline assessment. These are not mutually exclusive possibilities, and both may be operative to differing degrees. The finding that the posterior subgenual prefrontal cortex structural abnormality lessens over time and that volumetric increase correlates with outcome suggests that the anatomical deficits, at least in part, are reversible results of a disease process and are thus dynamic rather than static.
 |
 |
 |
Received March 25, 2004; revisions received July 12 and Nov. 10, 2004; accepted Nov. 29, 2004. From the Department of Psychiatry, Roy J. and Lucille A. Carver College of Medicine, University of Iowa. Address correspondence and reprint requests to Dr. Coryell, Department of Psychiatry, 2-205 MEB, Roy J. and Lucille A. Carver College of Medicine, University of Iowa, Iowa City, IA 52242-1000; [email protected] (e-mail).

Figure 1. Three-Dimensional Surface Showing the Medial Wall of the Left Cerebral Hemisphere

Figure 2. Volume of the Left Posterior Subgenual Prefrontal Cortex at Baseline and Follow-Up for Patients With Psychotic Depression, Patients With Schizophrenia, and Healthy Comparison Subjects
1. Mayberg HS, Liotti M, Brannan SK, McGinnis S, Mahurin RK, Jerabek PA, Silva JA, Tekell JL, Martin CC, Lancaster JL, Fox PT: Reciprocal limbic-cortical function and negative mood: converging PET findings in depression and normal sadness. Am J Psychiatry 1999; 156:675–682Abstract, Google Scholar
2. Damasio AR, Grabowski TJ, Bechara A, Damasio H, Ponto LL, Parvizi J, Hichwa RD: Subcortical and cortical brain activity during the feeling of self-generated emotions. Nat Neurosci 2000; 3:1049–1056Crossref, Medline, Google Scholar
3. Liotti M, Mayberg HS, Brannan SK, McGinnis S, Jerabek P, Fox PT: Differential limbic-cortical correlates of sadness and anxiety in healthy subjects: implications for affective disorders. Biol Psychiatry 2000; 48:30–42Crossref, Medline, Google Scholar
4. Elliott R, Rubinsztein JS, Sahakian BJ, Dolan RJ: The neural basis of mood-congruent processing biases in depression. Arch Gen Psychiatry 2002; 59:597–604Crossref, Medline, Google Scholar
5. Milad MR, Quirk GJ: Neurons in medial prefrontal cortex signal memory for fear extinction. Nature 2002; 420:70–74Crossref, Medline, Google Scholar
6. Drevets WC: Prefrontal cortical-amygdalar metabolism in major depression. Ann NY Acad Sci 1999; 877:614–637Crossref, Medline, Google Scholar
7. Drevets WC, Raichle ME: Neuroanatomical circuits in depression: implications for treatment mechanisms. Psychopharmacol Bull 1992; 28:261–274Medline, Google Scholar
8. Kennedy SH, Evans KR, Krüger S, Mayberg HS, Meyer JH, McCann S, Arifuzzman AI, Houle S, Vaccarino FJ: Changes in regional brain glucose metabolism measured with positron emission tomography after paroxetine treatment of major depression. Am J Psychiatry 2001; 158:899–905Link, Google Scholar
9. Videbech P, Ravnkilde B, Pedersen TH, Hartvig H, Egander A, Clemmensen K, Rasmussen NA, Andersen F, Gjedde A, Rosenberg R: The Danish PET/Depression Project: clinical symptoms and cerebral blood flow: a regions-of-interest analysis. Acta Psychiatr Scand 2002; 106:35–44Crossref, Medline, Google Scholar
10. Liotti M, Mayberg HS, McGinnis S, Brannan SL, Jerabek P: Unmasking disease-specific cerebral blood flow abnormalities: mood challenge in patients with remitted unipolar depression. Am J Psychiatry 2002; 159:1830–1840Link, Google Scholar
11. Bremner JD, Innis RB, Ng CK, Staib LH, Salomon RM, Bronen RA, Duncan J, Southwick SM, Krystal JH, Rich D, Zubal G, Dey H, Soufer R, Charney DS: Positron emission tomography measurement of cerebral metabolic correlates of yohimbine administration in combat-related posttraumatic stress disorder. Arch Gen Psychiatry 1997; 54:246–254Crossref, Medline, Google Scholar
12. Drevets WC, Price JL, Simpson JR Jr, Todd RD, Reich T, Vannier M, Raichle ME: Subgenual prefrontal cortex abnormalities in mood disorders. Nature 1997; 386:824–827Crossref, Medline, Google Scholar
13. Botteron KN, Raichle ME, Drevets WC, Heath AC, Todd RD: Volumetric reduction in left subgenual prefrontal cortex in early onset depression. Biol Psychiatry 2002; 51:342–344Crossref, Medline, Google Scholar
14. Hirayasu Y, Shenton ME, Salisbury DF, Kwon JS, Wible CG, Fischer IA, Yurgelun-Todd D, Zarate C, Kikinis R, Jolesz FA, McCarley RW: Subgenual cingulate cortex volume in first-episode psychosis. Am J Psychiatry 1999; 156:1091–1093Abstract, Google Scholar
15. Winokur G: Familial (genetic) subtypes of pure depressive disease. Am J Psychiatry 1979; 136:911–913Link, Google Scholar
16. Bremner JD, Vythilingam M, Vermetten E, Nazeer A, Adil J, Khan S, Staib LH, Charney DS: Reduced volume of orbitofrontal cortex in major depression. Biol Psychiatry 2002; 51:273–279Crossref, Medline, Google Scholar
17. Kegeles LS, Malone KM, Slifstein M, Ellis SP, Xanthopoulos E, Keilp JG, Campbell C, Oquendo M, Van Heertum RL, Mann JJ: Response of cortical metabolic deficits to serotonergic challenge in familial mood disorders. Am J Psychiatry 2003; 160:76–82Link, Google Scholar
18. Nolan CL, Moore GJ, Madden R, Farchione T, Bartoi M, Lorch E, Stewart CM, Rosenberg DR: Prefrontal cortical volume in childhood-onset major depression: preliminary findings. Arch Gen Psychiatry 2002; 59:173–179Crossref, Medline, Google Scholar
19. Schlesser MA, Winokur G, Sherman BM: Genetic subtypes of unipolar primary depressive illness distinguished by hypothalamic-pituitary-adrenal axis activity. Lancet 1979; 1(8119):739–741Crossref, Medline, Google Scholar
20. Coryell W, Gaffney G, Burkhardt PE: The dexamethasone suppression test and familial subtypes of depression—a naturalistic replication. Biol Psychiatry 1982; 17:33–40Medline, Google Scholar
21. Coryell W, Smith R, Cook B, Moucharafieh S, Dunner F, House D: Serial dexamethasone suppression test results during antidepressant therapy: relationship to diagnosis and clinical change. Psychiatry Res 1983; 10:165–174Crossref, Medline, Google Scholar
22. Nelson JC, Davis JM: DST studies in psychotic depression: a meta-analysis. Am J Psychiatry 1997; 154:1497–1503Link, Google Scholar
23. Flaum MA, Andreasen NC, Arndt S: The Iowa Prospective Longitudinal Study of Recent-Onset Psychoses. Schizophr Bull 1992; 18:481–490Crossref, Medline, Google Scholar
24. Andreasen NC, Arndt S, Alliger R, Miller D, Flaum M: Symptoms of schizophrenia: methods, meanings, and mechanisms. Arch Gen Psychiatry 1995; 52:341–351Crossref, Medline, Google Scholar
25. Andreasen NC, Flaum M, Arndt S: The Comprehensive Assessment of Symptoms and History (CASH): an instrument for assessing diagnosis and psychopathology. Arch Gen Psychiatry 1992; 49:615–623Crossref, Medline, Google Scholar
26. Magnotta VA, Harris G, Andreasen NC, O’Leary DS, Yuh WT, Heckel D: Structural MR image processing using the BRAINS2 toolbox. Comput Med Imaging Graph 2002; 26:251–264Crossref, Medline, Google Scholar
27. Harris G, Andreasen NC, Cizadlo T, Bailey JM, Bockholt HJ, Magnotta VA, Arndt S: Improving tissue classification in MRI: a three-dimensional multispectral discriminant analysis method with automated training class selection. J Comput Assist Tomogr 1999; 23:144–154Crossref, Medline, Google Scholar
28. Cizadlo T, Harris G, Heckel D, Flaum M, Christian B, O’Leary DS, Andreasen NC: An automated method to quantify the area, depth, and convolutions of the cerebral cortex from MR data: BRAINSURF (abstract). NeuroImage 1997; 5(suppl 2):S402Google Scholar
29. Crespo-Facorro B, Kim J, Andreasen NC, Spinks R, O’Leary DS, Bockholt HJ, Harris G, Magnotta VA: Cerebral cortex: a topographic segmentation method using magnetic resonance imaging. Psychiatry Res 2000; 100:97–126Crossref, Medline, Google Scholar
30. Ongur D, An X, Price JL: Prefrontal cortical projections to the hypothalamus in macaque monkeys. J Comp Neurol 1998; 401:480–505Crossref, Medline, Google Scholar
31. Ongur D, Price JL: The organization of networks within the orbital and medial prefrontal cortex of rats, monkeys and humans. Cereb Cortex 2000; 10:206–219Crossref, Medline, Google Scholar
32. Freedman LJ, Insel TR, Smith Y: Subcortical projections of area 25 (subgenual cortex) of the macaque monkey. J Comp Neurol 2000; 421:172–188Crossref, Medline, Google Scholar
33. Keller MB, Lavori PW, Friedman B, Nielsen E, Endicott J, McDonald-Scott P, Andreasen NC: The Longitudinal Interval Follow-Up Evaluation: a comprehensive method for assessing outcome in prospective longitudinal studies. Arch Gen Psychiatry 1987; 44:540–548Crossref, Medline, Google Scholar
34. Endicott J, Spitzer RL, Fleiss JL, Cohen J: The Global Assessment Scale: a procedure for measuring overall severity of psychiatric disturbance. Arch Gen Psychiatry 1976; 33:766–771Crossref, Medline, Google Scholar
35. Raz N, Gunning FM, Head D, Dupuis JH, McQuain J, Briggs SD, Loken WJ, Thornton AE, Acker JD: Selective aging of the human cerebral cortex observed in vivo: differential vulnerability of the prefrontal gray matter. Cereb Cortex 1997; 7:268–282Crossref, Medline, Google Scholar
36. Good CD, Johnsrude IS, Ashburner J, Henson RN, Friston KJ, Frackowiak RS: A voxel-based morphometric study of ageing in 465 normal adult human brains. Neuroimage 2001; 14(1, part 1):21–36Google Scholar
37. Sowell ER, Peterson BS, Thompson PM, Welcome SE, Henkenius AL, Toga AW: Mapping cortical change across the human life span. Nat Neurosci 2003; 6:309–315Crossref, Medline, Google Scholar
38. Mayberg HS, Brannan SK, Tekell JL, Silva JA, Mahurin RK, McGinnis S, Jerabek PA: Regional metabolic effects of fluoxetine in major depression: serial changes and relationship to clinical response. Biol Psychiatry 2000; 48:830–843Crossref, Medline, Google Scholar
39. Diorio D, Viau V, Meaney MJ: The role of the medial prefrontal cortex (cingulate gyrus) in the regulation of hypothalamic-pituitary-adrenal responses to stress. J Neurosci 1993; 13:3839–3847Crossref, Medline, Google Scholar
40. Brake WG, Flores G, Francis D, Meaney MJ, Srivastava LK, Gratton A: Enhanced nucleus accumbens dopamine and plasma corticosterone stress responses in adult rats with neonatal excitotoxic lesions to the medial prefrontal cortex. Neuroscience 2000; 96:687–695Crossref, Medline, Google Scholar
41. Wolf OT, Convit A, deLeon MJ, Caraos C, Qadri SF: Basal hypothalamo-pituitary-adrenal axis hyperactivity and corticotropin feedback in young and older men: relationships to magnetic resonance imaging derived hippocampus and cingulate gyrus volumes. Neuroendocrinology 2002; 75:241–249Crossref, Medline, Google Scholar
42. Rudorfer MV, Hwu HG, Clayton PJ: Dexamethasone suppression test in primary depression: significance of family history and psychosis. Biol Psychiatry 1982; 17:41–48Medline, Google Scholar
43. Coppen A, Abou-Saleh M, Milln P, Metcalfe M, Harwood J, Bailey J: Dexamethasone suppression test in depression and other psychiatric illness. Br J Psychiatry 1983; 142:498–504Crossref, Medline, Google Scholar
44. Rush AJ, Giles DE, Roffwarg HP, Parker CR: Sleep EEG and dexamethasone suppression test findings in outpatients with unipolar major depressive disorders. Biol Psychiatry 1982; 17:327–341Medline, Google Scholar