Basal Ganglia Shape Alterations in Bipolar Disorder
Abstract
OBJECTIVE: Shape differences in the caudate heads and putamen were compared between drug-naive and drug-treated patients with bipolar disorder and healthy comparison subjects by using spherical harmonic (SPHARM) techniques. On the basis of previous studies, the authors hypothesized that the drug-naive patients would exhibit shape differences of the caudate heads and putamen, especially on the right side, relative to the healthy comparison subjects, and that shape differences, relative to healthy comparison subjects, would differ between drug-naive and drug-treated patients. METHOD: Brain magnetic resonance images were acquired from 49 bipolar disorder patients (21 drug-naive and 28 drug-treated patients) and 37 healthy comparison subjects. Volumetric measurements were obtained, and SPHARM descriptions were used to measure between-group radius differences in the surfaces of the caudate heads and putamen. RESULTS: Although no significant between-group volume differences were found in the striatal structures, significant shape differences in the anterior and ventral surfaces of the striatum were observed. Specifically, shape differences, more prominent for the right side, were found for drug-naive bipolar disorder patients, relative to the healthy comparison subjects, but not for drug-treated bipolar disorder subjects. CONCLUSIONS: The findings suggest that drug-naive bipolar disorder patients have shape differences of the striatum, relative to healthy comparison subjects, and that these differences may be modulated by treatment. The findings more generally demonstrate the sensitivity of the SPHARM analytic technique for detecting subtle anatomical shape differences in small brain regions in the absence of volume differences.
The proposed role of the basal ganglia in mediating symptoms underlying bipolar disorder is based on reports of patients who developed bipolar disorder subsequent to the development of basal ganglia lesions, especially on the right side (1, 2). Although prior studies have resulted in variable reports of larger (3, 4) or smaller (1) basal ganglia volumes in bipolar disorder patients, relative to healthy comparison subjects, most studies of bipolar disorder have not found significant volume differences in those structures (5–11).
The basal ganglia comprise a heterogeneous brain region, both anatomically and functionally, that includes the striatum, as well as the nucleus accumbens and globus pallidum. The principal anatomical component of the basal ganglia is the striatum, which is differentiated into the caudate nucleus and putamen regions. A number of authors have suggested a more detailed functional subdivision of the striatum (12–17). For example, Parent and Hazrati (17) proposed a tripartite anatofunctional subdivision of the striatum (caudate and putamen) into motor, associative, and limbic regions. On the basis of a diffusion tensor imaging investigation of fiber tract projections, Lehericy et al. (18) suggested a functional subdivision of the human striatum into anterior (associative), posterior (sensorimotor), and ventral (limbic) components.
Conventional volumetric measurement approaches are not sensitive enough to reliably detect subtle volume changes in functional subdivisions of the striatum that are hypothesized to be altered in bipolar disorder. In contrast, shape analysis techniques can potentially detect subtle group differences in shape where there are no volume differences (19). Spherical harmonic (SPHARM) description is a relatively new shape analysis technique that can detect subtle structural alterations in small structures of the brain (20). SPHARM description is an efficient parameterization method with transformation invariance, noise robustness, and uniqueness. Characterization, classification, recognition, and segmentation by means of SPHARM descriptors have been used to characterize subtle shape characteristics in magnetic resonance imaging (MRI) analyses of many subcortical brain regions (21, 22).
In the current study, we hypothesized that drug-naive patients with bipolar disorder, relative to healthy comparison subjects, would exhibit characteristic shape differences in the associative and limbic regions of the striatum that are implicated in bipolar disorder. On the basis of earlier reports suggesting lateralized neuroanatomical abnormalities in bipolar disorder (1, 2), we further hypothesized that these shape differences would be more prominent on the right side. We additionally hypothesized that the pattern of striatal shape differences in drug-naive bipolar disorder patients would be different from that observed in drug-treated bipolar disorder patients. This hypothesis was supported by earlier reports of anatomical, functional, and metabolic effects of psychotropic medications on the caudate nuclei (23–25). Using a large MRI data set acquired from symptomatic drug-naive bipolar disorder patients, drug-treated bipolar disorder patients, and healthy comparison subjects, we applied the SPHARM technique and conventional volumetric analysis to compare the shape and volume of caudate heads and putamen between groups.
Method
Subjects
Inclusion criteria for the bipolar disorder patients were 1) an age range of 18–55 years and 2) a DSM-IV diagnosis of bipolar I disorder or bipolar II disorder, as determined by a DSM-IV-based structured clinical interview administered by an experienced psychiatrist (26). Exclusion criteria were 1) any other current or lifetime comorbid axis I disorder, substance abuse within the last 3 months, or axis II antisocial personality disorder; 2) current or past history of any significant medical or neurological illnesses; 3) history of head trauma, seizure, learning disorder, or attention deficit hyperactivity disorder; and 4) contraindications to MR scanning (metallic implants, pacemaker, pregnancy, or claustrophobia).
Forty-nine bipolar disorder patients were recruited through the Psychopharmacology Research Laboratory at McLean Hospital, the Bipolar Disorders Research Unit at Massachusetts General Hospital, and the Center for Anxiety and Depression at the University of Washington. Twenty-one of the 49 patients were drug naive, and 28 were taking medication and were stable (Table 1). Thirty-seven healthy comparison subjects were similarly evaluated and found to be free of DSM-IV axis I diagnoses and a family history of major depression or bipolar disorder in first-degree relatives.
The consent form and the research protocol were approved by the respective university and/or hospital institutional review boards. All subjects reviewed the consent form and gave written informed consent in the presence of a study physician before participation in the study.
The demographic and clinical characteristics of the study subjects are presented in Table 1. No significant differences in age, sex composition, and handedness were found between the study groups. The primary psychotropic medications taken by the drug-treated bipolar disorder patients were lithium (N=11, 39.3%), valproate (N=7, 25.0%), and atypical antipsychotics (N=10, 35.7%).
MR Image Acquisition
Brain MR images were acquired with a 1.5-T whole-body imaging system (Signa Horizon EchoSpeed, General Electric Medical Systems, Milwaukee) and a custom-made linear birdcage coil with approximately 40% improvement in signal-to-noise ratio and improved homogeneity over standard quadrature head coil (C. Hayes, personal communication, 1996). Identical scanners, custom-built linear head coils, and imaging acquisition parameters were used at both scanning sites (26). To assess comparability across scanners, we scanned identical phantoms and the principal investigators on both scanners at regular intervals during the period of data acquisition (3 years). These data were stable and comparable over this time period.
A three-dimensional spoiled gradient echo pulse sequence was used to produce 124 1.5-mm-thick contiguous coronal images (TE=5 msec, TR=35 msec, 256×192 matrix, field of view=24 cm, flip angle=45°, number of excitations=1). Axial-proton-density-weighted and T2-weighted images (TE=30/80 msec, TR=3000 msec, 256×192 matrix, field of view=24 cm, flip angle=45°, number of excitations=0.5, 3-mm-thick slices, no skip) were obtained to screen for brain structural abnormalities.
Segmentation of Striatum
All acquired spoiled gradient-recall acquisition volumes were realigned so that the anterior-posterior axis of the brain was parallel to the intercommissural line and the other two axes were aligned along the interhemispheric fissure. T1 images of the caudate heads and putamen were segmented manually by using the guidelines of the Iowa Mental Health Clinical Research Center (http://iowa-mhcrc.psychiatry.uiowa.edu/mhcrc/IPLpages/altTracing.htm). These procedures were performed with Analyze 5.0 image visualization and processing software (Biomedical Imaging Resource, Mayo Clinic, Rochester, Minn. [(http://www.mayo.edu/bir]).
Figure 1 shows the demarcation of the striatal structures. Anatomical demarcation of the caudates was as follows: 1) Segmentation of the caudates started at a coronal plane where the anterior horns of the lateral ventricles are first visualized and ended at a plane where the colliculi disappear. If the terminus of the caudates could not be clearly visualized before the point where the colliculi disappeared, this point was defined as the posterior boundary. 2) The ventral boundary was the nucleus accumbens, which forms a bridge of tissue between the caudate and the lenticular nucleus, first visualized with the appearance of the putamen. 3) The internal capsule constituted the lateral boundary. 4) The medial boundary was formed by the lateral ventricle (27–30).
Anatomical demarcation of the putamen was as follows: 1) The rostral section of the putamen that could be visualized at the ventrolateral surface of the caudate constituted the rostral boundary that typically began within two or three slices after the caudate was first visualized. Although the putamen bordered on the caudate, signal intensities of these two structures differed sufficiently to allow separation. The rostral boundary was then followed caudally to 2) the medial boundary formed by the internal capsule and 3) the lateral boundary defined by the white matter intercalated between the putamen and claustrum. 4) The tracing of the putamen was continued caudally until it could no longer be clearly visualized, usually four or five slices before the caudate terminated (27–30).
Volumetric measurements of segmented regions were carried out by using Analyze 5.0. To establish measurement reliability for manual segmentation, two experienced raters (J.H., S.J.K.), who were blind to the subjects’ demographic and clinical characteristics, independently performed regional segmentations using the same subset of MR studies (N=25). Intrarater reliability was tested by one rater (S.J.K.), who unknowingly measured the same subset of MR studies (N=25) over a 1-week interval. Interrater reliability (assessed with intraclass correlation coefficients) was 0.84 for the left caudate, 0.88 for the right caudate, 0.93 for the left putamen, and 0.95 for the right putamen. Intrarater reliability was 0.89 for the left caudate, 0.93 for the right caudate, 0.92 for the right putamen, and 0.94 for the left putamen.
Statistical Analysis
To evaluate for the differences between the study groups, independent t tests, analysis of variance (ANOVA), and analysis of covariance (ANCOVA) with Tukey post hoc tests were performed. To avoid multiple comparison issues, repeated-measures ANCOVA was used to test for differences in the four striatal structures (left and right caudate heads, left and right putamen) between groups.
Between-group comparisons involving categorical data were assessed using Fisher’s exact test for two-by-k table, where k reflects the categorical variables. Statistical significance was defined at an alpha level less than 0.05 in two-tailed tests. All analyses were performed with Statistica 6 for Windows (StatSoft, Tulsa, Okla.).
Shape Analysis Procedures
Parameterization of object surfaces
The surfaces of the regions of interest were extracted by using the Marching Cube algorithm to make polygons from manually segmented data (31). For multiple subject comparisons, we performed an appropriate transformation using first-order SPHARM in the region-of-interest space to make the region of interest independent of translation, rotation, and scale (21). In a parameterization stage, through which a polygonized surface is mapped onto a sphere, we used a simple alternative heuristic approach modified from the work of Sijbers et al. (20). The vertices were deformed toward the surface of a sphere depending on the distance from the vertex to the center of the target sphere (20, 21). In every iteration, we performed area equalization to ensure the area equality of every polygonal facet. This polygonized surface consisted of parameterized vertices on the unit sphere (20).
SPHARM-based description and comparison between multiple subjects
The SPHARM description was used for shape modeling. This procedure is a Fourier analysis in the spherical domain that is closely associated with Legendre polynomials. The order of spherical harmonics was set as 25, an order number that was fine enough for description of the shapes of the putamen and caudate heads and was also appropriate in the sense of allowing tractable calculations. The least squares fitting was used for fitting the coefficients of spherical harmonic descriptors. To construct corresponding vertices of each region of interest for comparison between multiple subjects, we conducted the resampling of a sphere into polyhedra, as generally used in the point distribution model, where the number of vertices of the polyhedra was 4,181.
Visualization modeling and statistical analysis
Individual shapes of the putamen and caudate heads were produced by the SPHARM-by-coefficients matrix, and the mean shape of the putamen and caudate heads was formed by the SPHARM-by-averaged coefficients matrix. The volumes of the caudate and putamen of each subject were normalized. Consequently, we could extract a radius from each corresponding vertex of the putamen and caudate heads. The radius reflects the distance from the center of vertices to the vertex of interest. Following these transformations, t values were generated for statistical analysis by using radius differences between groups. Statistical significance was defined based on an alpha level less than 0.05 and clustered vertex points of no less than 15. The regions of significant shape differences in the drug-naive bipolar disorder group were visualized in relationship to the mean shape of the caudate or putamen in the healthy comparison group (Figure 2 and Figure 3) or the drug-treated bipolar disorder group (Figure 4).
The number of vertex points with significant differences between the groups was also assessed. The proportions of the points (increased or decreased radius) on the surface between the left and right sides of each structure were compared in order to characterize the laterality of shape differences.
Results
The results of the volumetric analyses are presented in Table 2. No significant differences between groups were found for whole brain volumes. Striatal volume differences did not reach significance between groups for the left and right caudate volumes or for the left and right putamen volumes adjusted for whole brain volume (Table 2).
When the patients with bipolar I disorder and those with bipolar II disorder, not differentiated by medication status, were compared to the healthy comparison group, significant differences in whole brain volume were observed. However, the volumes of the individual striatal structures were not significantly different between groups after adjustment for whole brain volume (all F<2.90, df=2, 82, all p>0.06, ANCOVA).
On the basis of observed brain volume differences in the bipolar I disorder group, we repeated the three-group comparison, differentiating bipolar disorder patients on the basis of medication status and including only those patients with a diagnosis of bipolar I disorder (i.e., drug-treated bipolar I disorder patients versus drug-naive bipolar I disorder patients versus healthy comparison subjects). This comparison was done because the difference in distributions of the bipolar disorder subtypes in the drug-treated and drug-naive groups, although not statistically significant, might have confounded the results. Again, no significant differences were observed between the drug-naive bipolar I disorder subjects (N=18), the drug-treated bipolar I disorder subjects (N=17), and healthy comparison subjects (N=37) in whole brain volume or striatal volumes (Table 2).
As shown in Figure 2, Figure 3, and Figure 4, regional shape differences were found between the drug-naive bipolar disorder group and the healthy comparison group, between the drug-treated bipolar disorder group and the healthy comparison group, and between the drug-naive bipolar disorder group and the drug-treated bipolar disorder group.
Shape Differences in Drug-Naive Bipolar Disorder Patients
In the right caudate in the drug-naive bipolar disorder group, compared to the healthy subjects, regions with significantly decreased radii were found on both the posterodorsal and anteroventral surfaces (11.2 and 9.4% decreases, respectively) and increased radii were found on the dorsal surface (8.3% increase). In the left caudate in the drug-naive bipolar disorder group, relative to the healthy subjects, significantly increased radii were found on the anterodorsal surface (4.8% increase) and significantly decreased radii were found on both the anterodorsal and posteroventral surfaces (6.3% and 11.7% decreases, respectively). In the right putamen in the drug-naive bipolar disorder group, relative to the healthy subjects, significant shape differences were found for anteromedial (3.4% increase) and posterolateral (4.0% increase) surface radii and for anteromedial and lateral surface radii (6.5% and 4.0% decreases, respectively). In the left putamen, the drug-naive bipolar disorder group had regions of significant shape differences, relative to the healthy subjects, for the ventrolateral and dorsomedial surface radii (7.3% and 3.8% decreases, respectively).
Shape Differences in Drug-Treated Bipolar Disorder Patients
In the right caudate, no significant shape differences were observed between the drug-treated bipolar disorder group and the healthy comparison group. In the left caudate, the drug-treated bipolar disorder group, relative to the healthy subjects, had significant shape differences in the anteroventral surface (5.6% increase). Regions of decreased radius (8.8% decrease) were observed for the posteroventral surface in the drug-treated bipolar disorder group, compared to the healthy subjects. In the right putamen, no significant shape differences between groups were found. In the left putamen, significant shape differences were observed in the drug-treated bipolar disorder group, relative to the healthy subjects, for the medial surface (one region had a decrease in radii of 10.3%) and the lateral surface (two regions had decreases in radii of 3.2% and 2.8%, respectively).
Shape Differences in Drug-Naive Bipolar Disorder Subjects Compared to Drug-Treated Bipolar Disorder Subjects
The shape differences that were observed between the drug-naive and drug-treated patients with bipolar disorder were similar to those observed between the drug-naive bipolar disorder patients and the healthy comparison subjects.
In the right caudate, regions of decreased radii were found on the posterodorsal and anteroventral surfaces (12.9% and 11.0%, respectively) in the drug-naive patients, relative to the drug-treated patients. In the left caudate, shape differences in the drug-naive group, relative to the treated group, were found on both anterodorsal and posteroventral surfaces (radii increased by 4.9% and decreased by 10.4%, respectively). In the right putamen, shape differences in the drug-naive group, relative to the treated group, were found for the medial surface regions, varying from 3.3% increases to 10.6% decreases in radii, and for two regions of the lateral surface, where radii were increased by 4.3%. In the left putamen, shape differences in the drug-naive group, relative to the treated group, were found on the both the medial (radii increased by 3.3%) and lateral surfaces (5.5% increase in radii in one region and 8.9% decrease in another region).
Other Shape Analyses
Additional exploratory shape analyses were conducted to assess 1) the potential confounding effect of the different proportions of bipolar I disorder versus bipolar II disorder subjects in the drug-naive and drug-treated groups, 2) the effect of handedness, 3) the influence of medications, and 4) differences between subjects with bipolar I disorder and those with bipolar II disorder. The findings are briefly described in Data Supplement 1, which is available with the online version of this article at http://ajp.psychiatryonline.org. Detailed information about the analyses is available on request from the first author.
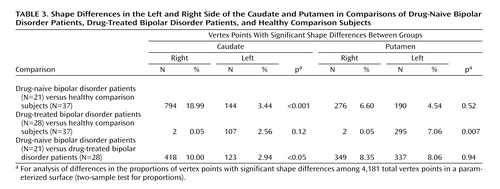
Another index of shape differences that also provides an indication of lateralization is comparison of the number of right and left caudate or putamen vertex points with significant shape differences between the groups. These results, presented in Table 3, indicate that the drug-naive bipolar disorder group, compared to the healthy group and to the drug-treated bipolar disorder group, had a higher proportion and rate of caudate shape differences on the right side relative to the left side (p<0.001 and p<0.05, respectively, two-sample test for proportions). In addition, the drug-treated bipolar disorder patients, compared to the healthy comparison subjects, had a lower proportion and rate of putamen shape differences on the right side relative to the left side (p=0.007, two-sample test for proportions).
Discussion
To our knowledge, this is the first study to report shape alterations of the right striatum in drug-naive subjects with bipolar disorder. Shape analysis had greater sensitivity than conventional region-of-interest volumetric methods in detecting subtle anatomical differences in these small brain structures. The inconsistent findings for striatal abnormalities in bipolar disorder reported in previous studies with conventional volumetric methods may, in part, reflect power limitations related to factors of measurement sensitivity and reliability (32, 33). Because changes in striatal shape may occur without detectable changes in overall volume, and vice versa, shape analysis can provide a complementary approach to volumetric methods in the systematic evaluation of regional structural abnormalities of the striatum associated with specific psychiatric disorders, such as bipolar disorder.
Although we found between-group differences in some striatal volumes when the results were adjusted for whole brain volumes, these differences did not reach significance. Previous volumetric studies of the basal ganglia in bipolar disorder have produced inconsistent findings (1, 4, 8, 10, 34) that may have been influenced by the effects of sample sizes and differences in the demographic and clinical characteristics of the study populations. For example, in prior studies, the bipolar disorder groups have consisted of solely drug-treated subjects (4, 8, 11), subjects with inconsistent treatment histories and various symptom severities and presentations (10), and subjects with substantial comorbidity (11). As further discussed later in this section, our findings suggest that drug treatment status is an important factor in assessing striatal differences in this population.
We did not find significant differences in basal ganglia volumes between drug-naive bipolar disorder patients (N=21) and healthy comparison subjects (N=37). In contrast, Strakowski et al. (3) reported enlargement of the putamen in first-episode bipolar disorder patients, most of whom were drug naive (N=18), compared to healthy volunteers (N=32). This difference in findings may reflect differences in the clinical characteristics of the bipolar disorder groups. In the study by Strakowski et al. (3), the patients were predominantly bipolar I disorder patients who were admitted for a first episode of mania, whereas our study included both patients with bipolar I disorder and patients with bipolar II disorder who were predominantly depressed. Also, the patients in our study were older (by approximately 10 years) than the patients in the study by Strakowski et al.
We observed two major shape differences in the bipolar disorder patients, relative to the healthy comparison subjects. First, we found striatal shape differences primarily in the drug-naive bipolar disorder patients, particularly on the right side, compared to the healthy subjects and the drug-treated bipolar disorder patients. The right hemisphere is known to process and operate on nonverbal material and intrinsic functions, whereas the left hemisphere mainly mediates language-related functions. In bipolar disorder patients, performance IQ has been reported to be lower than verbal IQ, and nonverbal, visuospatial, and abstraction abilities have been found to be more severely affected than verbal skills; these differences suggest right or nondominant hemisphere dysfunction (35). In addition, a recent meta-analysis of brain volumetric studies in bipolar disorder reported that right-sided ventricle enlargement was one of the most consistent findings (36).
Second, this pattern of shape differences in drug-naive bipolar disorder patients, relative to healthy comparison subjects, was not observed in the drug-treated bipolar disorder patients. Chakos et al. (23) reported that subjects with first-episode schizophrenia taking antipsychotics had larger caudate volumes after longitudinal follow-up over 18 months. Normalization of caudate glutamatergic concentration after paroxetine treatment in pediatric obsessive-compulsive disorder patients was also reported (24). In bipolar disorder, Yatham et al. (25) found that caudate presynaptic dopamine function decreased after divalproex sodium treatment. In addition, Manji et al. (37) reported that lithium treatment might have neuroprotective effects in mood disorder. Despite the limitations of the current study, which include the cross-sectional design and the heterogeneous characteristics of medications prescribed for the drug-treated patients, our results suggest that the caudate and putamen shape abnormalities observed in the bipolar disorder patients may be modulated with treatment. Further work evaluating longitudinal shape changes in drug-naive subjects who begin taking medication will help address this consideration.
Lehericy et al. (18) recently studied corticostriatal circuits in humans by using a diffusion tensor imaging axonal mapping technique. They observed that the associative compartment of the striatum (anterior striatum) was connected to the prefrontal cortex, frontal pole, and presupplementary motor area. In addition, the limbic compartment of the striatum (ventral striatum) was connected to the orbitomedial frontal cortex and temporal lobe. The sensorimotor compartment of the putamen (the posterior part of putamen) was connected to primary sensory and motor areas and to the posterior part of the supplementary motor area. These findings are generally in accord with the results of previous anatomical studies on corticostriatal circuits in nonhuman primates (13, 38, 39).
Consequently, subcortical regions with shape differences in our study may be associated with a specific cerebral region, for example, the frontal and limbic areas. In the current study, shape differences in the anterior part of both caudates and the anterior part of the right and left putamen were observed in drug-naive bipolar disorder subjects, relative to healthy comparison subjects and drug-treated bipolar disorder subjects. These striatal regions, which predominantly constitute the associative territory of the striatum (18), may be related to the cognitive impairment found in bipolar disorder; this impairment includes executive dysfunction, attention deficit, visuospatial dysfunction, and slowed information processing and has been shown to be closely related to dysfunction of the frontal lobes and basal ganglia (40).
Levitt et al. (41) reported that the surface-to-volume ratio of the caudate head was increased and lateralized to the right side in neuroleptic-naive patients with schizophrenia spectrum disorders and that greater surface-to-volume ratio of the caudate head was inversely correlated with decreased neuropsychological performance. These findings suggest that cognitive abnormalities might be related to shape differences of the caudate head. Thus, in bipolar disorder, there may be a relatively subtle prefrontal modulation of the subcortical anatomy, which may, in turn, produce the characteristic cognitive impairments (34).
We also observed that the ventral caudate was “shrunken” in drug-naive bipolar patients, relative to healthy comparison subjects and drug-treated bipolar disorder patients. Several functional imaging studies have provided evidence for abnormalities in the limbic-striatal-pallidal-thalamic circuits in bipolar disorder (42). The ventral putamen is included in the limbic territory of the striatum that is connected to the orbitomedial frontal cortex (18). This ventral putamen territory processes emotional or motivational information, and “shrinkage” of this area could occur in association with mood abnormalities (17). According to conventional volumetric analyses, volume reduction for a specific structure has been considered to signify loss of its function. Thus, deflated or shrunken surface regions might implicate areas of discrete functional deficits, and inflated surface regions may potentially reflect pathological or compensatory processes.
This study has several limitations, including the small number of subjects, which limits the generalization of the findings, and the limited resolution of the MR images at the 1.5-T MR scanner field strength. In addition, as a result of the multiple comparisons, identification of increased or decreased radii in small regions may represent type I error. Also, the bipolar disorder group in our study was heterogeneous and included both bipolar I disorder patients and bipolar II disorder patients who were differentially distributed across the drug-naive and drug-treated groups. However, the results of additional shape analyses that focused on the bipolar I disorder subgroup demonstrated a similar direction to the results obtained for the entire bipolar disorder group, suggesting that diagnostic heterogeneity was not a substantial confounding factor. Finally, the drug-treated patients were taking a variety of medications, and thus our ability to assess effects of treatment on the modulation of basal ganglia shape abnormalities in bipolar disorder was limited.
In the absence of consistent striatal volume differences in prior imaging studies of bipolar disorder, shape analysis may provide a sensitive method that better characterizes subtle brain anatomical relationships in bipolar disorder. In this study, despite similar volumes across the study groups, subtle right-sided shape differences in the caudate head and putamen were demonstrated in drug-naive bipolar disorder subjects. In contrast, stable bipolar disorder subjects who were taking medication had less dramatic differences, suggesting potential medication effects. Future work with higher field strength scanners that provide greater anatomical resolution, as well as efforts to combine more sensitive structural analytic techniques with the complementary modalities of MR spectroscopic imaging and diffusion tensor imaging, will be helpful in extending these results.
 |
 |
 |
Received Oct. 8, 2004; revisions received Jan. 2 and Feb. 7, 2005; accepted March 7, 2005. From McLean Hospital Brain Imaging Center, Department of Psychiatry, Harvard Medical School, Boston; the Department of Psychiatry and Interdisciplinary Program of Biomedical Engineering, Seoul National University, Seoul, Korea; and the Department of Radiology and the Center for Anxiety and Depression, Department of Psychiatry and Behavioral Science, University of Washington School of Medicine, Seattle. Address correspondence and reprint requests to Dr. Lyoo, Department of Psychiatry, Seoul National University Hospital, 28 Yongon-dong, Chongno-gu, Seoul, 110-744, South Korea; [email protected] (e-mail).This study was partly supported by NIMH grant MH-58681, the Stanley Medical Research Institute (I.K.L.), the Stanley Foundation Bipolar Disorders Research Grant at McLean Hospital, the Poitras Foundation (P.F.R.), the National Alliance for Research on Schizophrenia and Depression Young Investigator Award (I.K.L.), and the Harvard–MIT Clinical Investigator Training Program Award (I.K.L.).A summary of findings from additional exploratory analyses associated with this study accompanies the online version of the article.

Figure 1. Demarcation of the Caudate and Putamena
aThe left and right caudates and left and right putamen were delineated on coronal magnetic resonance T1 images from the rostral to caudal direction.

Figure 2. Regions of the Caudate and Putamen With Shape Differences in Drug-Naive Bipolar Disorder Patients (N=21) Compared to Healthy Subjects (N=37)a
aRegions of shape differences (regions of increased and decreased radii are colored by red and blue, respectively) are displayed on the mean shape of the caudate and putamen in healthy comparison subjects after size differences were normalized to the volume (p<0.05, clustered vertex points >15).

Figure 3. Regions of the Caudate and Putamen With Shape Differences in Drug-Treated Bipolar Disorder Patients (N=28) Compared to Healthy Subjects (N=37)a
aRegions of shape differences (regions of increased and decreased radii are colored by red and blue, respectively) are displayed on the mean shape of the caudate and putamen of healthy comparison subjects after size differences were normalized to the volume (p<0.05, clustered vertex points >15).

Figure 4. Regions of the Caudate and Putamen With Shape Differences in Drug-Naive Bipolar Disorder Patients (N=21) Compared to Drug-Treated Bipolar Disorder Patients (N=28)a
aRegions of shape differences (regions of increased and decreased radii are colored by red and blue, respectively) are visualized on the mean shape of the caudate and putamen of drug-treated bipolar disorder patients after size differences were normalized to the volume (p<0.05, clustered vertex points >15).
1. Robinson RG, Starkstein SE: Mood disorders following stroke: new findings and future directions. J Geriatr Psychiatry 1989; 22:1–15Medline, Google Scholar
2. Starkstein SE, Mayberg HS, Berthier ML, Fedoroff P, Price TR, Dannals RF, Wagner HN, Leiguarda R, Robinson RG: Mania after brain injury: neuroradiological and metabolic findings. Ann Neurol 1990; 27:652–659Crossref, Medline, Google Scholar
3. Strakowski SM, DelBello MP, Zimmerman ME, Getz GE, Mills NP, Ret J, Shear P, Adler CM: Ventricular and periventricular structural volumes in first- versus multiple-episode bipolar disorder. Am J Psychiatry 2002; 159:1841–1847Link, Google Scholar
4. Aylward EH, Roberts-Twillie JV, Barta PE, Kumar AJ, Harris GJ, Geer M, Peyser CE, Pearlson GD: Basal ganglia volumes and white matter hyperintensities in patients with bipolar disorder. Am J Psychiatry 1994; 151:687–693Link, Google Scholar
5. Swayze VW II, Andreasen NC, Alliger RJ, Yuh WT, Ehrhardt JC: Subcortical and temporal structures in affective disorder and schizophrenia: a magnetic resonance imaging study. Biol Psychiatry 1992; 31:221–240Crossref, Medline, Google Scholar
6. Strakowski SM, Wilson DR, Tohen M, Woods BT, Douglass AW, Stoll AL: Structural brain abnormalities in first-episode mania. Biol Psychiatry 1993; 33:602–609Crossref, Medline, Google Scholar
7. Harvey I, Persaud R, Ron MA, Baker G, Murray RM: Volumetric MRI measurements in bipolars compared with schizophrenics and healthy controls. Psychol Med 1994; 24:689–699Crossref, Medline, Google Scholar
8. Dupont RM, Jernigan TL, Heindel W, Butters N, Shafer K, Wilson T, Hesselink J, Gillin JC: Magnetic resonance imaging and mood disorders: localization of white matter and other subcortical abnormalities. Arch Gen Psychiatry 1995; 52:747–755Crossref, Medline, Google Scholar
9. Sax KW, Strakowski SM, Zimmerman ME, DelBello MP, Keck PE Jr, Hawkins JM: Frontosubcortical neuroanatomy and the Continuous Performance Test in mania. Am J Psychiatry 1999; 156:139–141Link, Google Scholar
10. Brambilla P, Harenski K, Nicoletti MA, Mallinger AG, Frank E, Kupfer DJ, Keshavan MS, Soares JC: Anatomical MRI study of basal ganglia in bipolar disorder patients. Psychiatry Res 2001; 106:65–80Crossref, Medline, Google Scholar
11. DelBello MP, Zimmerman ME, Mills NP, Getz GE, Strakowski SM: Magnetic resonance imaging analysis of amygdala and other subcortical brain regions in adolescents with bipolar disorder. Bipolar Disord 2004; 6:43–52Crossref, Medline, Google Scholar
12. Alexander GE, Crutcher MD, DeLong MR: Basal ganglia-thalamocortical circuits: parallel substrates for motor, oculomotor, “prefrontal” and “limbic” functions. Prog Brain Res 1990; 85:119–146Crossref, Medline, Google Scholar
13. Alexander GE, DeLong MR, Strick PL: Parallel organization of functionally segregated circuits linking basal ganglia and cortex. Annu Rev Neurosci 1986; 9:357–381Crossref, Medline, Google Scholar
14. Penney JB Jr, Young AB: Speculations on the functional anatomy of basal ganglia disorders. Annu Rev Neurosci 1983; 6:73–94Crossref, Medline, Google Scholar
15. Percheron G, Filion M: Parallel processing in the basal ganglia: up to a point. Trends Neurosci 1991; 14:55–59Crossref, Medline, Google Scholar
16. Joel D, Weiner I: The connections of the dopaminergic system with the striatum in rats and primates: an analysis with respect to the functional and compartmental organization of the striatum. Neuroscience 2000; 96:451–474Crossref, Medline, Google Scholar
17. Parent A, Hazrati LN: Functional anatomy of the basal ganglia, I: the cortico-basal ganglia-thalamo-cortical loop. Brain Res Brain Res Rev 1995; 20:91–127Crossref, Medline, Google Scholar
18. Lehericy S, Ducros M, Van De Moortele PF, Francois C, Thivard L, Poupon C, Swindale N, Ugurbil K, Kim DS: Diffusion tensor fiber tracking shows distinct corticostriatal circuits in humans. Ann Neurol 2004; 55:522–529Crossref, Medline, Google Scholar
19. Wang L, Joshi SC, Miller MI, Csernansky JG: Statistical analysis of hippocampal asymmetry in schizophrenia. Neuroimage 2001; 14:531–545Crossref, Medline, Google Scholar
20. Sijbers J, Ceulemans T, Van Dyck D: Algorithm for the computation of 3D Fourier descriptors, in Proceedings of the 16th International Conference on Pattern Recognition, vol 2. Washington, DC, IEEE Computer Society, 2002, p 20790Google Scholar
21. Brechbuhler C, Gerig G, Kubler O: Parametrization of closed surfaces for 3-D shape-description. Comput Vis Image Underst 1995; 61:154–170Crossref, Google Scholar
22. Szekely G, Kelemen A, Brechbuhler C, Gerig G: Segmentation of 2-D and 3-D objects from MRI volume data using constrained elastic deformations of flexible Fourier contour and surface models. Med Image Anal 1996; 1:19–34Crossref, Medline, Google Scholar
23. Chakos MH, Lieberman JA, Bilder RM, Borenstein M, Lerner G, Bogerts B, Wu H, Kinon B, Ashtari M: Increase in caudate nuclei volumes of first-episode schizophrenic patients taking antipsychotic drugs. Am J Psychiatry 1994; 151:1430–1436Link, Google Scholar
24. Rosenberg DR, MacMaster FP, Keshavan MS, Fitzgerald KD, Stewart CM, Moore GJ: Decrease in caudate glutamatergic concentrations in pediatric obsessive-compulsive disorder patients taking paroxetine. J Am Acad Child Adolesc Psychiatry 2000; 39:1096–1103Crossref, Medline, Google Scholar
25. Yatham LN, Liddle PF, Shiah I-S, Lam RW, Ngan E, Scarrow G, Imperial M, Stoessl J, Sossi V, Ruth TJ: PET study of [18F]6-fluoro-L-dopa uptake in neuroleptic- and mood-stabilizer-naive first-episode nonpsychotic mania: effects of treatment with divalproex sodium. Am J Psychiatry 2002; 159:768–774Link, Google Scholar
26. Dager SR, Friedman SD, Parow A, Demopulos C, Stoll AL, Lyoo IK, Dunner DL, Renshaw PF: Brain metabolic alterations in medication-free patients with bipolar disorder. Arch Gen Psychiatry 2004; 61:450–458Crossref, Medline, Google Scholar
27. Carpenter MB: Core Text of Neuroanatomy. Baltimore, Williams & Wilkins, 1991Google Scholar
28. Duvernoy HM: The Human Brain: Surface, Three-Dimensional Sectional Anatomy and MRI. New York, Springer-Verlag Wien, 1991Google Scholar
29. Netter FH: Atlas of Human Anatomy. Toms River, NJ, Ciba-Geigy Corp, 1989Google Scholar
30. Martin JH: Neuroanatomy: Text and Atlas. New York, Elsevier, 1989Google Scholar
31. Lorensen WE, Cline HE: Marching cubes: a high resolution 3D surface construction algorithm. Computer Graphics 1987; 21:163–169Crossref, Google Scholar
32. Schindler MK, Wang L, Selemon LD, Goldman-Rakic PS, Rakic P, Csernansky JG: Abnormalities of thalamic volume and shape detected in fetally irradiated rhesus monkeys with high dimensional brain mapping. Biol Psychiatry 2002; 51:827–837Crossref, Medline, Google Scholar
33. Sowell ER, Thompson PM, Peterson BS, Mattson SN, Welcome SE, Henkenius AL, Riley EP, Jernigan TL, Toga AW: Mapping cortical gray matter asymmetry patterns in adolescents with heavy prenatal alcohol exposure. Neuroimage 2002; 17:1807–1819Crossref, Medline, Google Scholar
34. Strakowski SM, Adler CM, DelBello MP: Volumetric MRI studies of mood disorders: do they distinguish unipolar and bipolar disorder? Bipolar Disord 2002; 4:80–88Crossref, Medline, Google Scholar
35. Goodwin FK, Jamison KR: Manic-Depressive Illness. New York, Oxford University Press, 1990Google Scholar
36. McDonald C, Zanelli J, Rabe-Hesketh S, Ellison-Wright I, Sham P, Kalidindi S, Murray RM, Kennedy N: Meta-analysis of magnetic resonance imaging brain morphometry studies in bipolar disorder. Biol Psychiatry 2004; 56:411–417Crossref, Medline, Google Scholar
37. Manji HK, Moore GJ, Chen G: Lithium up-regulates the cytoprotective protein Bcl-2 in the CNS in vivo: a role for neurotrophic and neuroprotective effects in manic depressive illness. J Clin Psychiatry 2000; 61(suppl 9):82-96Google Scholar
38. Haber SN, Kunishio K, Mizobuchi M, Lynd-Balta E: The orbital and medial prefrontal circuit through the primate basal ganglia. J Neurosci 1995; 15(7, part 1):4851-4867Google Scholar
39. Middleton FA, Strick PL: Basal ganglia and cerebellar loops: motor and cognitive circuits. Brain Res Brain Res Rev 2000; 31:236–250Crossref, Medline, Google Scholar
40. Bearden CE, Hoffman KM, Cannon TD: The neuropsychology and neuroanatomy of bipolar affective disorder: a critical review. Bipolar Disord 2001; 3:106–150Crossref, Medline, Google Scholar
41. Levitt JJ, Westin CF, Nestor PG, Estepar RS, Dickey CC, Voglmaier MM, Seidman LJ, Kikinis R, Jolesz FA, McCarley RW, Shenton ME: Shape of caudate nucleus and its cognitive correlates in neuroleptic-naive schizotypal personality disorder. Biol Psychiatry 2004; 55:177–184Crossref, Medline, Google Scholar
42. Strakowski SM, DelBello MP, Adler C, Cecil DM, Sax KW: Neuroimaging in bipolar disorder. Bipolar Disord 2000; 2(3, part 1):148-164Google Scholar