Frontosubcortical Neuroanatomy and the Continuous Performance Test in Mania
Abstract
OBJECTIVE: The authors examined whether Continuous Performance Test scores correlate with frontosubcortical volumes in bipolar disorder. METHOD: The subjects were 17 patients hospitalized for an acute manic episode and 12 group-matched comparison subjects. They underwent magnetic resonance imaging and completed the Continuous Performance Test. RESULTS: The patients performed worse on the Continuous Performance Test and had smaller prefrontal cortical volumes than the comparison subjects. Within the patient group, Continuous Performance Test performance significantly correlated with prefrontal and hippocampal volumes. CONCLUSIONS: These results suggest that certain neuroanatomic structures may be associated with attentional dysfunction in mania.
In their recent review, Soares and Mann (1) suggested that abnormalities in frontosubcortical brain pathways underlie the pathophysiology of affective illness. Morphometric abnormalities have been identified in these regions in bipolar disorder (1, 2). Structures in these pathways may also underlie attentional performance (3), as impairments on the Continuous Performance Test, which appears to activate the prefrontal cortex (4), have been reported in bipolar disorder (5). Whether these structural and attentional abnormalities are related is unknown. We therefore studied brain morphometry and Continuous Performance Test scores for 17 patients with bipolar disorder and 12 healthy comparison subjects.
METHOD
We recruited 17 hospitalized patients, 18–45 years old, who met the DSM-III-R criteria for bipolar disorder, manic or mixed. Patients were excluded for major medical or neurologic illness, history of head trauma, or mental retardation. DSM-III-R diagnoses were established by psychiatrists using the Structured Clinical Interview for DSM-III-R—Patient Version (SCID-P) (6) with established interrater reliability (kappa=0.94). The Young Mania Rating Scale (7) was administered by trained research assistants with good interrater reliability (intraclass correlation coefficient=0.71). Five patients were medication free at the time of testing. The remaining 12 patients were taking lithium, valproate, carbamazepine, or a combination of them. Five were also receiving an antipsychotic medication.
From the same communities we recruited 12 healthy comparison subjects who were also aged 18–45 years. Subjects were excluded for a history of medical, neurological, or psychiatric disorder or substance dependence (as determined by the SCID-P) or a family history of psychiatric illness in first-degree relatives. All subjects provided written informed consent after the procedures had been fully explained.
The computerized version of the degraded-stimulus Continuous Performance Test (8) involves consecutive presentation of degraded digits (0–9) for 35 msec. Of the 480 digits presented, 120 (25%) are the target stimulus (“0”) requiring a button press. Omission and commission errors determine the nonparametric measure of sensitivity (A′) (3). Test conditions were controlled for all subjects.
For the patients, magnetic resonance imaging (MRI) scans were obtained 11 days (SD=10) after admission and 5 days (SD=9) from the symptom measurements and Continuous Performance Test administration. Brain images were acquired by using a three-dimensional radio-frequency-spoiled Fourier acquired steady state (FAST) sequence (TR=22 msec, TE=7 msec, flip-angle=25°, field of view=24 cm, 256×256 matrix) on a Picker 1.5-T MRI scanner (Picker International, Cleveland). The image data were then transferred to a Macintosh workstation and reformatted to the same coronal plane orthogonal to both the midsagittal and anterior-posterior commissure planes.
Morphometric measurements were obtained by using BrainImage version 2.3.3 software. We limited our analysis to four structures—prefrontal cortex, caudate, thalamus, and hippocampus—since abnormalities in these regions have been implicated in the pathophysiology of affective illness (1) and attentional dysfunction (3, 9). Cerebral cortical volume was also measured.
The measurements were performed by trained, blinded raters with established inter- and intrarater reliability for all structures (table 1). The prefrontal cortex was defined as anterior to the coronal plane situated at the most anterior point of the genu of the corpus callosum (10). The caudate was manually traced in every slice in which it was visible, as described previously (2). The hippocampus was measured after the anterior region was separated from surrounding structures (e.g., amygdala) by identifying the alveus (11), with the anterior boundary being the most anterior coronal slice in which the alveus was visualized. The posterior boundary coincided with the coronal slice where the inferior and superior colliculi were jointly visualized. Thalamic measurements were made for the entire structure by tracing the thalamic nuclei in each slice in which the nuclei were visible (2).
Continuous Performance Test sensitivity and brain structural volumes were evaluated by using a nonparametric analysis of covariance (ANCOVA) with PROC GLM software (SAS Institute, Cary, N.C.) applied to ranked scores; the analysis covaried for whole-brain volume, age, sex, race, and substance abuse history. In the analysis of sensitivity, education, age, sex, race, and substance abuse were included as covariates. Spearman rank-order correlations were calculated separately for each group so that we could examine associations between brain structures and Continuous Performance Test performance. For structural volumes that significantly differed between groups, the significance level for correlations with Continuous Performance Test performance was a priori established at p=0.05. The remaining three correlations were adjusted for multiple comparisons (i.e., p=0.017). Wilcoxon rank sums tests were used to examine differences in Continuous Performance Test performance and in brain structural volumes between the medicated (N=12) and medication-free (N=5) patients.
RESULTS
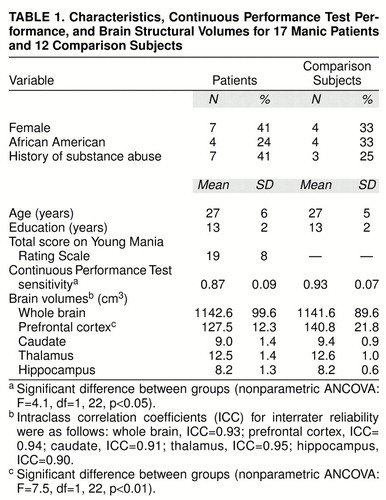
As expected, the patients performed more poorly on the Continuous Performance Test than the comparison subjects (table 1). Whole-brain volume did not differ between groups. Comparisons of brain regions with controls for covariates revealed significantly smaller prefrontal cortical volumes in the patients. No other significant differences were found.
In the 17 patients, Continuous Performance Test performance significantly correlated with prefrontal volume (rs=0.59, p=0.01) and hippocampal volume (rs=0.69, p=0.002) but not with volume for the caudate (rs=0.55, p=0.02) or thalamus (rs=0.43, p=0.09) (adjusted significance level required, p=0.017). None of the correlations for the comparison subjects was significant. To control for potential correlations among brain structures influencing associations with performance on the Continuous Performance Test, we performed a multivariate regression with the four brain structures predicting Continuous Performance Test sensitivity. This analysis yielded a significant model (F=5.4, df=4, 12, p=0.01) and R2=0.64. Most of the total variance was due to hippocampal volume (partial R2=0.28, df=1, p=0.05) and prefrontal cortical volume (partial R2=0.23, df=1, p=0.08). However, given the relatively small number of subjects, these results should be interpreted cautiously. Finally, there were no significant differences in the dependent variables between the medicated and unmedicated patients.
DISCUSSION
These results suggest that abnormalities in the frontosubcortical neuroanatomic circuit (1), particularly in the prefrontal cortex and hippocampus, are associated with impaired attentional functioning in patients with mania. Perhaps there are pathophysiologic abnormalities in this neuroanatomic circuit that underlie both the affective symptoms and associated attentional dysfunction in bipolar disorder.
This study has several limitations. First, medication effects may have influenced the results. Studying a larger group of never-medicated patients would clarify this issue. Second, the study group was relatively small. Replicating this finding in a larger groups of subjects is necessary. Third, the symptom and attentional measures were not obtained on the same day as the MRI scan. Fourth, while the measurement of the prefrontal cortex is acceptable, it does not anatomically correspond directly to this region. Finally, brain structures or processes not examined may be responsible for the associations found.
Received Jan. 5, 1998; revisions received May 21 and July 9, 1998; accepted July 15, 1998. From the Psychotic Disorders Research and Biological Psychiatry Programs, Department of Psychiatry, University of Cincinnati College of Medicine. Address reprint requests to Dr. Sax, Psychotic Disorders Research Program, Department of Psychiatry, University of Cincinnati, 231 Bethesda Ave. (ML 559), Cincinnati, OH 45267-0559; [email protected] (e-mail). Funded in part by the Scottish Rite Schizophrenia Foundation, N.M.J.; the Ohio Department of Mental Health; and NIMH grant MH-54317 (Dr. Strakowski).
 |
1. Soares JC, Mann JJ: The anatomy of mood disorders—review of structural neuroimaging studies. Biol Psychiatry 1997; 41:86–106Crossref, Medline, Google Scholar
2. Strakowski SM, Wilson DR, Tohen M, Woods BT, Douglass AW, Stoll AL: Structural brain abnormalities in mania at first hospitalization. Biol Psychiatry 1993; 33:602–609Crossref, Medline, Google Scholar
3. Posner MI, Petersen SE: The attention system of the human brain. Annu Rev Neurosci 1990; 13:25–42Crossref, Medline, Google Scholar
4. Carter CS, Braver TS, Barch DM, Botvinick MM, Noll D, Cohen JD: Anterior cingulate cortex, error detection, and the online monitoring of performance. Science 1998; 280:747–749Crossref, Medline, Google Scholar
5. Sax KW, Strakowski SM, McElroy SL, Keck PE Jr, West SA: Attention and formal thought disorder in mixed and pure mania. Biol Psychiatry 1995; 37:420–423Crossref, Medline, Google Scholar
6. Spitzer RL, Williams JBW, Gibbon M, First MB: Structured Clinical Interview for DSM-III-R—Patient Version (SCID-P). New York, New York State Psychiatric Institute, Biometrics Research, 1990Google Scholar
7. Young RC, Biggs JT, Ziegler VE, Meyer DA: A rating scale for mania: reliability, validity and sensitivity. Br J Psychiatry 1978; 133:429–435Crossref, Medline, Google Scholar
8. Nuechterlein KH, Dawson ME, Ventura J, Miklowitz D, Konishi G: Information-processing anomalies in the early course of schizophrenia and bipolar disorder. Schizophr Res 1991; 5:195–196Crossref, Medline, Google Scholar
9. Rezai K, Andreasen NC, Alliger R, Cohen G, Swayze V II, O"Leary DS: The neuropsychology of the prefrontal cortex. Arch Neurol 1993; 50:636–642Crossref, Medline, Google Scholar
10. Frazier JA, Giedd JN, Hamburger SD, Albus KE, Kaysen D, Vaituzis AC, Rajapakse JC, Lenane MC, McKenna K, Jacobsen LK, Gordon CT, Breier A, Rapoport JL: Brain anatomic magnetic resonance imaging in childhood-onset schizophrenia. Arch Gen Psychiatry 1996; 53:617–624Crossref, Medline, Google Scholar
11. Altshuler LL, Bartzokis G, Grieder T, Curran J, Mintz J: Specific limbic differences in MRI of schizophrenic and bipolar subjects (abstract). Biol Psychiatry 1997; 41(7S):11SGoogle Scholar