The Internet-Based MGS2 Control Sample: Self Report of Mental Illness
Abstract
Objective
The Molecular Genetics of Schizophrenia (MGS2) project recruited an adult control sample of non-Hispanic European-ancestry (N=3,364) and African American (N=1,301) subjects.
Method
Subjects gave consent to deposit phenotypic data and blood samples into a repository for general research use, with full anonymization of the sample. The authors compared the control sample with population census data for demographic data and with previous population surveys for anthropometrics and prevalences of psychiatric disorders as estimated by an Internet-administered questionnaire.
Results
The full MGS2 control sample includes 4,665 subjects (European-ancestry: N=3,364; African American: N=1,301), of whom 3,626 were included in the MGS2 genome-wide association study (GWAS). The sample is generally demographically representative of the U.S. population, except for being older and more female, educated, and affluent, although all strata are represented. Self-reported ancestry was consistent with genotypic and census data. Lifetime prevalences for depressive, anxiety, and substance use diagnoses were higher than in previous population-based surveys, probably due to use of an abbreviated self-report instrument. However, patterns such as sex ratios, comorbidity, and demographic associations were consistent with previous reports. DNA quality for the Internet collected/evaluated control sample was comparable to that of the face-to-face case sample.
Conclusions
The Internet-based methods facilitated the rapid collection of large and anonymized non-Hispanic European-ancestry and African American control samples that have been validated as being generally representative for many aspects of demography, ancestry, and morbidity. Utilization of clinical screening data shared with the scientific community may permit investigators to select appropriate controls for some studies.
The Molecular Genetics of Schizophrenia (MGS2) project recruited an adult control sample for genetic research. We now provide the first complete description of the final sample, including clinical and demographic features in relation to the U.S. population, ancestry, and quality control of genotypic data. We have previously reported on some of these issues for parts of the sample (1, 2).
During 2004–2007, a survey and marketing research company, Knowledge Networks (Menlo Park, Calif.), Internet recruited self-identified non-Hispanic European-ancestry and African American participants consenting to deposition of anonymized clinical data, a blood sample, and future genetic data in the National Institute of Mental Health (NIMH) repository. We note that the Wellcome Trust Case Control Consortium (3) has successfully used a single control sample for studies of diverse medical and psychiatric disorders and that analyses gave similar results using population-based and opportunistically ascertained subsets of the control subjects (see reference 4).
For psychiatric genetic studies, the recruitment and assessment of control samples present several interesting challenges, including representativeness (in relation to the general population and to the case sample), cost-effectiveness, sample size, clinical screening approach (none, brief, full; Internet, telephone, in-person; questionnaire, interview), and selection stringency (no psychiatric diagnosis, specific exclusions, unselected) (see references 5–7). We were particularly interested in providing a way to select control subjects for specific studies. For genetic studies of common disorders (including depression, anxiety, and substance use), validity is enhanced when most individuals with the disorder under study can be excluded from the control group (4, 8), especially for prevalence ≤20% and with only a modest benefit for prevalence ≤5%. For a rarer disorder like schizophrenia, power is essentially unchanged if 1%–2% of control subjects have or develop the disorder (4). We therefore designed an online assessment to collect information relevant to subject selection. Since the selection of appropriate controls is in large part dependent on the source population of the cases of a particular association study, we cannot provide a universal algorithm, but do note that the idea is to draw from the same source population and independently of exposure status (marker genotype) (9, 10).
Method
Ascertainment
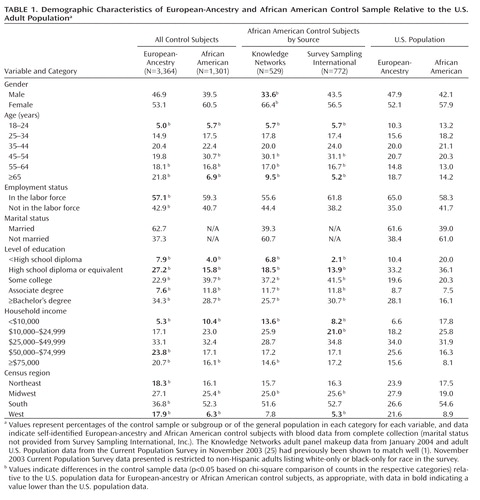
Knowledge Networks enrolled a total of 4,665 adults (18 years or older), 3,364 individuals of non-Hispanic European ancestry and 1,301 individuals of African American ethnicity. All Europeanancestry and 529 African American control subjects were recruited from Knowledge Networks' nationwide panel of survey participants, which is recruited continuously by random digit dialing (11, 12) and resembles the population distribution in age, race, Hispanicity, region, employment, marital status, and other demographic features (Table 1 [also see Table S4 in reference 1]). An additional 772 African American controls were recruited by subcontract to Survey Sampling International (Shelton, Conn.), using Internet recruitment (banner ads on websites). Table 1 (ST1) in the data supplement accompanying the online version of this article lists the completion rate for the various stages of the study, from invitation to procedure completion. Of the targeted panel members, 15.5% (African American) to 21.7% (European-ancestry) of individuals consented and completed the online questionnaire and gave blood—for comparison, a population-based study requiring blood that used significantly more enrollment effort (two letters and three telephone contacts) achieved a 31% rate (13). Survey Sampling International completed 2.1% of targeted controls, but this was needed to achieve an adequate African American sample size.
 |
Informed Consent
Institutional review board approval was obtained at NorthShore University HealthSystem. Participants consented online to use of their DNA and phenotypic information for the study of any illness or trait and then signed an identical hard-copy consent at the time of venipuncture. While it is possible to identify a subject in an anonymized data set with extensive genotypic data, such as this data set, if one also had access to a large number of genotypes and to subjects' identities in a second data set (14), there is no known such anonymity violation to date for any genetic study. For genotypic data, NIMH restricts access to qualified investigators and institutions who agree to the National Institutes of Health Genome-Wide Association Studies (GWAS) data sharing policies (grants.nih.gov/grants/gwas/), which prohibit any attempt to identify individual research subjects or even their presence in a sample.
Assessment
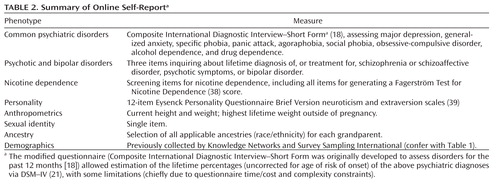
All participants completed an online self-report clinical assessment (nimhgenetics.org, Available Data → Controls → Control Questionnaire), with most items screening for common adult psychiatric disorders. The validated assessment tool in large-scale epidemiological studies of these disorders of widest use is the Composite International Diagnostic Interview (CIDI) (15, 16). The CIDI was developed for direct interviews, but an abbreviated version, the CIDI–Short Form (CIDI–SF), has been used for self-report (sometimes modified for lifetime assessments [e.g., see reference 17]) and telephone interviews and is accurate compared with a full CIDI (18, 19). We therefore asked control subjects to complete the CIDI–SF, modified to screen for lifetime diagnoses, and also included other questionnaire components assessing various traits and disorders summarized in Table 2.
 |
Phlebotomy
Individuals who completed the questionnaire were then contacted by Examination Management Services, Inc. (Irving, Tex.), to arrange blood specimen collection. The phlebotomist confirmed gender and race (European-ancestry or African American) and shipped the blood to the Rutgers University Cell and DNA Repository (Piscataway, N.J.) for DNA extraction and transformation to lymphoblastic cell lines (99.5% success rate).
Diagnosis
We scored the dichotomous presence/absence of individual disorders according to the CIDI–SF (18) scoring memo (20). Most participants were past the typical ages of onset for the assessed psychiatric disorders (mean age: European-ancestry=50.0 years [SD=16.4]; African American=45.4 years [SD=13.1]) via DSM–IV (21). Dependence is assessed separately for alcohol, but the drug dependence section asks which substances have been used and then queries dependence criteria for "the year when you used one or more of these drugs on your own the most" rather than for each substance individually. CIDI–SF ignores several exclusion criteria (e.g., whether a major depressive episode or anxiety disorder might have been due to a general medical condition or substance use). Omission of full exclusion criteria evaluation should lead to an increased number of these diagnoses (but see the discussion below of CIDI–SF dichotomous versus probabilistic methods and the disorder specific criteria discussions).
Ancestry
The questionnaire allowed controls to select ≥1 ancestry (race/ethnicity) for each grandparent, from 15 categories (i.e., Figure 1 x-axis labels, plus "other" with a text entry, or "not sure") used in the NIMH Genetics Initiative's Diagnostic Interview for Genetic Studies (22). The "proportion" of each ancestry was not queried. Most "other" entries were the name of a country that was part of a category that had already been selected (e.g., "France" when the category "West Europe" had already been reported). Therefore, we have not translated the "other" entries (<5% of the total) into the 15 categories for the present analysis.
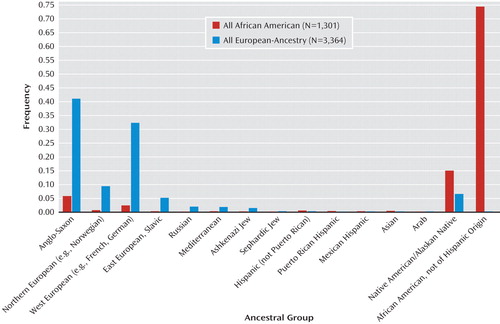
aData show the results of the tabulation of the frequency with which self-identified European-ancestry and African American control subjects endorsed biological grandparents, with the ancestral background indicated on the x-axis (one particular grandparent may have more than one ancestry endorsed).
Quality Control of Genotypic Data
Initially, we genotyped 14 schizophrenia candidate genes in 2,126 European-ancestry control and 1,952 European-ancestry case individuals (1). Extensive sample quality control (evaluating genotyping call rates, sex typing discrepancies, cryptic duplicates or relatives, and outliers in an analysis of ancestry-informative markers) left 2,002 (94%) control and 1,870 (96%) case samples remaining for analysis (i.e., very similar proportions). Control samples had more unresolved sex-typing discrepancies (23 versus two; χ2=14.45, df=1, p=0.00014), which required excluding these controls because the anonymization procedure prevented further investigation. Conversely, more case samples were excluded because they were outliers to the main European-ancestry and African American distributions in analyses of ancestry-informative markers (63 versus 35; χ2=10.18, df=1, p=0.0014), perhaps because controls gave more accurate self-reports and were asked for more detailed information (i.e., ancestry of each grandparent rather than each parent).
Next, for a schizophrenia GWAS (2), we genotyped 3,827 (European-ancestry: N=2,817; African American: N=1,010) of the 4,665 collected control samples and 4,196 (European-ancestry: N=2,838 ; African American: N=1,358) case samples with the Affymetrix 6.0 array; 3,626 (95%) control and 3,967 (95%) case samples passed stringent quality control (see Table 2 [ST2] in the data supplement). Thus, the control and case collections were similar in the quality of DNA and the consistency of genotypes with available phenotypic information.
Sharing of Biomaterials and Data
These materials are available to qualified scientists applying to NIMH, and overlapping subsets of the MGS2 control sample have been genotyped by multiple platforms: Affymetrix 6.0 (2), Affymetrix 500K (23), and Illumina HumanHap550 (24). Genotypes and phenotypic data for controls used in the MGS2 GWAS are available by application to dbGaP (database of Genotypes and Phenotypes [dbgap.ncbi.nlm.nih.gov], Study Accessions: phs000021.v2.p1 and phs000167.v1.p1), with 177 research projects already (December 7, 2009) granted access. Multiple investigators have also accessed DNA and/or phenotypic data through the NIMH repository, beginning during the recruitment period when these materials were made available in batches twice yearly.
Results
Questionnaire Completion
The questionnaire includes 69 mandatory or screening items, 45 disease-related and 24 for personality traits. We defined several sets of response-rate outliers for these items: 0.5% answered "yes" to ≤50 items, 0.5% did not answer ≤5 items, and 0.4% had software failures (≤1 item unasked). Users of this control sample may choose to remove these rare questionnaire completion outliers, as we did for MGS2; the current analyses utilize the full control sample.
Demographic Comparability
Table 1 compares demographic data for the control samples (European-ancestry, African American–Knowledge Networks, and African American–Survey Sampling International) with the November 2003 U.S. Current Population Survey (25) for non-Hispanic adults reporting a single race (white or black). Differences between the control samples and the Current Population Survey include the following: more women in the African American–Knowledge Networks subsample; older mean age for subjects of European-ancestry (mean age for control samples=50.0 years [SD=16.4] versus 47.5 years [SD=17.1] for Current Population Survey, t test: p<0.0001); fewer employed European-ancestry subjects, perhaps reflecting older age (mean age for European-ancestry employed subjects was 43.8 years [SD=12.9] versus 58.1 years [SD=17.1] for nonworkers, t test: p<0.0001); European-ancestry and particularly African American control subjects were more educated; more European-ancestry subjects were in the highest income bracket, and more African American subjects (especially African American–Survey Sampling International) were in several upper brackets; more European-ancestry subjects were from the South and fewer from the Northeast and West, while more African American subjects were from the Midwest.
Ancestry
Numerical data for ≤2 grandparents were reported by 87% of subjects of European ancestry and 96% of African American subjects, with "not sure" for most of the remaining grandparents. Counting each entry as an equal proportion for each grandparent, ancestry was distributed similarly in subjects with data for four grandparents (69% of European-ancestry and 80% of African American subjects) versus those with any missing data (see Figures SF1 and SF2 in the data supplement). Data for all subjects (ignoring missing data) are shown in Figure 1. For European-ancestry subjects, 83% of ancestry was reported as Anglo Saxon (i.e., British Isles), Northern European (e.g., Norwegian), or West European (e.g., French, German), with the remaining entries distributed across other European as well as Native American ancestries (Figure 1). Our European-ancestry control sample and the U.S. Census show similar distributions of subcontinental European ancestries (see Figure SF3 in the data supplement).
For African American subjects, 75% of ancestry was reported as African American and 15% as Native American, and most of the rest as European (Figure 1). Genotypic data suggest that Native American ancestry was overreported for both African American and European-ancestry subjects (see SF3 in reference 2, which shows that few subjects had the elevated "Asian" ancestry scores that are observed for Native Americans). Reasons for overreporting of Native American ancestry have been discussed previously (26). Among African American subjects, 42% reported that all four grandparents were only African American. The proportion of European-ancestry admixture in the African American sample is captured more accurately by genotypic data, and our sample (see SF3 in reference 2) looks similar to other African American samples (27–29).
Most European-ancestry subjects (73%) reported multiple ancestries and/or had some missing data, but some reported four grandparents of the same ancestry (e.g., 15% with all Anglo Saxon and 7% with all Western European ancestry). Ancestry-informative principle component scores computed from our GWAS data demonstrated the accuracy of these self-reported data, given that the scores produced distinct clusters of individuals with single ancestries (see SF6 in reference 2), with two components predicting North-South and East-West geographical origins respectively and another component predicting Ashkenazi Jewish ancestry. These scores were used in our GWAS analyses to exclude outliers and to correct association tests for case-control ancestry differences (2).
Diagnosis
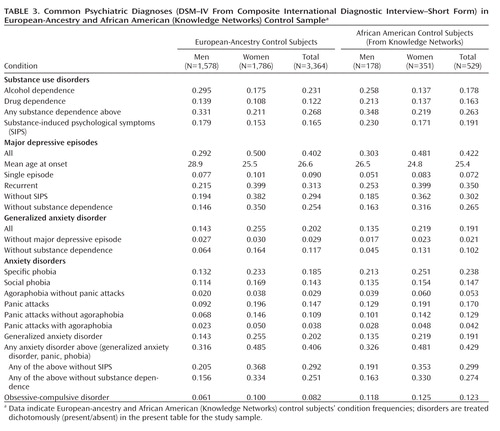
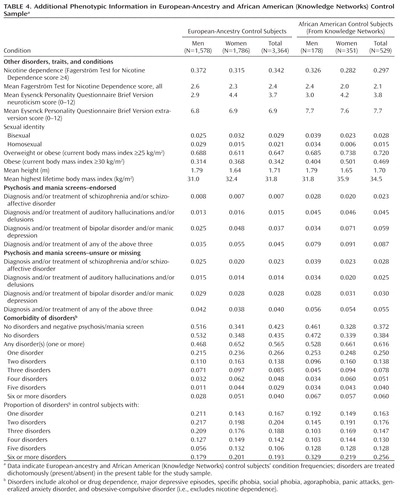
Table 3 shows the lifetime prevalence of common DSM–IV diagnoses (21) by CIDI–SF scoring criteria for the population-based portion of the control sample (European-ancestry, African American–Knowledge Networks); Table 4 provides additional data. The African American–Survey Sampling International subsample (Internet banner ad recruitment) has higher lifetime prevalence for common diagnoses, more comorbidity, higher neuroticism scores, and lower extraversion scores compared with the Knowledge Networks subsample that was recruited from a survey panel and is thus presented separately (see Tables ST3 and ST4 in the data supplement). Table 5 in the data supplement (ST5) includes comparison lifetime prevalence data from several epidemiological surveys (for all ancestries combined) for the Epidemiological Catchment Area Study (30), the National Comorbidity Survey (31), the National Comorbidity Survey Replication (32, 33), and the National Epidemiologic Survey on Alcohol and Related Conditions–Wave I (34, 35). Generally, male:female prevalence ratios were similar to those in previous studies for diagnoses compared with previous work (Table 3, Table 4 [also see ST5 in the data supplement]), and European-ancestry:African American–Knowledge Networks ratios were comparable within our study, but lifetime prevalences are higher in our sample (Table 3) than in the National Comorbidity Survey (31), which used CIDI. For example, at least one anxiety disorder diagnosis (other than obsessive-compulsive disorder [OCD]) was assigned in 40.6% of European-ancestry and 42.9% of African American–Knowledge Networks subjects versus 24.9% in the National Comorbidity Survey (31).
 |
 |
An alternative CIDI–SF scoring system assigns a probability of caseness to each subject (36), which can be summed across subjects to estimate prevalence. This estimate attempts to account for unmeasured exclusion criteria (such as organic causes) and overreporting (20). By this method (see ST5 in the data supplement), lifetime prevalence estimates are reduced for major depression and specific phobia but not for alcohol or drug dependence (perhaps because organic exclusions are not pertinent for these diagnoses). We restricted further diagnostic analyses to the dichotomous method.
Alcohol and Drug Dependence
Prevalences were higher for European-ancestry control subjects versus National Comorbidity Survey subjects for alcohol dependence (23.1% versus 14.1%) and drug dependence (12.2% versus 7.5%), with the expected excess in male subjects (Table 3). There was higher prevalence of alcohol dependence in European-ancestry versus African American control subjects (23.1% versus 17.8%; χ2=7.17, df=1, p=0.0074) but higher prevalence of drug dependence in African American–Knowledge Networks versus European-ancestry subjects (16.3% versus 12.2%; χ2=6.23, df=1, p=0.013). In the full (European-ancestry plus African American) Knowledge Networks sample, alcohol dependence showed the expected increase in men versus women (29.1% versus 16.8%, χ2=83, df=1, p<0.0001). Also, Knowledge Networks subjects diagnosed with drug dependence were younger (mean age: 43.7 years [SD=11.8] versus 50.3 years [SD=16.5], t test: p<0.0001) and had lower household income (<$50,000 for 66.9% versus 55.8%, χ2=21.4, df=1, p<0.0001) but were more likely to be employed (62.0% versus 56.1%, χ2=6, df=1, p=0.014).
Major Depression
Our European-ancestry control subjects have a much higher lifetime prevalence of major depressive episodes compared with the National Comorbidity Survey sample (40.2% versus 17.1%; reduced to 34.6% for control subjects using probability of caseness as shown in ST5 in the data supplement); among European-ancestry subjects with major depressive episodes, mean age of onset was 26.6 years [SD=13.8], and 78% reported recurrent major depressive episodes (Table 3). It is known that CIDI–SF overdiagnoses major depression (37). Without interview data, we cannot determine whether there might be a true overrepresentation of individuals with depression in the Knowledge Networks panel, although this appears unlikely given that the controls scored lower than population means for the neuroticism scale (see below), which is often elevated in depression. CIDI–SF major depressive episode criteria ignore distress/impairment (20), although queried; if we restrict major depressive episode diagnosis to those who sought help, received treatment, or reported a lot or some impairment, lifetime prevalence was reduced by 3.1% for European-ancestry control subjects and by 7.3% for African American–Knowledge Networks control subjects. CIDI–SF also fails to differentiate major depressive episodes from the effects of substance use. Lifetime prevalence of major depressive episodes was 25.4% in controls without alcohol or drug dependence and 29.4% in controls who did not endorse a CIDI–SF item about emotional or psychological problems (anhedonia, depression, and paranoia) due to substance use (alcohol and/or drugs). A similar pattern was observed in African American–Knowledge Networks subjects. In the full Knowledge Networks control sample, subjects with major depressive episodes were more likely to be female (men, 29.3%, versus women, 49.7%, χ2=165, df=1, p<0.0001), younger (mean age: 46.8 years [SD=14.5] versus 51.3 years [SD=17.0], t test: p<0.0001), unmarried (48.8% versus 34.8%, χ2=75, df=1, p<0.0001), and to have lower household income (<$50,000: 63.3% versus 53.0%, χ2=41, df=1, p<0.0001).
Anxiety Disorders
Self-reported prevalence of generalized anxiety disorder was higher in European-ancestry control subjects than in the National Comorbidity Survey (20.2% versus 5.1%), with prevalence of 11.7% when excluding those with alcohol and/or drug dependence or 2.9% when excluding subjects with any major depressive episodes (though CIDI–SF does not ask about relative timing of generalized anxiety disorder symptoms versus major depressive episodes). We found a similar pattern and estimates for African American–Knowledge Networks subjects. All anxiety disorders were more prevalent in women. Prevalence of CIDI–SF anxiety disorders was similar in European-ancestry versus African American–Knowledge Networks subjects except for specific phobia (18.5% European-ancestry versus 23.8% African American; χ2=7.82, df=1, p=0.0052), agoraphobia without panic attacks (2.9% European-ancestry versus 5.3% African American; χ2=7.27, df=1, p=0.0070), and OCD (8.2% European-ancestry versus 12.3% African American; χ2=9.03, df=1, p=0.0027).
Nicotine Dependence
Nicotine dependence, defined as a Fagerström Test for Nicotine Dependence score ≤4 (38), was more common in men in our full Knowledge Networks control sample (36.7% versus 30.9%, χ2=14.3, df=1, p=0.0002), in European-ancestry versus African American–Knowledge Networks subjects (34.2% versus 29.7%, χ2=3.91, df=1, p=0.048), and in those with less education (high school completion or less for 45.7% of subjects with a Fagerström Test for Nicotine Dependence score ≤4 versus 27.8% for the rest, χ2=124, df=1, p<0.0001).
Neuroticism and Extraversion
In European-ancestry control subjects, mean scores for neuroticism were 2.9 in male subjects and 4.4 in female subjects, compared with reported population means of 4.95 and 5.90, respectively (39); and for extraversion they were 6.8 for male subjects and 6.9 for female subjects (versus population means of 6.36 and 7.60, respectively). Mean scores were similar in African American–Knowledge Networks subjects except for higher extraversion scores (7.7 versus 6.9 in European-ancestry control subjects). Control subjects meeting CIDI–SF criteria for major depressive episode had higher mean neuroticism scores (5.8 versus 2.3 for European-ancestry control subjects, and 5.8 versus 2.4 for African American–Knowledge Networks control subjects) and lower mean extraversion scores (6.1 versus 7.4 for European-ancestry subjects, and 6.5 versus 8.5 for African American–Knowledge Networks subjects), compared with subjects with no self-reported major depressive episode. Similar patterns of elevated neuroticism and lowered extraversion scores were seen with various anxiety diagnoses (data not shown).
Comorbidity
As shown in Table 4, there was extensive comorbidity, with more than one CIDI–SF diagnosis for approximately 60% of individuals with at least one. Subjects with three or more diagnoses (20.2% of European-ancestry and 22.9% of African American–Knowledge Networks subjects) accounted for most of the total CIDI–SF diagnoses in their groups (62.9% and 66.1%, respectively). The most highly screened control group would consist of the 42.3% of European-ancestry and 37.2% of African American–Knowledge Networks subjects who received no CIDI–SF diagnoses and who denied all psychosis and bipolar screens.
Other Conditions and Traits
European-ancestry and African American subjects were similar in height, with male subjects approximately 15 cm taller than female subjects. Based on current body mass index (body mass index=kg/m2) and on highest nonpregnancy body mass index, the majority of subjects were either overweight (25 kg/m2 ≤ body mass index <30 kg/m2) or obese (body mass index ≤30 kg/m2), particularly African American women, similar to contemporaneous estimates from the National Health and Nutrition Examination Study (40). Similar to previous work (e.g., reference 41), in terms of sexual orientation (identity) for the European-ancestry sample, we find more homosexual men (2.9%) than homosexual women (1.5%), a higher ratio of bisexuals to homosexuals in women (2.13) than in men (0.86), and similar percentages for the African American–Knowledge Networks sample, although the male:female ratios are slightly larger.
Psychosis and Mania
The proportion of European-ancestry control subjects endorsing previous treatment or diagnosis of schizophrenia or schizoaffective disorder was identical to that in the National Comorbidity Survey sample (0.7%) (31), but more of our control sample reported treatment or diagnosis of bipolar disorder (3.7% versus 1.6%). African American–Knowledge Networks subjects reported more schizophrenia/schizoaffective (2.3% versus 0.7% for European-ancestry subjects; χ2=12.9, df=1, p=0.0003) and bipolar disorder histories (5.9% versus 3.7% for European-ancestry subjects; χ2=4.75, df=1, p=0.029). Without more direct data (i.e., interview data of probands, family informants, and/or review of medical records), we cannot determine the true rates of these disorders in these samples, but for MGS2 analyses we chose to exclude all individuals who endorsed or failed to answer any of the relevant items (i.e., the three psychosis/bipolar screening questions) (1, 2).
Discussion
The challenge was to find a cost-effective method to collect a control sample as large as our case sample. The Knowledge Networks panel provided an opportunity to recruit a representative national sample and a modest cost, and the online lifetime CIDI–SF provided an efficient method for screening of common psychiatric disorders. Our methods allowed us to recruit individuals throughout the United States and from all demographic strata, while obtaining written informed consent for use of biomaterials, clinical information, and genetic information for any medical research, and for anonymization of the sample to ensure access by future investigators.
The results demonstrate that the MGS2 control sample has the following characteristics:
1. It is representative of the U.S. population demographically except for a bias toward higher age, unemployment, education and income (but all strata are represented), and with an excess of European-ancestry subjects from the South and African American subjects from the Midwest. Older control subjects are past the typical ages of onset for the assayed psychiatric disorders, which might be an advantage for studies of those common disorders. Selection of control subjects based on educational level might be considered for studies of disorders manifesting with cognitive difficulties.
2. It is similar to the population in anthropometrics, ancestral background, and sexual orientation (identity). Self-reported ancestral data were consistent with genotypic analyses for both European-ancestry and African American subjects, except that Native American ancestry appears to have been overreported (2). Molecular quality control analyses demonstrated that DNA quality and consistency of self-reported and genotypic ancestry were similar for MGS2 control and case samples, despite the fact that control subjects were recruited and evaluated online with no direct contact besides the company staff (Knowledge Networks, Survey Sampling International, Examination Management Services, Inc.), and the case subjects had direct contact (recruitment, assessment, venipuncture) with the research group.
3. The diagnostic prevalences of common psychiatric disorders were substantially higher in these CIDI–SF self-reported control subjects compared with the CIDI interviewed National Comorbidity Survey sample. The excess prevalence was less pronounced when measured by probabilities of caseness or in those without alcohol or substance dependence. On the other hand, mean neuroticism scores (which are typically associated with depressive and anxiety disorders) are lower than previously reported population means, for both European-ancestry and African American subjects. Male:female ratios and patterns of comorbidity are similar to those reported previously (Table 3 [also see ST5 in the data supplement]).
4. The African American–Survey Sampling International subsample that was recruited by Internet ads had more CIDI–SF diagnoses and comorbidity, higher neuroticism scores, and lower extraversion scores compared with African American–Knowledge Networks panel subjects, consistent with previous work (42). We were unable to recruit the entire African American control sample through the more representative Knowledge Networks panel because our required African American:European-ancestry ratio (approximately 1:2) to match the case collection was much higher than that in the general population and because the volunteering rate was lower (see review for possible reasons in reference 43) among African American versus European-ancestry panel members (15.5% versus 21.7% [see ST1 in the data supplement]).
Several factors could have contributed to the high rate of common psychiatric diagnoses (also see the Discussion in the data supplement for disorder-specific information). CIDI–SF generally overdiagnoses these disorders (e.g., references 37, 44), perhaps due to a combination of failure to elicit key exclusion criteria (medical disorders, effects of medications and of substance use, bereavement, temporal overlap of syndromes, etc.) or inclusion criteria (impairment, distress, etc.) and subjects' tendency to endorse items based on experiences that a clinician interviewer would probe and then recognize as nonpathological. Volunteers for this type of study might also be more likely to have common psychiatric disorders, although the low neuroticism scores observed here suggest otherwise. Finally, the effects of using a "private" evaluation method (in this case an online interview) as opposed to a face-to-face interview might influence the probability of reporting psychopathology. The directionality of this effect can vary according to subject matter and context (see discussion in reference 45), but more anonymous methods may lead to more accurate responses to sensitive topics (46–50).
Users of this control sample have many options. For studies of common disorders, one might exclude individuals with the disorder under study (or a spectrum of disorders that coaggregate in families) based on dichotomous CIDI–SF criteria (at the standard thresholds or at lower or higher thresholds) or caseness probabilities. We have constructed factor scores (depression, anxiety, "internalizing disorders," nicotine dependence, substance dependence) that might more accurately measure the probability of a clinically significant disorder in each individual (manuscript in preparation), and others have shown that restricting GWAS analyses of such secondary traits to the controls in a case-control sample provides appropriate type I error rates as long as either the marker or the secondary trait is not associated with disease risk (for MGS2, schizophrenia) in the study base (51). It is also possible to select a "hypernormal" control group (although with an approximately 60% reduction in sample size) by selecting only individuals with no CIDI–SF diagnosis who also denied any psychotic or bipolar disorder screens. For example, for a sample of 534 MGS2 control subjects selected in this way (from a pool of 1,844 "hypernormal" MGS2 control subjects), neuroticism and extraversion scores did not differ from those of 90 age-matched individuals with no lifetime psychiatric disorder or family history of anxiety disorder by structured interview (52). To minimize selection bias, the control group should be chosen with the same restrictions as the cases in association studies (9, 10), which is one reason why we did not restrict the studied control sample to "hypernormal" control subjects in our MGS2 GWAS (2).
Clinical screening information on control samples is useful (e.g., references 4, 8). Efficient collection of a large, anonymized control sample, generally representative of the U.S. adult European-ancestry and African American population for many aspects of demography, ancestry, and morbidity, was enabled by the Internet-based recruitment and assessment design utilized for the MGS2 control sample. Information presented in this manuscript will further enable users of this control sample to follow standard guidelines for selection of controls in their own case-control studies.
1 : No significant association of 14 candidate genes with schizophrenia in a large European ancestry sample: implications for psychiatric genetics. Am J Psychiatry 2008; 165:497–506 Link, Google Scholar
2 : Common variants on chromosome 6p22.1 are associated with schizophrenia. Nature 2009; 460:753–757 Crossref, Medline, Google Scholar
3 : Genome-wide association study of 14,000 cases of seven common diseases and 3,000 shared controls. Nature 2007; 447:661–678 Crossref, Medline, Google Scholar
4 : Genome-wide association studies for complex traits: consensus, uncertainty and challenges. Nat Rev Genet 2008; 9:356–369 Crossref, Medline, Google Scholar
5 : Normal controls are expensive to find: methods to improve cost-effectiveness of the screening evaluation. Psychiatry Res 2005; 136:69–78 Crossref, Medline, Google Scholar
6 : Use of telephone screens improves efficiency of healthy subject recruitment. Psychiatry Res 2002; 113:295–301 Crossref, Medline, Google Scholar
7 : A comparison of results from an alcohol survey of a prerecruited Internet panel and the national epidemiologic survey on alcohol and related conditions. Alcohol Clin Exp Res 2008; 32:222–229 Crossref, Medline, Google Scholar
8 : Tests and estimates of allelic association in complex inheritance. Proc Natl Acad Sci U S A 1998; 95:11389–11393 Crossref, Medline, Google Scholar
9 Rothman KJGreenlan SLash TL: Case-control studies, in Modern Epidemiology. Philadelphia, Lippincott Williams and Wilkins, 2008, pp 111–127 Google Scholar
10 : Choosing controls in biologic psychiatry, in Psychiatric Epidemiology: Searching for the Causes of Mental Disorders. Edited by Susser ESchwartz SMorabia ABromet EJ. New York, Oxford University Press, 2006, pp 247–259 Google Scholar
11 : Web surveys: a review of issues and approaches. Public Opin Q 2000; 64:464–494 Crossref, Medline, Google Scholar
12 : Probability-based survey research on the Internet, in Proceedings of the Conference of the International Statistical Institute. Seoul, South Korea, 2001 Google Scholar
13 : The CoLaus study: a population-based study to investigate the epidemiology and genetic determinants of cardiovascular risk factors and metabolic syndrome. BMC Cardiovasc Disord 2008; 8:6 Crossref, Medline, Google Scholar
14 : Resolving individuals contributing trace amounts of DNA to highly complex mixtures using high-density SNP genotyping microarrays. PLoS Genet 2008; 4:e1000167 Crossref, Medline, Google Scholar
15 : Reliability and validity studies of the World Health Organization: Composite International Diagnostic Interview (CIDI): a critical review. J Psychiatr Res 1994; 28:57–84 Crossref, Medline, Google Scholar
16 : Methodological studies of the Composite International Diagnostic Interview (CIDI) in the US National Comorbidity Survey. Int J Methods Psychiatr Res 1998; 7:33–55 Crossref, Google Scholar
17 : Development, reliability and factor analysis of a self-administered questionnaire which originates from the World Health Organization's Composite International Diagnostic Interview–Short Form (CIDI–SF) for assessing mental disorders. Clin Pract Epidemol Ment Health 2008; 4:8 Crossref, Medline, Google Scholar
18 : The World Health Organization Composite International Diagnostic Interview Short-Form (CIDI–SF). Int J Methods Psychiatr Res 1998; 7:171–185 Crossref, Google Scholar
19 : Performance of the Composite International Diagnostic Interview Short Form for major depression in a community sample. Chronic Dis Can 2000; 21:68–72 Medline, Google Scholar
20 : Scoring the World Health Organization's Composite International Diagnostic Interview Short Form (CIDI–SF, version 1.0). Geneva, 2001. http://www.who.int/whosis/en/ Google Scholar
21 American Psychiatric Association: Diagnostic and Statistical Manual of Mental Disorders, 4th ed (DSM–IV). Washington, DC, American Psychiatric Publishing, 1994 Google Scholar
22 : Diagnostic Interview for Genetic Studies: rationale, unique features, and training: NIMH Genetics Initiative. Arch Gen Psychiatry 1994; 51:849–859 Crossref, Medline, Google Scholar
23 : Whole-genome association study of bipolar disorder. Mol Psychiatry 2008; 13:558–569 Crossref, Medline, Google Scholar
24 : Genome-wide association and meta-analysis of bipolar disorder in individuals of European ancestry. Proc Natl Acad Sci U S A 2009; 106:7501–7506 Crossref, Medline, Google Scholar
25 US Census Bureau: Current Population Survey. US Census Bureau, Washington, DC, 2003 Google Scholar
26 : Genetic admixture, self-reported ethnicity, self-estimated admixture, and skin pigmentation among Hispanics and Native Americans. Am J Phys Anthropol 2009; 138:375–383 Crossref, Medline, Google Scholar
27 : Estimating African American admixture proportions by use of population-specific alleles. Am J Hum Genet 1998; 63:1839–1851 Crossref, Medline, Google Scholar
28 : A high-density admixture map for disease gene discovery in African Americans. Am J Hum Genet 2004; 74:1001–1013 Crossref, Medline, Google Scholar
29 : Admixture mapping of 15,280 African Americans identifies obesity susceptibility loci on chromosomes 5 and X. PLoS Genet 2009; 5:e1000490 Crossref, Medline, Google Scholar
30 : Psychiatric Disorders in America: The Epidemiological Catchment Area Study. New York, Free Press, 1991 Google Scholar
31 : Lifetime and 12-month prevalence of DSM–III–R psychiatric disorders in the United States: results from the National Comorbidity Survey. Arch Gen Psychiatry 1994; 51:8–19 Crossref, Medline, Google Scholar
32 : Lifetime prevalence and age-of-onset distributions of DSM–IV disorders in the National Comorbidity Survey Replication. Arch Gen Psychiatry 2005; 62:593–602 Crossref, Medline, Google Scholar
33 : The US National Comorbidity Survey Replication (NCS–R): design and field procedures. Int J Methods Psychiatr Res 2004; 13:69–92 Crossref, Medline, Google Scholar
34 : Prevalence and co-occurrence of substance use disorders and independent mood and anxiety disorders: results from the National Epidemiologic Survey on Alcohol and Related Conditions. Arch Gen Psychiatry 2004; 61:807–816 Crossref, Medline, Google Scholar
35 : Lifetime comorbidity of DSM–IV mood and anxiety disorders and specific drug use disorders: results from the National Epidemiologic Survey on Alcohol and Related Conditions. J Clin Psychiatry 2006; 67:247–257 Crossref, Medline, Google Scholar
36 World Health Organization: World Health Organization Composite International Diagnostic Interview, Version 1.0. Geneva, World Health Organization, 1990 Google Scholar
37 : Major depressive episode among young adults: CIDI–SF versus SCAN consensus diagnoses. Psychol Med 2002; 32:1309–1314 Crossref, Medline, Google Scholar
38 : The Fagerström Test for Nicotine Dependence: a revision of the Fagerström Tolerance Questionnaire. Br J Addict 1991; 86:1119–1127 Crossref, Medline, Google Scholar
39 : A revised version of the Psychoticism Scale. Pers Individ Dif 1985; 6:21–29 Crossref, Google Scholar
40 : Will all Americans become overweight or obese? Estimating the progression and cost of the US obesity epidemic. Obesity (Silver Spring) 2008; 16:2323–2330 Crossref, Medline, Google Scholar
41 : Homosexuality, in The Social Organization of Sexuality: Sexual Practices in the United States. Chicago, University of Chicago Press, 1994, pp 283–321 Google Scholar
42 : The normalcy of self-proclaimed "normal volunteers". Am J Psychiatry 1989; 146:1052–1055 Link, Google Scholar
43 : Asking the right questions: views on genetic variation research among black and white research participants. J Gen Intern Med 2009; 24:299–304 Crossref, Medline, Google Scholar
44 : Re-estimating the prevalence of psychiatric disorders in a nationally representative sample of persons receiving care for HIV: results from the HIV Cost and Services Utilization Study. Int J Methods Psychiatr Res 2002; 11:75–82 Crossref, Medline, Google Scholar
45 : Sex differences in reporting sensitive behavior: a comparison of interview methods. Sex Roles 1991; 24:669–679 Crossref, Google Scholar
46 Analysis of Sexual Behaviour in France (ACSF): a comparison between two modes of investigation: telephone survey and face-to-face survey: ASCF principal investigators and their associates. AIDS 1992; 6:315–323 Medline, Google Scholar
47 : Reliability of the telephone interview in diagnosing anxiety disorders. Arch Gen Psychiatry 1988; 45:62–63 Crossref, Medline, Google Scholar
48 : Long-term reliability and validity of alcoholism diagnoses and symptoms in a large national telephone interview survey. Alcohol Clin Exp Res 1998; 22:553–558 Crossref, Medline, Google Scholar
49 : Telephone vs face-to-face interviewing in a community psychiatric survey. Am J Public Health 1993; 83:896–898 Crossref, Medline, Google Scholar
50 : The differential effects of face-to-face and computer interview modes. Am J Public Health 2002; 92:294–297 Crossref, Medline, Google Scholar
51 : Genome-wide association scans for secondary traits using case-control samples. Genet Epidemiol 2009; 33:717–728 Crossref, Medline, Google Scholar
52 : A comparison between screened NIMH and clinically interviewed control samples on neuroticism and extraversion. Mol Psychiatry 2008; 13:122–130 Crossref, Medline, Google Scholar