Further Evidence for Altered Cerebellar Neuronal Integrity in Schizophrenia
Abstract
OBJECTIVE: The authors’ goal was to investigate the distribution of metabolites and voxel composition in the pons and three cerebellar subregions and compare metabolite integral values and differences in voxel composition between patients with schizophrenia and healthy subjects. METHOD: Proton magnetic resonance spectroscopic imaging was used to study the cerebellum and pons of 14 patients with schizophrenia and 14 healthy comparison subjects. RESULTS: The voxel composition was not significantly different between the groups, but the patients with schizophrenia had significantly lower N-acetylaspartate levels in the cerebellar cortex and vermis. CONCLUSIONS: The lower integral value of N-acetylaspartate in the cerebellar cortex and the vermis of patients with schizophrenia supports the theory of a dysfunctional corticocerebellar-thalamic-cortical circuit in schizophrenia.
The literature on schizophrenia gives increasing evidence that the cerebellum is involved in complex mental activities and plays an important role within the cerebral network, revealing a functional disconnectivity in patients with schizophrenia in the corticocerebellar thalamic cortical circuit (1, 2). Proton magnetic resonance spectroscopic imaging (1H-MRSI) allows the detection of signals from N-acetylaspartate, creatine, and choline-containing compounds. Few 1H-MRSI studies have been conducted of the cerebellum in patients with schizophrenia (3–5).
Method
Fourteen patients with schizophrenia (12 men, two women; mean age=38.9 years, SD=7.3) and 14 healthy comparison subjects (eight men, six women; mean age=35.6 years, SD=3.7) were studied with 1H-MRSI. All subjects were right-handed (Edinburgh Inventory [6]). All patients satisfied DSM-III-R as well as ICD-10 criteria for schizophrenia and had been diagnosed for at least 6 months. Their mean Brief Psychiatric Rating Scale score was 32.3 (SD=4.8). All patients had been clinically stable for at least 3 months.
After complete description of the study to the subjects, written informed consent was obtained. The study was approved by the university ethics committee.
All 1H-MRSI studies were performed on a 1.5-T Siemens Vision (Siemens, Erlangen, Germany). A 1H-MRSI sequence with point-resolved spectroscopy volume selection was used with the volume centered on the cerebellum and pons. Measurement parameters included a field of view of 210×210 mm, 15-mm slice thickness, TE=135 msec, and TR=1.5 seconds. In addition, a three-dimensional magnetization-prepared rapid-gradient-echo data set was acquired.
Postprocessing of the 1H-MRSI data included CSF and imperfect excitation pulse correction of 1H-MRSI brain data to raise sensitivity and lower variance (7).
Voxels were selected from the pons, vermis, dentate nucleus, and cerebellar cortex. In addition to the metabolite signals, the voxel composition for each subregion was evaluated for differences in gray matter, white matter, and CSF content. Mean values per data set of spectra from each subregion are reported.
Multivariate analysis based on a general linear model was used for data analysis by the use of SPSS for Windows, release 10.1 (SPSS, Inc., Chicago). Two multivariate models were used, one for each of the subregions (a and b) and one for the three integral values of the metabolites (c). The dependent variables were 1) the integral values for each individual metabolite in the subregions, with group as the between-subject factor and age and gender as covariates, 2) the voxel composition in terms of gray matter, white matter, and CSF for the subregions, with group as the between-subject factor and age and gender as covariates, and 3) the integral values for the metabolites (N-acetylaspartate, creatine, choline), with age, gender, and voxel gray matter content as covariates and group as the between-subject factor tested for each subregion. The criterion for significance was set at p<0.05.
Results
The analysis of the metabolite signals with age and gender as covariates in the subregions showed significant differences for the choline signals between regions (F=4.70, df=3, 19, p<0.02). There was no significant group effect and no significant influence of gender or age. The choline signals differed most between the vermis (largest signal) and cerebellar cortex (smallest signal).
The comparison among regions of mean voxel composition in percent gray matter, white matter, and CSF showed no significant group effect and no significant influence of gender or age but showed significant differences among the evaluated subregions (F=8.37, df=3, 19, p=0.001, for gray matter; F=5.73, df=3, 19, p<0.006, for white matter; F=3.79, df=3, 19, p<0.03, for CSF).
The analysis of the metabolite signals revealed significant effects of group in the cerebellar cortex (F=3.41, df=3, 21, p<0.04) and the vermis (F=5.57, df=3, 21, p=0.006) and a significant influence of gray matter content in the cerebellar cortex (F=6.60, df=3, 21, p=0.003).
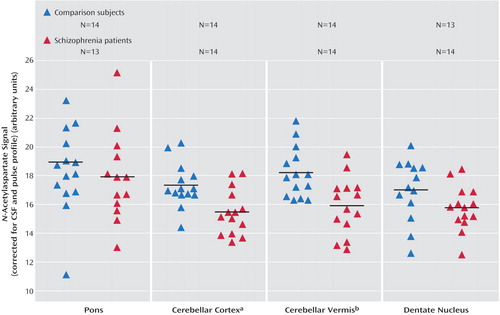
Univariate analysis revealed significantly lower values for patients of N-acetylaspartate in both regions (F=10.32, df=1, 23, p=0.004, for the cerebellar cortex; F=14.94, df=1, 23, p=0.001, for the vermis) (Figure 1) and choline in the vermis (F=4.88, df=1, 23, p<0.04). Statistics on the remaining metabolite signal values in these two regions were above the p=0.05 level (F=2.88, df=1, 23, p=0.10, for choline in the cerebellar cortex; F=3.53, df=1, 23, p=0.07, for creatine in the cerebellar cortex; F=4.03, df=1, 23, p=0.06, for creatine in the vermis). No significant age or gender influence was found. The influence of the gray matter content was significant only for the creatine signal in the cerebellar cortex (F=4.22, df=1, 23, p=0.05).
There was no significant correlation between the metabolites and duration of illness (rs=0.18>rs>–0.36, p>0.2, Spearman’s correlation).
Discussion
The cerebellar metabolite reductions between our patients with schizophrenia and healthy comparison subjects cannot be attributed to differences in tissue voxel heterogeneity between the two groups. The significantly lower N-acetylaspartate signals in patients with schizophrenia were restricted to the cerebellar cortex and the vermis.
Our data are in good agreement with the 1H-MRSI data of Deicken et al. (5), who also found reduced N-acetylaspartate in the vermis of patients with schizophrenia. A lower level of N-acetylaspartate is generally thought to indicate reduced neuronal viability, resulting either from structural or functional neuronal impairment.
Marcelis et al. (8) reported evidence for cerebellar, frontal, and thalamic gray matter deficits in psychotic patients. This is consistent with our own data (9) and supports the theory of a dysfunctional corticocerebellar-thalamic-cortical circuit, as proposed by Andreasen et al. (1).
Our patient group was not homogeneous regarding illness duration and medication. All patients were receiving medication, and possible medication effects cannot be excluded. The influence of the covariate gray matter on univariate N-acetylaspartate comparisons was not significant, but the influence of gray matter differences on the main effect was not totally eliminated.
Presented in part at the 9th annual meeting of the Society of Magnetic Resonance in Medicine, Glasgow, April 21–27, 2001. Received March 1, 2004; revisions received May 3, May 10, and May 26, 2004; accepted June 10, 2004. From NMR Research in Psychiatry, Central Institute of Mental Health, Mannheim, Germany. Address reprint requests and correspondence to Dr. Ende, NMR Research in Psychiatry, Central Institute of Mental Health, J5, 68159 Mannheim, Germany; [email protected] (e-mail). Supported by grant 47/2000 from the Central Institute of Mental Health. The authors thank Dr. Norbert Schuff for providing the spherical k-space sampling magnetic resonance spectroscopic imaging sequences, Drs. Andrew Maudsley and Brian Soher for providing the automated spectral fitting routine, and Iris Reinhard for help with statistical analysis.

Figure 1. Results for the CSF-Corrected N-Acetylaspartate Signal for Three Cerebellar Subregions and the Pons in Healthy Comparison Subjects and Patients With Schizophrenia
aSignificantly lower values for patients (F=10.32, df=1, 23, p=0.004).
bSignificantly lower values for patients (F=14.94, df=1, 23, p=0.001).
1. Andreasen NC, O’Leary DS, Cizadlo T, Arndt S, Rezai K, Boles Ponto LL, Watkins GL, Hichwa RD: Schizophrenia and cognitive dysmetria: a positron-emission tomography study of dysfunctional prefrontal-thalamic-cerebellar circuitry. Proc Natl Acad Sci USA 1996; 93:9985–9990Crossref, Medline, Google Scholar
2. Crespo-Facorro B, Paradiso S, Andreasen NC, O’Leary DS, Watkins GL, Boles Ponto LL, Hichwa RD: Recalling word lists reveals “cognitive dysmetria” in schizophrenia: a positron emission tomography study. Am J Psychiatry 1999; 156:386–392Abstract, Google Scholar
3. Eluri R, Paul C, Roemer R, Boyko O: Single-voxel proton magnetic resonance spectroscopy of the pons and cerebellum in patients with schizophrenia: a preliminary study. Psychiatry Res 1998; 84:17–26Crossref, Medline, Google Scholar
4. Tibbo P, Hanstock CC, Asghar S, Silverstone P, Allen PS: Proton magnetic resonance spectroscopy (1H-MRS) of the cerebellum in men with schizophrenia. J Psychiatry Neurosci 2000; 25:509–512Medline, Google Scholar
5. Deicken RF, Feiwell R, Schuff N, Soher B: Evidence for altered vermis neuronal integrity in schizophrenia. Psychiatry Res 2001; 107:125–134Crossref, Medline, Google Scholar
6. Oldfield RC: The assessment and analysis of handedness: the Edinburgh Inventory. Neuropsychologia 1971; 9:97–113Crossref, Medline, Google Scholar
7. Weber-Fahr W, Ende G, Braus DF, Bachert P, Soher BJ, Henn F, Büchel C: A fully automated method for tissue segmentation and CSF-correction of proton MRSI metabolites corroborates abnormal hippocampal NAA in schizophrenia. Neuroimage 2002; 16:49–60Crossref, Medline, Google Scholar
8. Marcelis M, Suckling J, Woodruff P, Hofman P, Bullmore E, van Os J: Searching for a structural endophenotype in psychosis using computational morphometry. Psychiatry Res 2003; 122:153–167Crossref, Medline, Google Scholar
9. Ende G, Braus DF, Walter S, Henn FA: Lower concentration of thalamic N–acetylaspartate in patients with schizophrenia: a replication study. Am J Psychiatry 2001; 158:1314–1316Link, Google Scholar


