Relation of Corpus Callosum and Hippocampal Size to Age in Nondemented Adults With Down’s Syndrome
Abstract
OBJECTIVE: Aging in Down’s syndrome is accompanied by amyloid and neurofibrillary pathology, the regional and laminar distribution of which resembles pathological changes seen in Alzheimer’s disease. Previous studies using magnetic resonance imaging (MRI) demonstrated age-related atrophy of medial temporal lobe structures in nondemented older subjects with Down’s syndrome, reflecting early allocortical pathology. Corpus callosum atrophy has been established as a marker of neocortical neuronal loss in Alzheimer’s disease. This study investigated whether atrophy of the corpus callosum and hippocampus occurs in nondemented subjects with Down’s syndrome and compared the degree of age-related atrophy between these structures. METHOD: Hippocampus and corpus callosum measures were obtained from volumetric T1-weighted MRI scans of 34 nondemented Down’s syndrome adults (mean age=41.6 years, 17 women) and 31 healthy comparison subjects (mean age=41.8 years, 14 women). RESULTS: Down’s syndrome subjects had smaller corpus callosum areas and hippocampal volumes relative to age-matched healthy comparison subjects, even after age and total intracranial volume were controlled. There was an age-related decrease of corpus callosum area (most prominent in posterior regions) and hippocampal volume in the Down’s syndrome group. The degree of the age effect was comparable between the total corpus callosum and hippocampus, and corpus callosum size was correlated with cognitive performance in the Down’s syndrome subjects. There was no correlation between age and corpus callosum or hippocampal size in the comparison group. CONCLUSIONS: Comparable decrease of corpus callosum and hippocampal size with age in nondemented subjects with Down’s syndrome suggests that neocortical neuronal alterations accompany allocortical changes in the predementia phase of Down’s syndrome.
With advancing age, an increasing proportion of older (>40 years) subjects with Down’s syndrome shows a pattern of cognitive decline similar to that observed in patients with Alzheimer’s disease. Initially, there is a slowly progressive memory decline, followed by a linear decline in nonmemory cognitive function with accompanying dementia (1–3). Prevalence of dementia in Down’s syndrome subjects has been estimated to reach about 5%–10% up to the fifth decade of life and about 40%–50% by the sixth decade of life (1, 4). Postmortem studies show that subjects with Down’s syndrome can exhibit significant amyloid deposition in the cerebral cortex by their third or fourth decade of life (5, 6). At 40 years of age, these studies have shown that virtually all Down’s syndrome subjects have neuropathological lesions that meet the pathological criteria for Alzheimer’s disease (7–9). Earliest pathological changes are thought to occur in the medial temporal lobe, after which they are found in neocortical association regions by the age of 40 (10–13). The laminar and regional cortical distribution of amyloid and neurofibrillary pathology closely resembles that of Alzheimer’s disease, rendering Down’s syndrome a model to study the prodromal stages of Alzheimer’s disease (14).
Magnetic resonance imaging (MRI)-based measurement of regional brain atrophy can provide an in vivo estimate of neuronal and axonal loss in neurodegenerative disease. In particular, hippocampal atrophy has been established as a measure of allocortical neuronal loss in Alzheimer’s disease (15–17). The origin of corpus callosum fibers from layer III and V pyramidal neurons in the cerebral hemispheres, and studies using MRI, suggest that corpus callosum atrophy can be a marker of neocortical neuronal degeneration in Alzheimer’s disease (18–23). Several computer-assisted tomography and MRI studies have reported significantly reduced volumes of the hippocampus and adjacent medial temporal lobe structures with advancing age in nondemented subjects with Down’s syndrome (24–26), consistent with early allocortical pathological changes and memory loss. Other studies, however, failed to show a significant correlation between hippocampal volume and age in these subjects (27, 28). The most consistent age-related finding in Down’s syndrome subjects outside of the medial temporal lobe in cross-sectional studies was an increase of ventricular volume with age in nondemented elderly subjects with Down’s syndrome (24, 29). Age-related total brain and gray matter atrophy, however, was not detected before the onset of dementia (2, 24, 27, 30, 31). Age-related changes in corpus callosum size in Down’s syndrome subjects have not been studied.
In the current study, we determined with MRI regional corpus callosum area and hippocampal volume in nondemented subjects with adult Down’s syndrome and age- and gender-matched healthy comparison subjects. We hypothesized that both corpus callosum areas and hippocampal volume would be reduced in Down’s syndrome subjects with advancing age, reflecting early Alzheimer’s disease-type neuropathology. We compared the degree of age-related decrease of corpus callosum and hippocampal size, using a previously established statistical model based on receiver operating characteristic curve analysis (32). This comparison is based on the notion that corpus callosum and hippocampal atrophy reflect neocortical and allocortical Alzheimer’s disease-type neuropathology, respectively. In addition, we investigated correlations between neuropsychological measures of global and domain-specific cognitive performance and corpus callosum size. This study elucidates neocortical and allocortical morphological changes in the predementia stages of Alzheimer’s disease-type neuropathology in Down’s syndrome.
Method
Subjects
Thirty-four subjects with Down’s syndrome (trisomy 21 ascertained through karyotyping) and 31 healthy comparison subjects underwent MRI scans. The ages of the Down’s syndrome and comparison groups were similar (mean=41.6 years [SD=9.1, range=25.3–62.5] and 41.8 years [SD=10.8, range=26.2–64.5], respectively; t=0.08, df=63, p=0.94, two-tailed t test). Gender distributions were similar: 17 women and 17 men in the Down’s syndrome group and 14 women and 17 men in the comparison group (Pearson χ2=0.15, df=1, p=0.70). Hippocampal data from all subjects have been published previously (26).
To compare age effects on corpus callosum areas and hippocampal volumes, the Down’s syndrome group was divided into a young (<40 years) Down’s syndrome group (N=19, nine women and 10 men; mean age=34.9 years [SD=4.0]) and an old (>40 years) Down’s syndrome group (N=15, eight women and seven men; mean age=50.2 years [SD=5.8]). Both groups were not different in terms of gender distribution (Pearson χ2=0.1, df=1, p=0.73) or total intracranial volume (two-tailed t test: t=1.5, df=32, p=0.15). As expected, the groups differed in age (two-tailed t test: t=–9.2, df=32, p<0.001). Overall cognitive ability had been assessed by using the Peabody Picture Vocabulary Test, Revised (33). Mean test age in the Peabody Picture Vocabulary Test was 6.4 years (SD=3.0) in the young and 4.2 years (SD=2.7) in the old subjects.
All of the Down’s syndrome and comparison subjects underwent medical, neurological, and psychiatric evaluations according to published criteria (34); the assessment included a structured examination to exclude extrapyramidal diseases (35). All subjects had Hachinski scale (36) ischemia scores <5. No subject had a history of significant head trauma, toxin exposure, diabetes, or drug or alcohol abuse. Psychiatric disorders were diagnosed in four subjects with Down’s syndrome: two had obsessive-compulsive disorder, and two had psychotic disorder not otherwise specified. Twelve Down’s syndrome subjects had hypothyroidism treated with levothyroxine, and all 12 had levels of thyroid-stimulating hormone in the normal range. Normal results were observed in all subjects following urinalysis; blood measurements of electrolytes, glucose, minerals, lipids, folate, vitamin B12, antinuclear antibody, and rheumatoid factor; liver, renal, and thyroid function tests; and tests for HIV and syphilis. Several of the subjects with Down’s syndrome had functional heart murmurs, and subjects who had not previously been evaluated for valvular heart disease were evaluated with echocardiograms as part of our study. A clinical screening evaluation of the MRI, performed independently of the volumetric analyses, showed no evidence of stroke, tumor, or mass effect.
Subjects with dementia were excluded from this study. The exclusion of dementia in Down’s syndrome was made by using modified criteria from DSM-III, which specified an acquired, progressive loss of intellectual function such as loss of daily living and vocational skills, memory impairment, reduced speech and comprehension, and personality change. The diagnosis was based on interviews with caregivers, clinical examination, and bedside mental status tests that used standardized criteria (37). Diagnoses were made independently of results of neuropsychological testing and MRI and discussed to consensus by a team of neurologists, psychiatrists, and neuropsychologists experienced in the diagnosis of dementia in Down’s syndrome. Interrater reliability for our method of diagnosis of dementia in Down’s syndrome has been previously established (30).
After describing the study to each subject or to the holder of a durable power of attorney or legal guardian, written informed consent was obtained. Assent to participate in the study also was obtained from the subjects with Down’s syndrome. The research was approved by the National Institute on Aging Institutional Review Board.
MRI
MRI of the brain was performed on a 0.5-T scanner (Picker Instruments, Cleveland) and on a 1.5-T scanner (General Electric Signa II, Milwaukee). Total intracranial volume was measured from 6-mm-thick contiguous coronal slices (TR/TE=2000/20 msec, flip angle=45°, field of view=25 cm, matrix=256×160) obtained perpendicular to the inferior orbitomeatal line on the 0.5-T scanner. Hippocampal volumes were measured on 5-mm-thick contiguous oblique T1-weighted slices (15 slices, TR/TE=530/20 msec, flip angle=90°, field of view=16 cm, matrix=256×256) obtained perpendicular to the Sylvian fissure, as ascertained through sagittal scout slices and encompassing only the temporal lobe from its anterior pole to the end of the lateral sulcus, on the 1.5-T scanner. Several Down’s syndrome subjects could not complete MRI investigations while awake and thus underwent the scan with intravenous sedation while under the care of an anesthesiologist. Corpus callosum areas were determined from volumetric T1 weighted scans obtained on the 0.5-T scanner (sagittal orientation, slice thickness=2 mm, in-plane resolution=1 mm×1 mm, TR/TE=20/6 msec, flip angle=45°) in 17 Down’s syndrome and 17 comparison subjects and on the 1.5-T scanner (coronal orientation, slice thickness=2 mm, in-plane resolution=0.94 mm×0.94 mm) in 17 Down’s syndrome and 14 comparison subjects. The latter sequence was reoriented in the sagittal plane by using trilinear interpolation.
Hippocampus and Corpus Callosum Measurement
Areas of the corpus callosum and of five callosal subregions were measured in the midsagittal slice of the three-dimensional MRI by using ANALYZE software (Biomedical Imaging Resource, Mayo Foundation, Rochester, Minn.) on a workstation (Silicon Graphics, Palo Alto, Calif.), as described elsewhere (38) (Figure 1).
Briefly, total callosal area was obtained by manually tracing the outer edge of the corpus callosum on the midsagittal slice. Subsequently, areas of five callosal subregions were defined by using a simple geometrical construction. Subregions were labeled C1 to C5 in the rostral-occipital direction. Region C1 covers the rostrum and genu; regions C2–C4 the anterior, middle, and posterior truncus, respectively (region C4 also contained the isthmus); and region C5 the splenium. The number of pixels within each region was summed and multiplied by pixel size to obtain absolute values (mm2) for the measured areas.
Left and right hippocampal formations were traced according to the method of Watson et al. (39) using a workstation (Sun Microsystems, Mountain View, Calif.) with a high-resolution monitor and established tracing software (40, 41), as previously described (26). The volume, in cubic centimeters, was calculated by summing the areas (in square centimeters) of the regions of interest across slices and multiplying by slice thickness. One investigator (C.H.) measured the corpus callosum, and one investigator (J.S.K.) measured the hippocampus. Both were blind to subject group, age, gender, and cognitive status.
The intraclass correlation coefficient for interrater reliability (determined from 10 scans measured by two independent researchers) ranged from 0.98 for total corpus callosum area and subregions C1 and C2, to 0.95 for region C3. The intraclass correlation coefficient for intrarater reliability (determined from 10 scans measured twice by the same researcher, blind to scan identity) was 0.98 for total corpus callosum area (21). The intraclass correlation coefficient for intrarater reliability was 0.96 for hippocampus volumes (42).
Cognitive Assessment
All Down’s syndrome subjects underwent extensive neuropsychological testing; the applied tests are described in more detail elsewhere (3). From these tests, we identified a subset of tests that had shown significant differences between young and old Down’s syndrome subjects in a previous study (3). These were the subtests of the Down Syndrome Mental Status Examination, a range of memory tests and the extended block design test. Since the main focus was not on memory tests (which had been studied before and were hypothesized to primarily correlate with hippocampal but not corpus callosum measurements [26]) and in order to reduce the number of statistical tests, we selected only the Down Syndrome Mental Status Examination and the extended block design test for correlation analyses with volumetric measures. Overall cognitive ability in the Down’s syndrome subjects was assessed with the Peabody Picture Vocabulary Test (33).
The Peabody Picture Vocabulary Test is a test of word knowledge, in which the subject indicates a drawing that best depicts the meaning of a spoken word. It is regarded as a measure of verbal intelligence (43) and spans both very low age ranges and levels of mental ability and levels considerably above average adult ability (44). The Down Syndrome Mental Status Examination (45, 46) tests for recall of personal information (name, age, birth date), orientation (day of the week, season of the year), immediate and delayed memory (identity of three objects and location of three hidden objects), language (confrontation naming, sentence repetition, comprehension of one-, two-, and three-step commands), visuospatial performance (three-dimensional block design) and praxis (transitive and intransitive limb movements, sequential task). The extended block design test (46) is a two-dimensional construction test, derived from the WISC-R Block Design test (47). The extended block design test has eight items and uses the same blocks as the WISC-R Block Design test. All tests were administered by trained psychometricians.
Statistical Analysis
Differences of hippocampal volumes and corpus callosum areas between Down’s syndrome and comparison subjects were determined by using analysis of covariance, with group as the between-subject factor and age and total intracranial volume as covariates.
To test for the effects of age while controlling for effects of gender and total intracranial volume, we performed linear regressions. Because total intracranial volume and gender were highly collinear within both groups (with larger total intracranial volumes seen in male subjects), we used two separate multiple regression models with the regional volumes as dependent variables: one had gender entered first into the model, the other had total intracranial volume entered first; both were then followed by subject age.
Partial correlation coefficients on rank-transformed data were used to determine correlations between neuropsychological scores and regional volumes while we controlled for the effect of total intracranial volume.
We used binary logistic regression to determine the odds ratios of hippocampal volume and corpus callosum area classifying Down’s syndrome patients as belonging to the young or old Down’s syndrome group. Data were rank transformed to accommodate differences in metrics and variances between hippocampus and corpus callosum measures. Comparing the odds ratios between different measures allows determining differences in classification accuracy between regions. Classification accuracy, on the other hand, is directly related to the degree of atrophy of the specified regions. Additionally, we used analysis of areas under receiver operating characteristic curves, with age group (young Down’s syndrome versus old Down’s syndrome groups) as a dependent variable. As previously described (32), the area under the receiver operating characteristic curve can serve as a measure of the degree of atrophy and can be directly compared between different regions.
Statistical analyses were conducted by using SPSS for Windows Version 11.0 (Chicago). The statistical significance threshold was set at p<0.05.
Results
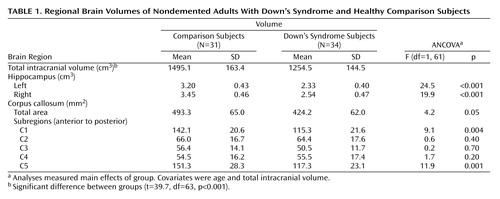
As shown in Table 1, there were significant differences between the Down’s syndrome and comparison groups in bilateral hippocampal volumes and in the total, anterior (C1), and posterior (C5) corpus callosum areas after total intracranial volume and age were controlled. Total intracranial volume differed significantly between groups but was not correlated with age in the comparison (r=0.13, df=29, p=0.46) or Down’s syndrome (r=0.17, df=29, p=0.35) groups.
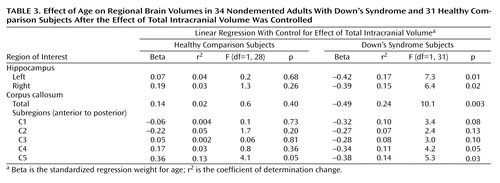
Figure 2 illustrates corpus callosum shape in a young and an old Down’s syndrome subject. In the Down’s syndrome group, there was a significant effect of age on bilateral hippocampal volumes and total corpus callosum area after gender and total intracranial volumes were controlled. Age effects were predominant in posterior corpus callosum subregions (C3 to C5) (Table 2, Table 3, Figure 3). In the comparison group, the only effect of age on a volumetric measure was an increase of posterior corpus callosum area with increasing age (area C5).
A binary logistic regression model was used to compare the extent of atrophy in the hippocampus and corpus callosum. Odds ratios were derived for each volumetric measure to classify Down’s syndrome subjects as belonging to the young or the old group. Odds ratios were 0.90 for reduced left hippocampal volume (95% confidence interval [CI]=0.83–0.98), 0.91 for reduced right hippocampal volume (95% CI=0.84–0.99), and 0.91 for reduced total corpus callosum area (95% CI=0.84–0.99). In accordance with these findings, areas under receiver operating characteristic curves, classifying Down’s syndrome subjects into the young and old Down’s syndrome groups, were nearly identical between bilateral hippocampus and total corpus callosum (left hippocampus: 0.76 [95% CI=0.59–0.92]; right hippocampus: 0.74 [95% CI=0.57–0.91]; total corpus callosum: 0.74 [95% CI=0.57–0.91]). Odds ratios and area under the receiver operating characteristic curves for corpus callosum subregions were not significantly different from random classification.
When total intracranial volume was controlled by using partial correlation, there were significant correlations between area C3 and total Down Syndrome Mental Status Examination (r=0.37, p<0.05), as well as language (r=0.46, p<0.05), and orientation (r=0.37, p<0.05) subscores. C4 area was significantly correlated with total Down Syndrome Mental Status Examination score (r=0.46, p<0.05), as well as language (r=0.41, p<0.05), orientation (r=0.52, p<0.01), visuospatial (r=0.54, p<0.01) and memory (r=0.42, p<0.05) subscores and the extended block design test (r=0.41, p<0.05). There were no other significant correlations between corpus callosum areas and neuropsychological scores.
Discussion
We used MRI to investigate age-related decreases of corpus callosum and hippocampal size in nondemented adult subjects with Down’s syndrome and in healthy age- and gender-matched comparison subjects. As previously reported (26), Down’s syndrome subjects showed a significant correlation between hippocampus volume and age. We now report correlations between age and corpus callosum areas, most prominent in posterior subregions, in the Down’s syndrome subjects. The age-related decrease of corpus callosum area was comparable to the decrease of hippocampal volume. In contrast, there was no age effect on volumetric measures in the comparison subjects except for increased posterior corpus callosum area C5 with advancing age. These results indicate that neocortical association neurons, whose fibers are represented in the corpus callosum, are lost or otherwise abnormal in the predementia stage of Down’s syndrome. These changes are accompanied by evidence of allocortical neuronal degeneration, suggested by the age-related decrease of hippocampal volumes.
The Down’s syndrome subjects had significantly smaller hippocampal volumes and corpus callosum areas (particularly anterior and posterior) than the comparison subjects, even after intracranial volume and age were controlled. These findings agree with evidence of significant reductions of hippocampus and cerebral gray matter volumes as well as with differences in corpus callosum size and shape in Down’s syndrome subjects younger than 25 years (48–51). Therefore, age-related decrease of the corpus callosum and hippocampus in adult nondemented Down’s syndrome subjects appears to be superimposed on initial developmental changes in these structures.
Consistent with earlier imaging studies (24, 25), we found reduced hippocampal volumes in nondemented Down’s syndrome subjects with advancing age. In clinicopathological studies, MRI-determined hippocampal volume accounted for about 80% of variability of hippocampal neuron density in Alzheimer’s disease (15–17). Therefore, consistent with neuropathological studies (10), our findings suggest an early loss of allocortical neurons caused by Alzheimer’s disease-type neuropathology in the predementia stage of Down’s syndrome.
Corpus callosum atrophy has been suggested as a putative marker for the loss of intracortical-projecting neocortical association neurons in Alzheimer’s disease. The callosally projecting neurons belong to a subset of the large pyramidal neurons in lamina III and V of the association cortex (52–54), which are highly susceptible to Alzheimer’s disease degeneration (55–57). In agreement with the early involvement of these neurons, several MRI studies have reported corpus callosum atrophy in Alzheimer’s disease that was correlated with PET and EEG measures of neocortical dysfunction but independent of primary subcortical fiber degeneration (18–20, 22, 23, 38, 58). Age-related reductions of corpus callosum areas, predominant in posterior regions, in our Down’s syndrome subjects are comparable with reductions noted in Alzheimer’s disease patients (18).
The posterior corpus callosum contains axonal projections from posterior temporal, parietal, and occipital association cortical areas (59–62). This agrees with evidence (63) that reduced gray matter volumes in the posterior cerebrum correlated with neuritic plaques and neurofibrillary tangles in elderly Down’s syndrome subjects. Therefore, age-related decrease of corpus callosum in nondemented subjects with Down’s syndrome (without cerebrovascular risk factors and in the absence of MRI signs of primary subcortical fiber degeneration) most likely represents involvement of neocortical association neurons by Alzheimer’s disease-type pathology. Size of corpus callosum areas C3 and C4 was correlated with overall cognitive performance and performance in orientation, language, and visuospatial tests in the Down’s syndrome subjects. Areas C3 and C4 contain fibers from posterior temporal and from parietal lobes (59, 62). These data, although limited because of the small study group size, support the notion that the age-related decrease of corpus callosum size in Down’s syndrome reflects loss of neocortical neuronal projections involved in the maintenance of higher cognitive processes.
In an earlier study, we compared the extent of corpus callosum and hippocampal atrophy in Alzheimer’s disease patients (32). We had found that patients in mild stages of Alzheimer’s disease already exhibited posterior corpus callosum atrophy to a similar degree as hippocampal atrophy. The current study extends these findings into the predementia stage of Alzheimer’s disease-type pathology. We used a statistical approach based on the analysis of areas under the receiver operating characteristic curves (64) and odds ratios based on logistic regression analysis to determine statistical differences between the age effects on the corpus callosum and the age effects on the hippocampus. Age effects were not different between the corpus callosum and the hippocampus in the Down’s syndrome subjects. This finding suggests that neocortical neuronal alterations are comparable to those in the allocortex in the predementia stage of Down’s syndrome.
There are several potential mechanisms that might account for the correlation between age and corpus callosum size in Down’s syndrome. One is that corpus callosum development is different from normal in Down’s syndrome. Another is that corpus callosum morphology changes with age because of Down’s syndrome-specific mechanisms of neurodegeneration distinct from those of Alzheimer’s disease. A third is that corpus callosum morphology changes with age because of Alzheimer’s disease-type pathological processes.
The first mechanism most likely would not lead to an overestimation of age effects within a Down’s syndrome group. Rather, developmental abnormalities would increase variability of corpus callosum shape across subjects, thereby reducing the sensitivity of the study to detect age-related effects. This may contribute to the finding that there was no significant age effect on anterior corpus callosum, the subregion that is most affected by the developmental abnormality in Down’s syndrome (51).
In contrast, the second and third mechanisms cannot be distinguished from each other on the basis of this study. The resemblance between Down’s syndrome and Alzheimer’s disease neuropathology is close, but not perfect. In 1995 Hof et al. (10) reported that plaque density was higher in many Down’s syndrome subjects compared with Alzheimer’s disease patients and more widely distributed throughout the cortex. Additionally, several studies suggest cytoskeletal abnormalities in Down’s syndrome (65) and overexpression of proteins other than amyloid that may contribute to neurodegeneration (66, 67). Therefore, it cannot be excluded that part of the strong age effect on corpus callosum in nondemented Down’s syndrome subjects is related to Down’s syndrome-specific degenerative processes.
We found an increase of posterior corpus callosum area C5 with age in the healthy comparison subjects. There is no final explanation for this finding. Several independent studies found smaller anterior corpus callosum areas with higher age but no correlation between age and posterior corpus callosum areas (19, 68, 69). In 10 healthy subjects, followed with MRI over an average interval of 24 months, we found an average rate of atrophy of –0.9% per year for total corpus callosum and –1.6% per year for anterior corpus callosum area C1 (21). In contrast, average rate of atrophy for area C5 was 0.7%. On the basis of these earlier findings, there seems to be an age-related decrease of anterior, but not of posterior, corpus callosum in healthy subjects, and on average it may even be possible that there is a slight increase of the measured posterior corpus callosum area with age. These effects may represent changes in the shape of the corpus callosum, leading to an overestimation of posterior relative to anterior corpus callosum with higher age. To further support this interpretation, alternative techniques of corpus callosum measurement would have to be applied, such as deformation-based morphometry (70, 71). In addition, a relatively larger posterior corpus callosum area has been found in women than in men (71). This gender effect, however, cannot entirely explain the relative increase of C5 area with age in our subjects, since this effect remained significant after we controlled for gender in the linear model. Finally, there may be age-related changes in the fiber composition of the corpus callosum (72). All or some of these effects may contribute to the finding of increased posterior corpus callosum with age in healthy subjects, but it will require future study to resolve this question.
In conclusion, our results suggest that with advancing age, neocortical neuronal alterations are profound in the predementia stage of Down’s syndrome and that they are comparable to those that occur in the hippocampus. If older nondemented adults with Down’s syndrome represent a model for the predementia stage of Alzheimer’s disease, our data suggest that neocortical neuronal degeneration will be present in this stage. Future longitudinal studies on morphological changes in Down’s syndrome and Alzheimer’s disease subjects should help to test these ideas.
 |
 |
 |
Received Nov. 7, 2002; revision received Feb. 20, 2003; accepted March 3, 2003. From the Alzheimer Memorial Center and Geriatric Psychiatry Branch, Dementia and Neuroimaging Section, Department of Psychiatry, Ludwig-Maximilian University, Munich, Germany; and the Laboratory of Neurosciences, National Institute on Aging, Bethesda, Md. Address reprint requests to Dr. Teipel, Alzheimer Memorial Center and Geriatric Psychiatry Branch, Dementia and Neuroimaging Section, Department of Psychiatry, Ludwig-Maximilian University, Nussbaumstr. 7, 80336 Munich, Germany; [email protected] (e-mail). The authors thank Ms. Diane Teichberg and Ms. Lisa Chang for assisting in the preparation of the magnetic resonance imaging scans for analysis and Ms. Joanna Szczepanik for performing the neuropsychological testing. Supported by the German Competency Network on Dementias, a grant from the Medical Faculty of the Ludwig-Maximilian University to Dr. Teipel and by funding from Hirnliga, Eisai, and Pfizer to Drs. Teipel and Hampel.

Figure 1. Corpus Callosum Subregionsa Measured in 34 Nondemented Adults With Down’s Syndrome and 31 Healthy Comparison Subjects
aSubregions were measured in the midsagittal slice (C1: rostrum and genu; C2: anterior truncus; C3: middle truncus; C4: posterior truncus, isthmus; C5: splenium).

Figure 2. Shape of Corpus Callosum in Young and Old Nondemented Adults With Down’s Syndromea
aEach image is a midsagittal slice of a volumetric T1-weighted MRI scan. To facilitate direct comparison, both scans have been coregistered using a linear affine transformation algorithm implemented in SPM 99 (Wellcome Department of Cognitive Neurology, London), which takes into account global differences in head size but preserves the size and position of structures relative to each other.

Figure 3. Relationship Between Age and Total and Posterior Corpus Callosum Area in 34 Nondemented Adults With Down’s Syndrome and 31 Healthy Comparison Subjectsa
aLines represent linear regression (regression of volumes on age).
1. Lai F, Williams RS: A prospective study of Alzheimer disease in Down syndrome. Arch Neurol 1989; 46:849–853Crossref, Medline, Google Scholar
2. Schapiro MB, Haxby JV, Grady CL: Nature of mental retardation and dementia in Down syndrome: study with PET, CT, and neuropsychology. Neurobiol Aging 1992; 13:723–734Crossref, Medline, Google Scholar
3. Alexander GE, Saunders AM, Szczepanik J, Strassburger TL, Pietrini P, Dani A, Furey ML, Mentis MJ, Roses AD, Rapoport SI, Schapiro MB: Relation of age and apolipoprotein E to cognitive function in Down syndrome adults. Neuroreport 1997; 8:1835–1840Crossref, Medline, Google Scholar
4. Evenhuis HM: The natural history of dementia in Down’s syndrome. Arch Neurol 1990; 47:263–267Crossref, Medline, Google Scholar
5. Rumble B, Retallack R, Hilbich C, Simms G, Multhaup G, Martins R, Hockey A, Montgomery P, Beyreuther K, Masters CL: Amyloid A4 protein and its precursor in Down’s syndrome and Alzheimer’s disease. N Engl J Med 1989; 320:1446–1452Crossref, Medline, Google Scholar
6. Ikeda S, Yanagisawa N, Allsop D, Glenner GG: Evidence of amyloid beta-protein immunoreactive early plaque lesions in Down’s syndrome brains. Lab Invest 1989; 61:133–137Medline, Google Scholar
7. Mann DMA, Yates PO, Marcyniuk B: Alzheimer’s presenile dementia, senile dementia of Alzheimer type and Down’s syndrome in middle age form an age related continuum of pathological changes. Neuropathol Appl Neurobiol 1984; 10:185–207Crossref, Medline, Google Scholar
8. Wisniewski KE, Wisniewski HM, Wen GY: Occurrence of neuropathological changes and dementia of Alzheimer’s disease in Down’s syndrome. Ann Neurol 1985; 17:278–282Crossref, Medline, Google Scholar
9. Wisniewski KE, Dalton AJ, McLachlan C, Wen GY, Wisniewski HM: Alzheimer’s disease in Down’s syndrome: clinicopathologic studies. Neurology 1985; 35:957–961Crossref, Medline, Google Scholar
10. Hof PR, Bouras C, Perl DP, Sparks DL, Mehta N, Morrison JH: Age-related distribution of neuropathologic changes in the cerebral cortex of patients with Down’s syndrome: quantitative regional analysis and comparison with Alzheimer’s disease. Arch Neurol 1995; 52:379–391Crossref, Medline, Google Scholar
11. Sadowski M, Wisniewski HM, Tarnawski M, Kozlowski PB, Lach B, Wegiel J: Entorhinal cortex of aged subjects with Down’s syndrome shows severe neuronal loss caused by neurofibrillary pathology. Acta Neuropathol 1999; 97:156–164Crossref, Medline, Google Scholar
12. Mann DM, Esiri MM: The pattern of acquisition of plaques and tangles in the brains of patients under 50 years of age with Down’s syndrome. J Neurol Sci 1989; 89:169–179Crossref, Medline, Google Scholar
13. Hyman BT, West HL, Rebeck GW, Lai F, Mann DM: Neuropathological changes in Down’s syndrome hippocampal formation: effect of age and apolipoprotein E genotype. Arch Neurol 1995; 52:373–378Crossref, Medline, Google Scholar
14. Mann DM: The pathological association between Down syndrome and Alzheimer disease. Mech Ageing Dev 1988; 43:99–136Crossref, Medline, Google Scholar
15. Bobinski M, Wegiel J, Wisniewski HM, Tarnawski M, Reisberg B, De Leon MJ, Miller DC: Neurofibrillary pathology—correlation with hippocampal formation atrophy in Alzheimer disease. Neurobiol Aging 1996; 17:909–919Medline, Google Scholar
16. Bobinski M, de Leon MJ, Wegiel J, Desanti S, Convit A, Saint Louis LA, Rusinek H, Wisniewski HM: The histological validation of post mortem magnetic resonance imaging-determined hippocampal volume in Alzheimer’s disease. Neuroscience 2000; 95:721–725Crossref, Medline, Google Scholar
17. Nagy Z, Jobst KA, Esiri MM, Morris JH, King EM-F, MacDonald B, Litchfield S, Barnetson L, Smith AD: Hippocampal pathology reflects memory deficit and brain imaging measurements in Alzheimer’s disease: clinicopathological correlations using three sets of pathologic diagnostic criteria. Dementia 1996; 7:76–81Medline, Google Scholar
18. Yamauchi H, Fukuyama H, Harada K, Nabatame H, Ogawa M, Ouchi Y, Kimura J, Konishi J: Callosal atrophy parallels decreased cortical oxygen metabolism and neuropsychological impairment in Alzheimer’s disease. Arch Neurol 1993; 50:1070–1074Crossref, Medline, Google Scholar
19. Teipel SJ, Hampel H, Alexander GE, Schapiro MB, Horwitz B, Teichberg D, Daley E, Möller H-J, Hippius H, Rapoport SI: Dissociation between white matter pathology and corpus callosum atrophy in Alzheimer’s disease. Neurology 1998; 51:1381–1385Crossref, Medline, Google Scholar
20. Teipel SJ, Hampel H, Pietrini P, Alexander GE, Horwitz B, Daley E, Möller H-J, Schapiro MB, Rapoport SI: Region specific corpus callosum atrophy correlates with regional pattern of cortical glucose metabolism in Alzheimer’s disease. Arch Neurol 1999; 56:467–473Crossref, Medline, Google Scholar
21. Teipel SJ, Bayer W, Alexander GE, Zebuhr Y, Teichberg D, Kulic L, Schapiro MB, Möller H-J, Rapoport SI, Hampel H: Progression of corpus callosum atrophy in Alzheimer’s disease. Arch Neurol 2002; 59:243–248Crossref, Medline, Google Scholar
22. Janowsky JS, Kaye JA, Carper RA: Atrophy of the corpus callosum in Alzheimer’s disease versus healthy aging. J Am Geriatr Soc 1996; 44:798–803Crossref, Medline, Google Scholar
23. Hampel H, Teipel SJ, Alexander GE, Pogarell O, Rapoport SI, Moller HJ: In vivo imaging of region and cell type specific neocortical neurodegeneration in Alzheimer’s disease: perspectives of MRI derived corpus callosum measurement for mapping disease progression and effects of therapy: evidence from studies with MRI, EEG and PET. J Neural Transm 2002; 109:837–855Crossref, Medline, Google Scholar
24. Kesslak JP, Nagata SF, Lott I, Nalcioglu O: Magnetic resonance imaging analysis of age-related changes in the brains of individuals with Down’s syndrome. Neurology 1994; 44:1039–1045Crossref, Medline, Google Scholar
25. Lawlor BA, McCarron M, Wilson G, McLoughlin M: Temporal lobe-oriented CT scanning and dementia in Down’s syndrome. Int J Geriatr Psychiatry 2001; 16:427–429Crossref, Medline, Google Scholar
26. Krasuski JS, Alexander GE, Horwitz B, Rapoport SI, Schapiro MB: Relation of medial temporal lobe volumes to age and memory function in nondemented adults with Down’s syndrome: implications for the prodromal phase of Alzheimer’s disease. Am J Psychiatry 2002; 159:74–81Link, Google Scholar
27. Raz N, Torres IJ, Briggs SD, Spencer WD, Thornton AE, Loken WJ, Gunning FM, McQuain JD, Driesen NR, Acker JD: Selective neuroanatomic abnormalities in Down’s syndrome and their cognitive correlates: evidence from MRI morphometry. Neurology 1995; 45:356–366Crossref, Medline, Google Scholar
28. Aylward EH, Li Q, Honeycutt NA, Warren AC, Pulsifer MB, Barta PE, Chan MD, Smith PD, Jerram M, Pearlson GD: MRI volumes of the hippocampus and amygdala in adults with Down’s syndrome with and without dementia. Am J Psychiatry 1999; 156:564–568Abstract, Google Scholar
29. Ikeda M, Arai Y: Longitudinal changes in brain CT scans and development of dementia in Down’s syndrome. Eur Neurol 2002; 47:205–208Crossref, Medline, Google Scholar
30. Schapiro MB, Luxenberg JS, Kaye JA, Haxby JV, Friedland RP, Rapoport SI: Serial quantitative CT analysis of brain morphometrics in adult Down’s syndrome at different ages. Neurology 1989; 39:1349–1353Crossref, Medline, Google Scholar
31. Pearlson GD, Breiter SN, Aylward EH, Warren AC, Grygorcewicz M, Frangou S, Barta PE, Pulsifer MB: MRI brain changes in subjects with Down syndrome with and without dementia. Dev Med Child Neurol 1998; 40:326–334Medline, Google Scholar
32. Teipel SJ, Bayer W, Alexander GE, Bokde ALW, Zebuhr Y, Teichberg D, Müller-Spahn F, Schapiro MB, Möller H-JM, Rapoport SI, Hampel H: Regional pattern of hippocampus and corpus callosum atrophy in Alzheimer’s disease in relation to dementia severity: evidence for early neocortical degeneration. Neurobiol Aging 2003; 24:85–94Crossref, Medline, Google Scholar
33. Dunn LM, Dunn LM: Peabody Picture Vocabulary Test, Revised. Circle Pines, Minn, American Guidance Service, 1981Google Scholar
34. Duara R, Margolin RA, Robertson-Tchabo EA, London ED, Schwartz M, Renfrew JW, Koziarz BJ, Sundaram M, Grady C, Moore AM, et al.: Cerebral glucose utilization, as measured with positron emission tomography in 21 resting healthy men between the ages of 21 and 83 years. Brain 1983; 106(part 3):761–775Google Scholar
35. Kaye JA, May C, Atack JR, Daly E, Sweeney DL, Beal MF, Kaufman S, Milstien S, Friedland RP, Rapoport SI: Cerebrospinal fluid neurochemistry in the myoclonic subtype of Alzheimer’s disease. Ann Neurol 1988; 24:647–650Crossref, Medline, Google Scholar
36. Hachinski VC, Iliff LD, Zilhka E, Du Boulay GH, McAllister VL, Marshall J, Russell RW, Symon L: Cerebral blood flow in dementia. Arch Neurol 1975; 32:632–637Crossref, Medline, Google Scholar
37. Schapiro MB, Haxby JV, Grady CL, Duara R, Schlageter NL, White B, Moore A, Sundaram M, Larson SM, Rapoport SI: Decline in cerebral glucose utilisation and cognitive function with aging in Down’s syndrome. J Neurol Neurosurg Psychiatry 1987; 50:766–774Crossref, Medline, Google Scholar
38. Hampel H, Teipel SJ, Alexander GE, Horwitz B, Teichberg D, Schapiro M, Rapoport SI: Corpus callosum atrophy is a possible indicator for region and cell type specific neuronal degeneration in Alzheimer disease: an MRI analysis. Arch Neurol 1998; 55:193–198Crossref, Medline, Google Scholar
39. Watson C, Andermann F, Gloor P, Jones-Gotman M, Peters T, Evans A, Olivier A, Melanson D, Leroux G: Anatomic basis of amygdaloid and hippocampal volume measurement by magnetic resonance imaging. Neurology 1992; 42:1743–1750Crossref, Medline, Google Scholar
40. DeCarli C, Maisog J, Murphy DG, Teichberg D, Rapoport SI, Horwitz B: Method for quantification of brain, ventricular, and subarachnoid CSF volumes from MR images. J Comput Assist Tomogr 1992; 16:274–284Crossref, Medline, Google Scholar
41. Murphy DG, DeCarli C, Schapiro MB, Rapoport SI, Horwitz B: Age-related differences in volumes of subcortical nuclei, brain matter, and cerebrospinal fluid in healthy men as measured with magnetic resonance imaging. Arch Neurol 1992; 49:839–845Crossref, Medline, Google Scholar
42. Krasuski JS, Alexander GE, Horwitz B, Daly EM, Murphy DGM, Rapoport SI, Schapiro MB: Volumes of medial temporal lobe structures in patients with Alzheimer’s disease and mild cognitive impairment (and in healthy controls). Biol Psychiatry 1998; 43:60–68Crossref, Medline, Google Scholar
43. Stevenson JD Jr: Alternate form reliability and concurrent validity of the Peabody Picture Vocabulary Test for referred rehabilitation agency adults. J Clin Psychol 1986; 42:650–653Crossref, Medline, Google Scholar
44. Lezak MD: Neuropsychological Assessment. New York, Oxford University Press, 1995Google Scholar
45. Tyrrell J, Cosgrave M, McCarron M, McPherson J, Calvert J, Kelly A, McLaughlin M, Gill M, Lawlor BA: Dementia in people with Down’s syndrome. Int J Geriatr Psychiatry 2001; 16:1168–1174Crossref, Medline, Google Scholar
46. Haxby JV: Neuropsychological evaluation of adults with Down’s syndrome: patterns of selective impairment in non-demented old adults. J Ment Defic Res 1989; 33(part 3):193–210Google Scholar
47. Wechsler DA: Wechsler Intelligence Scale for Children—Revised. New York, Psychological Corp, 1974Google Scholar
48. Pinter JD, Brown WE, Eliez S, Schmitt JE, Capone GT, Reiss AL: Amygdala and hippocampal volumes in children with Down syndrome: a high-resolution MRI study. Neurology 2001; 56:972–974Crossref, Medline, Google Scholar
49. Jernigan TL, Bellugi U, Sowell E, Doherty S, Hesselink JR: Cerebral morphologic distinctions between Williams and Down syndromes. Arch Neurol 1993; 50:186–191Crossref, Medline, Google Scholar
50. Pinter JD, Eliez S, Schmitt JE, Capone GT, Reiss AL: Neuroanatomy of Down’s syndrome: a high-resolution MRI study. Am J Psychiatry 2001; 158:1659–1665Link, Google Scholar
51. Wang PP, Doherty S, Hesselink JR, Bellugi U: Callosal morphology concurs with neurobehavioral and neuropathological findings in two neurodevelopmental disorders. Arch Neurol 1992; 49:407–411Crossref, Medline, Google Scholar
52. Aboitiz F, Scheibel AB, Fisher RS, Zaidel E: Fiber composition of the human corpus callosum. Brain Res 1992; 598:143–153Crossref, Medline, Google Scholar
53. Innocenti GM: General organization of callosal connections in the cerebral cortex, in Cerebral Cortex: Sensory Motor Areas and Aspects of Cortical Connectivity, vol 5. Edited by Jones EG, Peters A. New York, Plenum, 1986, pp 291–353Google Scholar
54. Jones EG: Laminar distribution of cortical efferent cells, in Cerebral Cortex: Cellular Components of the Cerebral Cortex., vol 1. Edited by Peters A, Jones EG. New York, Plenum, 1984, pp 521–553Google Scholar
55. Hof PR, Cox K, Morrison JH: Quantitative analysis of a vulnerable subset of pyramidal neurons in Alzheimer’s disease, I: superior frontal and inferior temporal cortex. J Comp Neurol 1990; 301:44–54Crossref, Medline, Google Scholar
56. Hof PR, Morrison JH: Quantitative analysis of a vulnerable subset of pyramidal neurons in Alzheimer’s disease, II: primary and secondary visual cortex. J Comp Neurol 1990; 301:55–64Crossref, Medline, Google Scholar
57. Hof PR, Morrison JH: Neocortical neuronal subpopulations labeled by a monoclonal antibody to calbindin exhibit differential vulnerability in Alzheimer’s disease. Exp Neurol 1991; 111:293–301Crossref, Medline, Google Scholar
58. Hampel H, Teipel SJ, Alexander GE, Horwitz B, Hippius H, Möller H-J, Schapiro MB, Rapoport SI: Corpus callosum measurement is an in vivo indicator for neocortical neuronal integrity, but not white matter pathology, in Alzheimer’s disease. Ann NY Acad Sci 2000; 903:470–477Crossref, Medline, Google Scholar
59. De Lacoste MC, Kirkpatrick JB, Ross ED: Topography of the human corpus callosum. J Neuropathol Exp Neurol 1985; 44:578–591Crossref, Medline, Google Scholar
60. Schaltenbrand G, Spuler H, Wahren W: Electroanatomy of the corpus callosum radiation according to the facts of stereotactic stimulation in man. Z Neurol 1970; 198:79–92Medline, Google Scholar
61. Pandya DN, Seltzer B: The topography of commissural fibers, in Two Hemispheres—One Brain: Functions of the Corpus Callosum. Edited by Lepore F, Ptito M, Jasper HH. New York, Alan R Liss, 1986, pp 47–73Google Scholar
62. Moses P, Courchesne E, Stiles J, Trauner D, Egaas B, Edwards E: Regional size reduction in the human corpus callosum following pre- and perinatal brain injury. Cereb Cortex 2000; 10:1200–1210Crossref, Medline, Google Scholar
63. de la Monte SM, Hedley-Whyte ET: Small cerebral hemispheres in adults with Down’s syndrome: contributions of developmental arrest and lesions of Alzheimer’s disease. J Neuropathol Exp Neurol 1990; 49:509–520Crossref, Medline, Google Scholar
64. Metz CE: Basic principles of ROC analysis. Semin Nucl Med 1978; 8:283–298Crossref, Medline, Google Scholar
65. Mann DM, Prinja D, Davies CA, Ihara Y, Delacourte A, Defossez A, Mayer RJ, Landon M: Immunocytochemical profile of neurofibrillary tangles in Down’s syndrome patients of different ages. J Neurol Sci 1989; 92:247–260Crossref, Medline, Google Scholar
66. Engidawork E, Lubec G: Protein expression in Down syndrome brain. Amino Acids 2001; 21:331–361Crossref, Medline, Google Scholar
67. De La Torre R, Casado A, Lopez-Fernandez E, Carrascosa D, Ramirez V, Saez J: Overexpression of copper-zinc superoxide dismutase in trisomy 21. Experientia 1996; 52:871–873Crossref, Medline, Google Scholar
68. Weis S, Kimbacher M, Wenger E, Neuhold A: Morphometric analysis of the corpus callosum using MR: correlation of measurements with aging in healthy individuals. Am J Neuroradiol 1993; 14:637–645Medline, Google Scholar
69. Salat D, Ward A, Kaye JA, Janowsky JS: Sex differences in the corpus callosum with aging. Neurobiol Aging 1997; 18:191–197Crossref, Medline, Google Scholar
70. Thompson PM, Narr KL, Blanton RE, Toga AW: Mapping structural alterations of the corpus callosum during brain development and degeneration, in The Parallel Brain: The Cognitive Neuroscience of the Corpus Callosum. Edited by Zaidel E, Iacoboni M. Cambridge, Mass, MIT Press, 2003Google Scholar
71. Davatzikos C, Vaillant M, Resnick SM, Prince JL, Letovsky S, Bryan RN: A computerized approach for morphological analysis of the corpus callosum. J Comput Assist Tomogr 1996; 20:88–97Crossref, Medline, Google Scholar
72. Aboitiz F, Rodriguez E, Olivares R, Zaidel E: Age-related changes in fibre composition of the human corpus callosum: sex differences. Neuroreport 1996; 7:1761–1764Crossref, Medline, Google Scholar