Hypofrontality in Attention Deficit Hyperactivity Disorder During Higher-Order Motor Control: A Study With Functional MRI
Abstract
OBJECTIVE: Functional magnetic resonance imaging (MRI) was used to investigate the hypothesis that attention deficit hyperactivity disorder (ADHD) is associated with a dysfunction of prefrontal brain regions during motor response inhibition and motor timing. METHOD: Generic brain activation of seven adolescent boys with ADHD was compared to that of nine comparison subjects equivalent in sex, age, and IQ while they were performing a stop task, requiring inhibition of a planned motor response, and a motor timing task, requiring timing of a motor response to a sensory cue. RESULTS: The hyperactive adolescents showed lower power of response in the right mesial prefrontal cortex during both tasks and in the right inferior prefrontal cortex and left caudate during the stop task. CONCLUSIONS: ADHD is associated with subnormal activation of the prefrontal systems responsible for higher-order motor control. Functional MRI is a feasible technique for investigation of neural correlates of ADHD.
Attention deficit hyperactivity disorder (ADHD) is characterized by inattention, hyperactivity, and impulsivity. The neuropsychological deficits involve higher-order executive control functions, such as response inhibition (1) and motor timing (2). Experimental studies consistently show that children with ADHD perform poorly on tasks where a motor response has to be inhibited, such as go–no-go (3, 4), stop (5, 6), and Stroop (7, 8) tasks. Hyperactive adolescents also perform poorly on tasks requiring temporal accuracy of movement (8). Inappropriate temporal and inhibitory control of motor output may account for a wide range of symptoms, including motor clumsiness, prepotent responses in cognitive tasks, problems with delaying responses, poor protection of interference, disruptive social behavior, and emotional dyscontrol.
Abnormalities in patients with ADHD have been observed in different brain regions (9). Structural neuroimaging studies have shown volumetric abnormalities of the frontal lobes (10–12), basal ganglia (10–13), corpus callosum (14), and parietal lobes (11). Low frontal and striatal volumes have been found to correlate with impaired performance on tasks of response inhibition (12). The results of functional imaging studies have not been entirely consistent but have demonstrated low brain activity by means of positron emission tomography, single photon emission tomography, and EEG in superior and inferior prefrontal brain areas (15, 16), the caudate nucleus (17, 18), and parietal brain regions (19, 20).
It has been a challenge to develop methods of functional imaging that can be safely and acceptably applied to children in order to determine the brain activity associated with tasks involving higher-order motor and cognitive functions. Functional magnetic resonance imaging (MRI) is a recently developed noninvasive technique that allows localized areas of brain activation to be studied at a good spatial resolution during cognitive task performance in relatively short periods of time. It is therefore potentially suitable for use in the investigation of childhood disorders.
We previously developed two experimental tests for periodic activation of neural systems involved in aspects of higher-order motor control: a “stop” task (21), requiring inhibition of a planned response, and a “delay” task (22), requiring synchronization of a motor response to an intermittently appearing visual stimulus. In a group of normal adults we demonstrated activation by the stop task of a predominantly right hemisphere network, comprising the mesial and inferior frontal cortex and caudate nucleus (21). Performance of the delay task by the same group of subjects elicited dorsolateral prefrontal, mesial frontal, and parietal activation (22).
In the current study we applied these two tests to a controlled investigation of higher-order motor control in adolescent patients with a diagnosis of hyperactivity disorder. In light of our prior findings, we expected to find less activity in the frontal brain regions of the seven hyperactive subjects studied, during both motor response inhibition and motor timing, than in nine healthy comparison subjects. Adolescents, rather than children, with current evidence of hyperactive behavior were chosen in order to reduce the possibility of movement artifacts. The neuropsychological deficits underlying ADHD, including performance on inhibition tasks, have been shown to persist into adolescence (23); we therefore considered that any findings were likely to generalize to the problems of younger children. A subsidiary, but necessary, hypothesis was that functional MRI could reliably be applied to the rather difficult subject group of young people with markedly hyperactive behavior.
METHOD
Subjects
Seven clinically referred right-handed (24) male adolescents aged 12 to 18 years (mean=15.71 years) who met the DSM-IV criteria for ADHD participated in the study. The hyperactive adolescents scored above the conventional thresholds for hyperactivity on the activity scale of a standardized parental interview, the Parental Account of Child Symptoms (25) (mean score=1.79), and on the Conners teacher rating scale (26). The exclusion criteria were comorbidity with any other psychiatric disorder, such as learning or speech disorder, with the exception of conduct disorder, which can be seen as a complication of ADHD (27). Patients with neurological disease were also excluded. The patients were either unmedicated or medication free for 1 week before scanning. The comparison subjects were nine male adolescents aged 12 to 17 years (mean=15.01) with corresponding nonverbal IQs who did not meet any criteria for psychiatric disorder and scored below the thresholds on the Parents Account of Child Symptoms (mean score=0.01) and the Conners teacher rating scale.
Intellectual ability was assessed with Raven’s Standard Progressive Matrices (28). No group differences were observed in mean scores: comparison group, 47.7 (SD=7.2); ADHD group, 36.1 (SD=15.2) (t=1.85, df=14, p=0.10, N=16, two-tailed t test).
Written consent was obtained from the parents of all subjects, and the study was approved by the Ethics Committee of the Royal Bethlem and Maudsley Hospital National Health Service Trust.
Experimental Design
Each experimental task consisted of two main conditions (activation and control condition). Each condition lasted 30 seconds and was preceded by a short visual cue (lasting 3 seconds), warning the subject that one of the conditions was about to begin. The total epoch length (cue plus task) was therefore 33 seconds. The control and activation conditions were periodically alternated five times in the course of a single experiment lasting 5.5 min. The control condition was presented first.
Stop task
In the control condition, an airplane appeared on the screen; the interstimulus interval was 1650 msec—the airplane appeared for 1000 msec and was then followed by a 650-msec blank screen—and there were 18 stimuli per epoch. For 50% of the trials the airplane was followed by a zeppelin, which appeared 250 msec after the onset of the airplane, replacing it for 300 msec, and was then followed by a blank screen for 1100 msec. The subject was required to press a button whenever an airplane appeared, whether or not it was followed by a zeppelin. The activation (stop) condition was identical except that a bomb appeared in 50% of the trials, instead of the zeppelin, 250 msec after the airplane. The subject was instructed to press the button if the airplane appeared alone and not to press the button if the airplane was followed by the bomb.
Delay task
This test alternated between two synchronization tasks that differed exclusively in their interstimulus interval (short- and long-event-rate conditions). In the short-event-rate condition, a visual stimulus appeared on a computer screen with an interstimulus interval of 600 msec. The subject had to produce high-frequency movements (tapping) in order to synchronize his motor response to the visual stimulus. In the long-event-rate (delay) condition a visual stimulus appeared with an interstimulus interval of 5 sec and the subject had to synchronize his motor response to the visual stimulus, generating intermittent movements. In both conditions the subject was instructed to synchronize his motor response with the appearance of the stimulus by pressing a response button with his right hand at the same time as or shortly after seeing the visual stimulus. In order to be able to synchronize, especially in the long-event-rate condition, the subject was instructed to monitor the time elapsed since presentation of the previous stimulus.
The computerized activation images were visually presented to the subject in the scanner by means of a mirror from a liquid crystal diode projector. Throughout acquisition of the MR images, the subject responded to the stimuli by means of a right-handed button press, which was recorded by means of an MR-compatible interface to a personal computer.
Functional MRI Data Acquisition and Analysis
Image acquisition
Gradient-echo echoplanar MR images were acquired by using a 1.5-T GE Signa system (General Electric, Milwaukee) fitted with Advanced NMR hardware and software (Advanced NMR Systems, Woburn, Mass.) at the Maudsley Hospital, London. Daily quality assurance was carried out to ensure a high signal-to-noise ratio and excellent temporal stability by using an automated quality control procedure (29). A quadrature birdcage head coil was used for radio frequency transmission and reception. In each of 15 noncontiguous planes parallel to the anterior-posterior commissure, 100 T2*-weighted MR images depicting blood-oxygenation-level-dependent (BOLD) contrast (30) were acquired with TE=40 msec, TR=3000 msec, flip angle=90˚, in-plane resolution=3.1 mm, slice thickness=5 mm, slice-skip=0.5 mm. Head movement was limited by foam padding within the head coil and a restraining band across the forehead. At the same session, a 43-slice, high-resolution inversion recovery echoplanar image of the whole brain was acquired in the intercommissural plane with TE=40 msec, TI=180 msec, TR=16,000 msec, in-plane resolution=1.5 mm, slice thickness=3 mm, slice-skip=0.3 mm.
Movement estimation and correction
Before image analysis a two-stage motion correction procedure was used in order to reduce the impact of slight subject motion (31). Since head movement can adversely affect functional MRI analysis and differences in the degree of motion between groups can account for apparent differences in physiological response, the amounts of stimulus-correlated motion in the two groups were compared by using the mean of each of six rigid body movement modes (three translations, three rotations), individually estimated for each subject.
Generic brain activation mapping
The methods used for functional MRI time series analysis have been described elsewhere in detail (31, 32). The power of periodic signal change at the frequency of alternation between the control and activation conditions (1/60 Hz) was modeled by the sum of a sine wave and cosine wave at that frequency. The amplitudes of the sine and cosine waves, γ and δ respectively, were estimated by fitting a sinusoidal regression model to the movement-corrected functional MRI time series at each voxel. The model was fit by using an iterated least-squares procedure: the residuals of an ordinary least-squares fit were modeled as a first-order autoregressive process, the terms of the sinusoidal regression model were transformed by the estimated first-order autoregressive coefficient, and the transformed model was fit again by ordinary least squares. This procedure can be regarded as a technique for prewhitening model residuals or noise. The sum of squared amplitudes γ and δ, divided by its standard error, provided a standardized estimate of experimentally determined power, the fundamental power quotient (32). The sign of γ indicated the phase of periodic signal change with respect to the input function; voxels with γ>0 had maximum signal during the first (control) condition, and voxels with γ<0 had maximum signal value during the second (activation) condition. Maps were constructed to represent the fundamental power quotient and γ at each voxel of each observed data set. Each observed time series was randomly permuted 10 times, and the fundamental power quotient was estimated as just described in each randomized time series, to generate 10 permuted maps of the fundamental power quotient for each subject in each anatomical plane.
To construct generic brain activation maps, all observed and permuted fundamental power quotient maps were transformed into the standard space of Talairach and Tournoux (33) and smoothed by a two-dimensional Gaussian filter (SD=3.0 mm). The median value of the fundamental power quotient at each intracerebral voxel in standard space was then tested against a critical value of the permutation distribution for the median fundamental power quotient ascertained from the permuted fundamental power quotient maps. For a one-tailed permutation test of size α=0.003, the critical value was the 100 × (1–α)th percentile value of the permutation distribution (34–36).
The maps of γ for each individual were likewise transformed into standard space and smoothed. The median value of γ was computed for each generically activated voxel. If median γ>0, that voxel was considered to be generically activated by the control condition; if median γ<0, that voxel was considered to be generically activated by the activation condition. Voxels activated in phase with the activation condition were colored and superimposed on a gray-scale template image to form a generic brain activation map (31).
To estimate the difference between the comparison and hyperactive groups in the mean power of response to the activation condition, while controlling for the possibly confounding effects of variability in nonverbal IQ, we fitted the following analysis of covariance (ANCOVA) model at the ith voxel generically activated by the activation condition in one or both of the groups:
FPQi,j,k = µi + β1 Groupi,j + β2 IQi,j,k + εi,j,k
Here, FPQi,j,k denotes the standardized power of response in the kth individual in the jth group, IQi,j,k denotes the nonverbal IQ, and εi,j,k denotes the residual for the same individual. Group denotes a factor coding the main effect of diagnostic status, and µi + β1 Groupi,j denotes the mean power of response in the jth group. The null hypothesis of zero between-group difference in the mean fundamental power quotient was tested by comparing the observed coefficient β1 to critical values of its nonparametrically ascertained null distribution. To do this, the elements of Group were randomly permuted 10 times at each voxel, β1 was estimated at each voxel after each permutation, and these estimates were pooled over all intracerebral voxels in standard space to sample the permutation distribution of β1. Critical values for a two-tailed permutation test of size α=0.05 were the 100 × (α/2)th and 100 × (1–α/2)th percentiles of this distribution (34, 37). Note that this uncorrected probability threshold was used to identify differentially activated voxels only within the restricted search volume of voxels generically activated by the activation condition of each task in one or both groups.
RESULTS
Behavioral Data
Stop task
The hyperactive group showed a nearly significantly shorter mean reaction time than the comparison subjects on the go trials (ADHD group: 563.7 msec, SD=129.0; comparison group: 644.2 msec, SD=66.4) (t=2.03, df=14, p=0.06, N=16, two-tailed t test) and a nearly significantly lower probability of inhibition in the inhibition trials (ADHD group: 70.7%, SD=31.2%; comparison group: 93.3%, SD=4.9%) (t=1.89, df=6.24, p=0.10, N=16, two-tailed t test for unequal variances).
Delay task
No group differences were observed in the mean synchronization time, calculated as the absolute mean deviation in time from stimulus onset (ADHD group: 391.9 msec, SD=161.0; comparison group: 306.9 msec, SD=56.8) (t=–1.48, df=14, p=0.16, N=16, two-tailed t test), or in its mean intrasubject variability (ADHD group: 206.7 msec, SD=181.8; comparison subjects: 128.7 msec, SD=57.2) (t=–1.22, df=14, p=0.24, N=16, two-tailed t test).
There was no significant correlation between nonverbal IQ and any of these measures of delay and stop task performance during scanning.
Imaging Data
There was no significant difference between groups in any mode of stimulus-correlated motion estimated during performance of either the stop or delay task; for the stop task, the mean score of the comparison group was 0.9 (SD=0.5), and the mean score of the ADHD group was 1.3 (SD=1.0) (t=–0.80, df=8.29, p=0.45, N=16, two-tailed test for unequal variances). The mean scores on the delay task were 2.2 (SD=1.6) and 1.7 (SD=1.8) for the comparison and ADHD groups, respectively (t=0.54, df=14, p=0.60, N=16, two-tailed t test).
Stop task
Generic activation in the comparison subjects during the stop condition (p<0.003) was observed in the right mesial frontal cortex (approximate Brodmann area 8/32), right medial/inferior prefrontal lobe (Brodmann areas 9/45 and 45), right supplementary motor area (Brodmann area 6), and right and left caudate nuclei (Figure 1).
Generic activation in the subjects with ADHD during the stop condition was observed in the right pre- and postcentral gyrus (Brodmann area 4/3/2/1), right inferior parietal lobe (Brodmann area 40), and right caudate nucleus (Figure 1).
We used analysis of variance, as described earlier more formally, to test the null hypothesis of zero between-group difference in the mean fundamental power quotient at each voxel generically activated in one group or both. There was no overlap between the activation patterns of the two groups. The search volume for this comparison was 196 voxels, and the voxel-wise probability of a false positive test was p<0.05. At this size of test and with an assumption of independence, we expect 10 false positive tests. In fact, we observed significant differences at 46 voxels.
Compared to the hyperactive group, the comparison subjects showed significantly greater power of functional response in the right mesial frontal cortex (Brodmann area 8/32), right inferior and medioinferior frontal lobe (Brodmann areas 45 and 9/45), and predominantly left caudate nucleus (Table 1, Figure 2).
Delay task
Generic activation in the comparison subjects during the delay condition was observed predominantly in the right mesial frontal lobe (Brodmann area 32) and in the posterior cingulate gyrus (Brodmann area 31), right supplementary motor area (Brodmann area 6), and right and left extrastriate cortex (Brodmann area 18/19) (Figure 1).
Generic activation in the subjects with ADHD during the delay condition was observed mainly in both the left and right putamen, the right supplementary motor area (Brodmann area 6), and the right extrastriate cortex (Brodmann area 18) (Figure 1).
The search volume for ANCOVA was 148 voxels, and the voxel-wise probability of a false positive test was p<0.05. At this size of test and with an assumption of independence, we expect seven false positive tests. We observed significant differences at 67 voxels.
The comparison subjects showed greater power of response in the anterior (Brodmann area 32) and posterior (Brodmann area 31) cingulate gyrus. A small focus of greater power of response in the hyperactive group was observed in the right supplementary motor area (Brodmann area 6) (Table 1, Figure 2).
DISCUSSION
The neuroactivation pattern observed in the hyperactive adolescents differed quantitatively and qualitatively from that of the comparison subjects during performance of two tasks testing high-level executive control. Overall, the hyperactive adolescents showed less brain activity, predominantly in the right hemisphere mesial frontal cortex during both tasks and in the right inferior prefrontal cortex and left caudate nucleus during the stop task.
Hypofrontality in the hyperactive adolescents is in line with the hypothesis of a maturational lag as the cause of ADHD, in particular, late development of the frontal lobes (38). The brain region that was activated in the comparison but not in the hyperactive subjects during performance of both tasks was the right mesial frontal gyrus—at the border with the anterior cingulate in the stop task and in the anterior part of the anterior cingulate in the delay task. The activation of this area in both tasks suggests that it subserves higher-order motor control functions, such as motor attention and response selection, common to both tasks. This is in line with reports from neuroimaging studies of adults that the anterior cingulate is involved in a wide range of motor attentional and motor control functions, including output-related attention and response selection (39, 40). In subjects with ADHD, the structural development of this area has been related to performance on selective attention (12) and subnormal cerebral glucose metabolism has been observed during performance on sustained attention (15). The underfunctioning of a structure responsible for motor attention may underlie the deficits in different executive functions in ADHD. Less activation in the posterior cingulate during the delay task suggests, for the first time to our knowledge, that not only prefrontal but also posterior parts of the midline attentional system are affected in ADHD.
The comparison subjects’ activation in the right inferior frontal lobe and caudate nucleus during the stop task seems to be more specifically related to response inhibition. The right inferior frontal lobe—and its projections to the caudate—has been related to response inhibition in recent functional neuroimaging studies (12, 41). It thus seems that the brake system of the brain is localized to the right prefrontal lobe, and its underactivation in ADHD seems to be the neural correlate of a less efficient inhibitory motor control. The right hemisphere pattern of hypofrontality in the hyperactive subjects in both experiments and the caudate underactivation in the stop task support the existing structural and functional neuroimaging evidence for right hemisphere frontal and striatal dysfunction and/or dysplasia in ADHD (10–12, 17, 18).
The “qualitatively” different patterns of activation in the two groups was not specifically part of our hypothesis and should therefore be interpreted with caution. It could be argued that the lack of prefrontal activation has been compensated for in the hyperactive subjects by activation in posterior frontal brain regions. Further studies are needed to confirm this hypothesis.
In summary, it has been shown that functional MRI is a feasible technique for investigating the underlying neural mechanisms of cognitive functioning in a difficult developmental disorder such as ADHD. Our findings of mesial hypofrontality in adolescents with ADHD during performance of two different executive tasks suggest a task-unspecific deficit in higher-order attentional regulation of the motor output. Lower than normal activation of the right inferior prefrontal cortex and caudate nucleus during the stop task may be responsible for poor inhibitory control in ADHD.
Presented in part at the 3rd and 4th International Conferences on Functional Mapping of the Human Brain, Copenhagen, May 19–23, 1997, and Montreal, June 7–12, 1998, and at the 6th annual meeting of the International Society for Magnetic Resonance in Medicine, Sydney, Australia, April 18–24, 1998. Received June 11, 1998; revisions received Oct. 13 and Nov. 24, 1998; accepted Dec. 17, 1998. From the Medical Research Council Child and Adolescent Psychiatry Unit, Institute of Psychiatry, Kings’ College. Address reprint requests to Dr. Rubia, MRC Child and Adolescent Psychiatry Unit, Institute of Psychiatry, De Crespigny Park, London SE5 8AF, U.K.; [email protected] (e-mail). Supported in part by a European Community grant for the Training and Mobility of Researchers (Drs. Rubia and Overmeyer), by the European BIOPHYRIS network (coordinator, J. Sergeant), and by the Wellcome Trust (Dr. Bullmore).
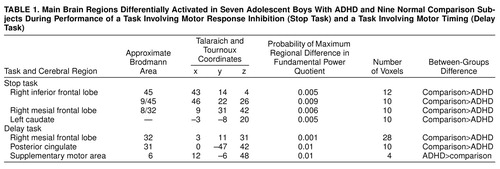 |

FIGURE 1. Generic Brain Activation Maps for Seven Adolescent Boys With ADHD and Nine Normal Comparison Subjects (C) During Performance of a Task Involving Motor Response Inhibition (Stop Task) and a Task Involving Motor Timing (Delay Task)a
aThe distance from the anterior/posterior commissure is indicated in millimeters. The right side of the image corresponds to the left side of the brain. The voxel-wise probability of type I error is 0.003.

FIGURE 2. Areas of Significant Difference (ANCOVA Maps) in Power of Brain Activation Between Seven Adolescent Boys With ADHD and Nine Normal Comparison Subjects During Performance of a Task Involving Motor Response Inhibition (Stop Task) and a Task Involving Motor Timing (Delay Task)a
aYellow voxels show greater mean signal power in the comparison subjects; red voxels show greater mean signal power in the adolescents with ADHD. The voxel-wise probability of type I error is 0.05.
1. Barkley RA: Behavioral inhibition, sustained attention, and executive functions: constructing a unifying theory of ADHD. Psychol Bull 1997; 121:65–94Crossref, Medline, Google Scholar
2. Carte ET, Nigg JT, Hinshaw SP: Neuropsychological functioning, motor speed, and language processing in boys with and without ADHD. J Abnorm Child Psychol 1996; 24:481–498Crossref, Medline, Google Scholar
3. Trommer BL, Hoeppner JAB, Lorber R, Armstrong KJ: The go–no-go paradigm in attention deficit disorder. Ann Neurol 1988; 24:610–614Crossref, Medline, Google Scholar
4. Shue KL, Douglas VI: Attention deficit hyperactivity disorder and the frontal lobe syndrome. Brain Cogn 1992; 20:104–124Crossref, Medline, Google Scholar
5. Schachar R, Logan GD: Impulsivity and inhibitory control in normal development and childhood psychopathology. Dev Psychol 1990; 26:710–720Crossref, Google Scholar
6. Rubia K, Oosterlaan J, Sergeant JA, Brandeis D, van Leeuwen T: Inhibitory dysfunction in hyperactive boys. Behav Brain Res 1998; 94:25–32Crossref, Medline, Google Scholar
7. Gorenstein EE, Mammato CA, Sandy JM: Performance of inattentive-overactive children on selected measures of prefrontal-type function. J Clin Psychol 1989; 45:619–634Crossref, Medline, Google Scholar
8. Grodzinsky GM, Diamond R: Frontal lobe functioning in boys with attention-deficit hyperactivity disorder. Developmental Neuropsychology 1992; 8:427–445Crossref, Google Scholar
9. Swanson JM, Sergeant JA, Taylor E, Sonuga-Barke EJ, Cantwell DP: Attention-deficit hyperactivity disorder and hyperkinetic disorder. Lancet 1998; 351:429–433Crossref, Medline, Google Scholar
10. Castellanos FX, Giedd JN, Marsh WL, Hamburger SD, Vaituzis AC, Dickstein DP, Sarfatti SE, Vauss YC, Snell JW, Lange NL, Kaysen D, Krain AL, Ritchie GF, Rajapakse JC, Rapoport JL: Quantitative brain magnetic resonance imaging in attention-deficit hyperactivity disorder. Arch Gen Psychiatry 1996; 53:607–616Crossref, Medline, Google Scholar
11. Filipek PA, Semrud-Clikeman M, Steingard RJ, Renshaw PF, Kennedy DN, Biederman J: Volumetric MRI analysis comparing subjects having attention-deficit hyperactivity disorder and normal controls. Neurology 1996; 48:589–601Crossref, Google Scholar
12. Casey BJ, Trainor R, Giedd J, Vauss Y, Vaituzis CK, Hamburger S, Kozuch P, Rapoport JL: The role of the anterior cingulate in automatic and controlled processes, a developmental neuroanatomical study. Dev Psychobiol 1997; 30:61–69Crossref, Medline, Google Scholar
13. Aylward EH, Reiss AL, Reader MJ, Singer HS, Brown JE, Denckla MB: Basal ganglia volumes in children with attention deficit-hyperactivity disorder. J Child Neurol 1996; 11:112–115Crossref, Medline, Google Scholar
14. Hynd GW, Semrud-Clikeman M, Lorys AR, Novey ES, Eliopulos D: Brain morphology in developmental dyslexia and attention deficit disorder/hyperactivity. Arch Neurol 1990; 47:919–922Crossref, Medline, Google Scholar
15. Zametkin AJ, Nordahl TE, Gross M, King AC, Demple WE, Rumsey J, Hamburger S, Cohen RM: Cerebral glucose metabolism in adults with hyperactivity of childhood onset. N Engl J Med 1990; 323:1361–1366Google Scholar
16. Zametkin AJ, Liebenauer LL, Fitzgerald GA, King AC, Minkunas DV, Herscovitch P, Yamada EM, Cohen RM: Brain metabolism in teenagers with attention deficit hyperactivity disorder. Arch Gen Psychiatry 1993; 50:333–340Crossref, Medline, Google Scholar
17. Lou H, Henriksen L, Bruhn P, Borner H, Nielson JB: Striatal dysfunction in attention deficit and hyperkinetic disorder. Arch Neurol 1989; 46:48–52Crossref, Medline, Google Scholar
18. Steinberg B, Laughlin T, Lou H, Andresen J, Friberg L: The striatum in a putative cerebral network activated by verbal awareness in normal and ADHD children (abstract). Neuroimage 1997; 5(April suppl):S309Google Scholar
19. Sieg KG, Gaffney GR, Preston DF, Hellings JA: SPECT brain imaging abnormalities in attention deficit hyperactivity disorder. Clin Nucl Med 1995; 20:55–60Crossref, Medline, Google Scholar
20. Brandeis D, van Leewen TH, Rubia K, Vitacco D, Steger J, Pascual-Marqui RD, Steinhausen H-CH: Neuroelectric mapping reveals precursor of stop failures in children with attention deficits. Behav Brain Res 1998; 94:25–32Crossref, Medline, Google Scholar
21. Rubia K, Overmeyer S, Taylor E, Brammer M, Bullmore ET, Williams S, Simmons A, Andrew C: Functional neuroanatomy of motor inhibition using fMRI (abstract). Neuroimage 1997; 5(April suppl):S111Google Scholar
22. Rubia K, Overmeyer S, Taylor E, Brammer M, Williams S, Simmons A, Andrew C, Bullmore ET: Prefrontal involvement in “temporal bridging” and timing movement. Neuropsychologia 1998; 36:1283–1293Google Scholar
23. Seidman LJ, Biederman J, Faraone SV, Weber W, Ouellette C: Toward defining a neuropsychology of attention deficit-hyperactivity disorder: performance of children and adolescents from a large clinically referred sample. J Consult Clin Psychol 1997; 65:150–160Crossref, Medline, Google Scholar
24. Soper HV, Satz P, Orsini DL, Van Gorp WG, Green MF: Handedness distribution in a residential population with severe or profound mental retardation. Am J Ment Defic 1987; 92:94–102Medline, Google Scholar
25. Taylor E, Schachar R, Thorley G, Wieselberg M: Conduct disorder and hyperactivity, I: separation of hyperactivity and antisocial conduct in British child psychiatric patients. Br J Psychiatry 1986; 149:760–767Crossref, Medline, Google Scholar
26. Conners CK: A teacher rating scale for use in drug studies with children. Am J Psychiatry 1969; 126:884–888Link, Google Scholar
27. Taylor E, Chadwick O, Heptinstall E, Danckaerts M: Hyperactivity and conduct problems as risk factors for adolescent development. J Am Acad Child Adolesc Psychiatry 1996; 35:1213–1226Google Scholar
28. Raven JC: Guide to the Standard Progressive Matrices. London, HK Lewis, 1960Google Scholar
29. Simmons A, Moore E, Williams SCR: Quality control of functional magnetic resonance imaging using automated data analysis and Shewhart charting. Magn Reson Med (in press)Google Scholar
30. Ogawa S, Lee TM, Kay AR, Tank DW: Brain magnetic resonance imaging with contrast dependent on blood oxygenation. Proc Natl Acad Sci USA 1990; 3:9868–9872Google Scholar
31. Brammer MJ, Bullmore ET, Simmons A, Williams SCR, Grasby PM, Howard RJ, Woodruff PWR, Rabe-Hesketh SR: Generic brain activation mapping in functional magnetic resonance imaging: a non-parametric approach. Magn Reson Imaging 1997; 15:763–770Crossref, Medline, Google Scholar
32. Bullmore ET, Brammer MJ, Williams SCR, Rabe-Hesketh S, Janot N, David AS, Mellers JDC, Howard R, Sham P: Statistical methods of estimation and inference for functional MR image analysis. Magn Reson Med 1996; 35:261–277Crossref, Medline, Google Scholar
33. Talairach J, Tournoux P: Co-Planar Stereotaxic Atlas of the Human Brain. New York, Thieme Medical, 1988Google Scholar
34. Edgington ES: Randomization Tests. New York, Marcel Dekker, 1980Google Scholar
35. Arndt S, Cizadlo T, Andreasen NC, Heckel D, Gold S, O’Leary DS: Tests for comparing images based on randomization and permutation methods. J Cereb Blood Flow 1996; 16:1271–1279Google Scholar
36. Holmes AP, Blair RC, Watson JDG, Ford I: Nonparametric analysis of statistic images from functional mapping experiments. J Cereb Blood Flow Metab 1996; 16:7–22Crossref, Medline, Google Scholar
37. Bullmore ET, Brammer MJ, Rabe-Hesketh S, Curtis VA, Morris RG, Williams SCR, Sharma T, McGuire PK: Methods for diagnosis and treatment of stimulus-correlated motion in generic brain activation studies using fMRI. Hum Brain Mapp 1999; 16:7–22Google Scholar
38. Weinberger DR: Implications of normal brain development for the pathogenesis of schizophrenia. Arch Gen Psychiatry 1987; 44:660–669Crossref, Medline, Google Scholar
39. Devinsky O, Morrell MJ, Vogt BA: Contributions of anterior cingulate cortex to behaviour. Brain 1995; 118:279–306Crossref, Medline, Google Scholar
40. Jueptner M, Stephan KM, Frith CD, Brooks DJ, Frackowiak RSJ, Passingham RE: Anatomy of motor learning, I: frontal cortex and attention to action. J Neurophysiol 1997; 77:1313–1324Google Scholar
41. Kiefer M, Marzinich F, Weisbrod M, Scherg M, Spitzer M: The time course of brain activation during response inhibition: evidence from event-related potentials in a go/no go task. Neuroreport 1998; 9:765–770Crossref, Medline, Google Scholar