Correlations Between Apolipoprotein E ε4 Gene Dose and Whole Brain Atrophy Rates
Abstract
Objective: The purpose of this study was to characterize the relationship between whole brain atrophy rates and three levels of genetic risk for Alzheimer’s disease in cognitively normal persons. The authors previously found accelerated whole brain atrophy rates in patients with probable Alzheimer’s disease by computing changes in brain volume from sequential magnetic resonance images (MRIs). Methods: The authors assessed 36 late-middle-aged persons from three genetic groups: those with two, one, and no copies of the apolipoprotein E (APOE) ε4 allele, a common Alzheimer’s disease susceptibility gene. The participants had clinical ratings, neuropsychological tests, and volumetric T1-weighted MRIs during a baseline visit and again approximately 2 years later. Two different image-analysis techniques, brain boundary shift integration and iterative principal component analysis, were used to compute whole brain atrophy rates. Results: While there were no baseline, follow-up, or between-visit differences in the clinical ratings or neuropsychological test scores among the three subject groups, whole brain atrophy rates were significantly greater in the ε4 homozygote group than in noncarriers and were significantly correlated with ε4 gene dose (i.e., the number of ε4 alleles in a person’s APOE genotype). Conclusion: Since APOE ε4 gene dose is associated with an increased risk of Alzheimer’s disease and a younger median age at dementia onset, this study suggests an association between the risk of Alzheimer’s disease and accelerated brain atrophy rates before the onset of cognitive impairment.
Patients with Alzheimer’s disease have abnormally high rates of decline in [ 18 F]fluorodeoxyglucose (FDG) positron emission tomography (PET) measurements of the cerebral metabolic rate for glucose in the posterior cingulate, parietal, temporal, and prefrontal cortices (1 , 2) and in structural magnetic resonance imaging (MRI) measurements of the entorhinal cortex (3 , 4) , medial temporal lobe (5) , hippocampus (6) , and whole brain volume (7) . Abnormal rates of decline in the cerebral metabolic rate for glucose (8) and hippocampal volume (9) have also been reported in patients with mild cognitive impairment who subsequently developed Alzheimer’s disease. In an ongoing longitudinal study, we have used PET and MRI imaging techniques to detect and track changes in brain function and brain structure in cognitively normal, late-middle-aged persons at three levels of genetic risk for late-onset Alzheimer’s disease: those with two copies, one copy, and no copies of the apolipoprotein E (APOE) ε4 allele, a common Alzheimer’s disease susceptibility gene. We have previously shown that ε4 homozygote and heterozygote groups have abnormally low cerebral metabolic rates for glucose in the same brain regions as patients with probable Alzheimer’s disease and higher rates of the cerebral metabolic rate for glucose decline in these and other brain regions (10 , 11) , findings which have also been reported in an ε4 carrier group that presented to a clinic with memory concerns (which was approximately 10 years earlier) and had slightly lower scores on a dementia rating scale (12) . Additionally, we have shown nonsignificant tendencies for smaller right and left hippocampal volumes in ε4 homozygote individuals (13) .
In this study, we used both the well established semiautomated “brain boundary shift integral” method (also known as the “digital subtraction method”) (14 – 16) and the more recently established automated “iterative principal component analysis” method (17) to characterize 2-year declines in whole brain volume from sequential MRIs in persons with two, one, and no copies of the APOE ε4 allele. Since each additional copy of the ε4 allele is associated with an increased risk of Alzheimer’s disease and a younger median age at dementia onset, we postulated that APOE ε4 gene dose (i.e., number of ε4 alleles in a person’s APOE genotype) would be associated with significantly higher rates of whole brain atrophy prior to the onset of cognitive impairment. Independent analyses of the same MRI data using brain boundary shift integration and iterative principal component analysis, previously shown to result in highly correlated rates of brain atrophy that are comparable in their ability to distinguish patients with probable Alzheimer’s disease from healthy comparison subjects (17) , were performed to provide converging evidence in support of our predicted findings and to provide a foundation for the use of either MRI method in longitudinal MRI studies of persons at different genetic risks for Alzheimer’s disease.
Method
Subjects
As previously described (10 , 11 , 18) , newspaper ads were used to recruit cognitively normal volunteers 47 to 68 years of age who reported a first-degree family history of probable Alzheimer’s disease, denied any cognitive impairment, understood that they would not receive any information about their APOE genotype, and were studied under guidelines approved by the human subjects committees at Banner Good Samaritan Medical Center and the Mayo Clinic. Venous blood samples were drawn, and APOE genotypes were characterized with analysis involving restriction-fragment-length polymorphisms to permit the longitudinal study of individuals who were APOE ε4 homozygote, heterozygote, and noncarriers. At the time of the subjects’ baseline visit, inclusion criteria for participation in the longitudinal imaging study included scores of at least 28 on the Folstein Mini-Mental State Examination (MMSE) and less than 10 on the Hamilton Depression Rating Scale (HAM-D), the absence of a current psychiatric disorder using a structured psychiatric interview (19) , and a normal neurological exam. Subjects with a reported history of coronary artery disease, diabetes, or cerebrovascular accidents were excluded. Subjects with clinically significant abnormalities, including but not limited to the presence of lacunar infarcts on their T1-weighted MRI, were also excluded. (However, a complete clinical MRI exam, including T2-weighted images, was not acquired, preventing us from evaluating more subtle evidence of cerebrovascular disease.)
For each APOE ε4 homozygote subject, an ε4 heterozygote subject and approximately two ε4 noncarriers were individually matched for their gender, age (within 3 years), and educational level (within 2 years). During the subjects’ baseline and at an approximately 2-year follow-up visit, they underwent a medical history and neurological examination, a structured psychiatric interview, the MMSE, the HAM-D, a battery of neuropsychological tests, FDG PET, and volumetric MRI.
Whole brain atrophy rates were computed from the sequential MRIs of 36 cognitively normal subjects, including 10 APOE ε4 homozygotes, 10 ε4 heterozygotes (all with the ε3ε4 genotype), and 16 ε4 noncarriers (10 with the ε3ε3 genotype and 6 with the ε2ε3 genotype), who were individually matched for their gender, age, and educational level as previously noted. One ε4 homozygote subject showed significant decline in the battery of neuropsychological tests at the follow-up MRI and received the diagnosis of amnestic mild cognitive impairment (20) 1 years after the follow-up and the diagnosis of probable Alzheimer’s disease (21 , 22) 5 years after the follow-up. Another ε4 homozygote subject developed amnestic mild cognitive impairment 7 years after the follow-up MRI. The remaining subjects stayed cognitively healthy for at least 6 years after their follow-up MRI (although they have only begun to approach ages of increased risk for Alzheimer’s disease). The subjects received a complete description of the study and provided their written informed consent in accordance with guidelines of the Banner Health and Mayo Clinic Institutional Review Boards.
Data Acquisition and Analysis
Baseline and follow-up MRIs were acquired on the same 1.5 T Signa system (General Electric, Milwaukee) without any system upgrades between visits. A T1-weighted pulse sequence (radiofrequency-spoiled gradient recall acquisition in the steady state, repetition time=33 msec, echo time=5 msec, alpha=30°, number of excitations=1, field-of-view=24 cm, imaging matrix=256×92, slice thickness=1.5 mm, scan time=13:36 minute) was used to acquire 124 contiguous horizontal MRI slices with in-plane voxel dimensions of 0.94×1.25 mm. The baseline and follow-up T1-weighted MRIs were examined visually to ensure their freedom from artifacts, lacunar infarcts, and other clinically significant brain abnormalities, and they were analyzed to compute whole brain atrophy rates using iterative principal component analysis in Arizona and using brain boundary shift integration in London (14 – 16)(17) .
Utilizing each subject’s sequential MRIs, brain boundary shift integration was performed by London investigators, and iterative principal component analysis was performed by Arizona investigators in order to characterize and compare whole brain atrophy rates in the three genetic groups (14 – 17) and to characterize correlations between APOE ε4 gene dose and the rate of whole brain atrophy. As noted in the present study, brain boundary shift integration 1) includes some manual editing to identify brain tissue voxels, 2) normalizes the coregistered sequential images for mean brain voxel intensity, and 3) calculates the change in brain volume as the integrated intensity differences between the baseline and follow-up image. The iterative principal component analysis, which does not require manual editing or normalization for between-scan differences in voxel intensity, computes whole brain atrophy as the difference between the number of voxels that reflect tissue loss and the number of voxels that reflect tissue gain. Each analysis was performed blind to the subjects’ APOE genotype, other identifying information, and the results of the other analysis.
Brain boundary shift integration estimates whole brain atrophy rates from each individual’s coregistered, manually edited, and segmented MRIs by integrating the difference in normalized voxel intensity across the brain-CSF boundary (15 , 23) . The integral is converted to volume change by assuming that intensity changes are because of spatial shifts in the brain boundary as a consequence of diffuse atrophy ( Figure 1 ). The boundary region over which the integration is performed is obtained from the registered brain masks that are eroded and dilated to define a thin shell spanning the brain-CSF interface. To control for global intensity differences between each of the two MRIs, voxel intensities are normalized as a fraction of the mean brain intensity. Similar to previous work using brain boundary shift integration, we set lower and upper normalized intensity thresholds (0.25 and 0.75, respectively) to maximize the number of voxels in the integral while excluding those that may be included erroneously from nearby structures that impinge on the boundary region. The raw volume change measured using brain boundary shift integration was transformed into a percentage rate of change relative to the baseline brain volume for each subject.
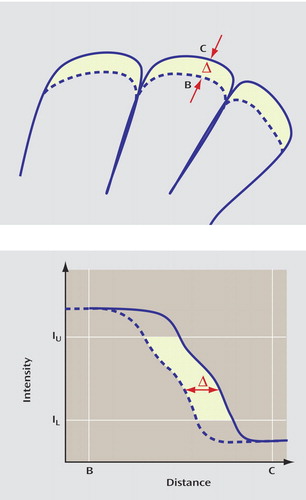
a Top: Illustrates the effect of diffuse atrophy on the position of the cortical surface. The total shift of the surface (dotted line) sweeps out a volume equal to that caused by diffuse atrophy in the enclosed volume. Bottom: Illustrates the profile of image intensities along the line BC shown in the top figure. The shaded region shows the intensity integral computed by the brain boundary shift integration.
The iterative principal component analysis was performed as previously described and evaluated (17) . Each person’s follow-up MRI was initially coregistered to his or her baseline MRI using the realignment algorithm (24) in the SPM99 software package (http://www.fil.ion.ucl.ac.uk/spm), which was modified to permit the correction for potential between-scan drifts in voxel dimensions. Brain volume was defined automatically with the SPM99 brain extraction tool, which was refined to automatically exclude any remaining nonbrain tissue. Paired voxel intensities over whole brain volumes were then plotted to iteratively determine a ray (the major axis of the principal component analysis) around which the majority of the voxel-intensity pairs formed an elongated narrow region ( Figure 2 ). The iterative principal component analysis was then used to identify the atrophy/gain as those voxel-intensity pairs whose distances to the ray were greater than a threshold distance, which was previously determined to optimize the trade-off between sensitivity and specificity. Finally, between-scan change in brain volume was translated into percent volume change per year relative to baseline intracranial volume.

a Brain atrophy was first simulated in a patient’s follow-up MRI, and intensities from the same voxel of each patient’s baseline and follow-up MRI were graphically displayed onto the x and y axes, respectively. After three iterations, the principal component analysis computed a ray that characterizes the relationship between paired voxel intensities independent of outlier effects. Then, a thresholding procedure was used to identify significant (x i , y i ) outliers, including paired voxel intensities below the ray (representing brain tissue loss [red]) and above the ray (representing tissue volume gain or relocation [pink]). Figure adapted from “An automated algorithm for the computation of brain volume change from sequential MRIs using an iterative principal component analysis and its evaluation for the assessment of whole-brain atrophy rates in patients with probable Alzheimer’s disease,” by K Chen et al. (Neuroimage 2004; 22:134-143). Reprinted with permission from Elsevier.
Statistical analyses were performed using the computer package SPSS 11.0. Annualized whole brain atrophy rates (i.e., the net loss in brain volume as a percent of baseline brain volume per year) were initially compared in the three subject groups using an analysis of variance (ANOVA) and subsequently clarified using two-sample, two-tailed protected t tests. The association between ε4 gene dose and annualized whole brain atrophy rates was characterized using linear tendency ANOVA.
Results
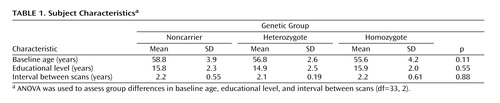
The demographic characteristics of those with two copies, one copy, and no copies of the apolipoprotein E (APOE) ε4 allele and between-scan intervals are shown in Table 1 . Their clinical ratings and neuropsychological test scores are shown in the supplemental table accompanying the online version of this article. The APOE ε4 homozygote, heterozygote, and noncarrier groups did not differ significantly in their gender distribution, age at the time of the first visit, educational level, or interval between the baseline and follow-up MRIs ( Table 1 ). The male/female gender distribution in the noncarrier, heterozygote, and homozygote groups, respectively, was 6/10, 1/9, and 2/8 (χ 2 =2.67, df=2, p=0.26). Two subjects in each of the three genetic groups reported a history of hypertension (χ 2 =3.6, df=2, p=0.84). Four ε4 homozygote subjects, four heterozygote subjects, and one noncarrier reported a history of hypercholesterolemia or use of a cholesterol-lowering medication (χ 2 =5.4, df=2, p=0.07). The three genetic groups did not differ significantly in their initial follow-up or between-visit MMSE, HAM-D, or neuropsychological test scores, and they did not differ significantly in the between-visit changes in any of these scores (shown in the supplemental table accompanying the online version of this article). Additionally, the three subject groups did not differ significantly in their baseline brain volumes (p=0.88).
As shown in Figure 3 , annualized whole brain atrophy rates (in percent volume change per year relative to the baseline intracranial volume) in the APOE ε4 homozygote, heterozygote, and noncarrier groups were 0.37 (SD=0.22), 0.18 (SD=0.16), and 0.08 (SD=0.31), respectively, using the brain boundary shift integration (ANOVA: F=3.54, df=2, 33, p=0.04; effect size=0.18) and 0.76 (SD=0.27), 0.58 (SD=0.24), and 0.43 (SD=0.27), respectively, using the iterative principal component analysis (ANOVA: F=5.07, df=2, 33, p=0.01; effect size=0.235). Both image analysis techniques detected a significant correlation between APOE ε4 gene dose and higher annualized rates of whole brain atrophy (linear tendency-ANOVA using brain boundary shift integration: F=7.07, df=1, 33, p=0.01; linear tendency-ANOVA using iterative principal component analysis: F=10.09, df=1, 33, p=0.003), and both detected significantly greater whole brain atrophy rates in the ε4 homozygote group than in noncarriers (two-tailed, two-sample t test, t=2.3918, df=24, p=0.03; effect size=1.079 using brain boundary shift integration and t=3.0962, df=24, p=0.005; effect size=1.22 using iterative principal component analysis).
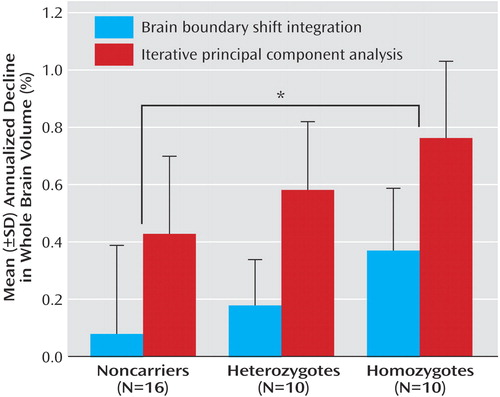
a TheAPOE ε4 gene dose was correlated with higher annualized rates of whole brain atrophy (linear tendency-ANOVA [F=7.07, df=1, 33, p=0.01] using the brain boundary shift integration [F=10.09, df=1, 33, p=0.003] and the iterative principal component analysis). As indicated by the asterisk, whole brain atrophy rates were significantly greater among ε4 homozygotes than noncarriers (two-tailed two-sample t test [t=2.3918, df=24, p=0.03] using the brain boundary shift integration [t=3.0962, df=24, p=0.005] and iterative principal component analysis).
The correlations between whole brain atrophy rates and APOE ε4 gene dose and the greater whole brain atrophy rates in the ε4 homozygote group remained significant after controlling for the subjects’ baseline age. Despite the smaller cohort sizes, these correlations also remained significant after excluding 1) the six subjects with the APOE ε2/ ε3 genotype from the ε4 noncarrier group, 2) male subjects (using iterative principal component analysis but not brain boundary shift integration), 3) persons with a reported history of hypertension (using iterative principal component analysis but not brain boundary shift integration), and 4) persons with a reported history of hypercholesterolemia or use of a cholesterol-lowering medication (using iterative principal component analysis). Although the small number of male subjects prevented us from evaluating gender differences with adequate statistical power, significant gender effects were not observed. There were no significant differences between whole brain atrophy rates of persons with and without a reported history of hypertension (six versus 30 subjects) using either iterative principal component analysis (unpaired t test, p=0.63) or brain boundary shift integration (unpaired t test, p=0.34), and there were no significant differences between whole brain atrophy rates of persons with and without a reported history of hypercholesterolemia or use of a cholesterol-lowering medication using either iterative principal component analysis (unpaired t test, p=0.32) or brain boundary shift integration (unpaired t test, p=0.60).
The image analysis techniques were unable to detect significantly greater whole brain atrophy rates in the ε4 heterozygote group than in noncarriers (two-sample t test, t=0.8596, df=24, p=0.40; effect size=0.41 using the brain boundary shift integration and t=1.4568, p=0.16; effect size=0.59 using the iterative principal component analysis). Whereas brain boundary shift integration detected a tendency for significantly greater whole brain atrophy rates in the homozygote group than in the heterozygote group (t=2.1216, df=18, p=0.05; effect size=0.99), iterative principal component analysis did not (t=1.5951, df=18, p=0.13; effect size=0.70). The failure of these techniques to detect significant differences in these between-group comparisons could at least partly reflect our relatively small cohort sizes.
Finally, we performed a post hoc analysis after excluding the single APOE ε4 homozygote subject who subsequently developed mild cognitive impairment and probable Alzheimer’s disease after the follow-up MRI. Whole brain atrophy remained significantly different among homozygote, heterozygote, and noncarrier subjects, respectively, using iterative principal component analysis (0.74 [SD=0.27], 0.58 [SD=0.24], and 0.43 [SD=0.27], respectively [ANOVA: F=4.086, df=2, 32, p=0.03]), although the group difference became marginal for brain boundary shift integration (0.36 [SD=0.23], 0.18 [SD=0.16], and 0.08 [SD=0.31], respectively [ANOVA: F=2.99, df=2, 32, p=0.06]). More importantly, results from both image-analysis techniques showed again the significant correlation between APOE ε4 gene dose and higher annualized rates of whole brain atrophy (linear tendency-ANOVA: F=5.97, df=1, 32, p=0.02 using the brain boundary shift integration and F=8.00, df=1, 32, p=0.008 using iterative principal component analysis), and both techniques detected significantly greater whole brain atrophy rates in the ε4 homozygote subjects than in noncarriers (two-tailed, two-sample t test, t=2.1871, df=23, p=0.04 using brain boundary shift integration and t=2.75, df=23, p=0.01 using iterative principal component analysis). No significant difference was found between ε4 noncarriers and ε4 heterozygote subjects or separately between ε4 heterozygote and ε4 homozygote subjects.
Discussion
Similar to patients with probable Alzheimer’s disease, cognitively normal, late-middle-aged APOE ε4 homozygote individuals, who are at particularly high risk for late-onset Alzheimer’s disease, have significantly higher rates of whole brain atrophy than noncarriers. When considered in relationship to our previous PET findings, we have now demonstrated characteristic and progressive declines in both brain function and brain structure in these cognitively normal persons at risk for Alzheimer’s disease. Based on a previous analysis of 2-year cerebral metabolic rate for glucose declines in ε4 heterozygote individuals (25) , we suggested that PET could provide a way to assess the potential of putative primary prevention therapies in this widely available group without having to study thousands of research subjects or wait many years to determine whether or when study subjects develop symptoms. Findings from this study raise the possibility that volumetric MRI could provide a complementary surrogate marker in assessing the potential of primary prevention therapies in the less widely available population of ε4 homozygote individuals.
In addition, this study demonstrates a significant correlation between APOE ε4 gene dose and rates of whole brain atrophy. In preliminary studies, we have also observed that APOE ε4 gene dose is correlated with baseline PET measurements of hypometabolism in brain regions metabolically affected in patients with Alzheimer’s disease (18) , with 2-year metabolic declines, and with baseline MRI measurements of reduced gray matter density in brain regions metabolically or histopathologically affected in patients with Alzheimer’s disease. Together, these findings suggest that FDG PET and volumetric MRI provide information related to the differential risk of Alzheimer’s disease prior to the onset of cognitive impairment. To further substantiate this proposal, it will be helpful to extend our baseline findings and 2-year declines to larger cohorts; to extend our findings to APOE ε4 carriers and noncarriers, irrespective of their reported family history; and to relate these baseline findings and 2-year declines to the subsequent rates of cognitive decline and conversion to mild cognitive impairment and probable Alzheimer’s disease in our ongoing longitudinal study. It will also be important to extend our findings to ε4 noncarriers who have other genetic or nongenetic risk factors for Alzheimer’s disease.
In summary, we have used two different MRI-analysis techniques to characterize atrophy rates from sequential MRIs in cognitively normal, late-middle-aged APOE ε4 homozygote, heterozygote, and noncarrier subjects. Whole brain atrophy rates are significantly higher in APOE ε4 homozygote individuals, who have an especially high risk for Alzheimer’s disease, and these rates are correlated with ε4 gene dose, which is associated with a progressively higher risk of Alzheimer’s disease and younger median age at dementia onset.
1. Alexander GE, Chen K, Pietrini P, Rapoport SI, Reiman EM: Longitudinal PET evaluation of cerebral metabolic decline in dementia: a potential outcome measure in Alzheimer’s disease treatment studies. Am J Psychiatry 2002; 159:738–745Google Scholar
2. Minoshima S, Foster NL, Kuhl DE: Posterior cingulate cortex in Alzheimer’s disease. Lancet 1994; 344:895Google Scholar
3. Du AT, Schuff N, Kramer JH, Ganzer S, Zhu XP, Jagust WJ, Miller BL, Reed BR, Mungas D, Yaffe K, Chui HC, Weiner MW: Higher atrophy rate of entorhinal cortex than hippocampus in AD. Neurology 2004; 62:422–427Google Scholar
4. Killiany RJ, Hyman BT, Gomez-Isla T, Moss MB, Kikinis R, Jolesz F, Tanzi R, Jones K, Albert MS: MRI measures of entorhinal cortex vs. hippocampus in preclinical AD. Neurology 2002; 58:1188–1196Google Scholar
5. Jack CR Jr, Petersen RC, Xu Y, O’Brien PC, Smith GE, Ivnik RJ, Tangalos EG, Kokmen E: Rate of medial temporal lobe atrophy in typical aging and Alzheimer’s disease. Neurology 1998; 51:993–999Google Scholar
6. Ball MJ, Fisman M, Hachinski V, Blume W, Fox A, Kral VA, Kirshen AJ, Fox H, Merskey H: A new definition of Alzheimer’s disease: a hippocampal dementia. Lancet 1985; 1:14–16Google Scholar
7. Fox NC, Freeborough PA, Rossor MN: Visualisation and quantification of rates of atrophy in Alzheimer’s disease. Lancet 1996; 348:94–97Google Scholar
8. Drzezga A, Lautenschlager N, Siebner H, Riemenschneider M, Willoch F, Minoshima S, Schwaiger M, Kurz A: Cerebral metabolic changes accompanying conversion of mild cognitive impairment into Alzheimer’s disease: a PET follow-up study. Eur J Nucl Med Mol Imaging 2003; 30:1104–1113Google Scholar
9. Grundman M, Sencakova D, Jack CR Jr, Petersen RC, Kim HT, Schultz A, Weiner MF, DeCarli C, DeKosky ST, van Dyck C, Thomas RG, Thal LJ: Brain MRI hippocampal volume and prediction of clinical status in a mild cognitive impairment trial. J Mol Neurosci 2002; 19:23–27Google Scholar
10. Reiman EM, Caselli RJ, Yun LS, Chen K, Bandy D, Minoshima S, Thibodeau SN, Osborne D: Preclinical evidence of Alzheimer’s disease in persons homozygous for the epsilon 4 allele for apolipoprotein E. N Engl J Med 1996; 334:752–758Google Scholar
11. Reiman EM, Caselli RJ, Alexander GE, Chen K: Tracking the decline in cerebral glucose metabolism in persons and laboratory animals at genetic risk for Alzheimer’s disease. Clin Neurosci Res 2001; 5:1194–1206Google Scholar
12. Small GW: Neuroimaging and genetic assessment for early diagnosis of Alzheimer’s disease. J Clin Psychiatry 1996; 57(suppl 14):9–13Google Scholar
13. Reiman EM, Uecker A, Caselli RJ, Lewis S, Bandy D, de Leon MJ, De Santi S, Convit A, Osborne D, Weaver A, Thibodeau SN: Hippocampal volumes in cognitively normal persons at genetic risk for Alzheimer’s disease. Ann Neurol 1998; 44:288–291Google Scholar
14. Fox NC, Cousens S, Scahill R, Harvey RJ, Rossor MN: Using serial registered brain magnetic resonance imaging to measure disease progression in Alzheimer disease: power calculations and estimates of sample size to detect treatment effects. Arch Neurol 2000; 57:339–344Google Scholar
15. Freeborough PA, Fox NC: The boundary shift integral: an accurate and robust measure of cerebral volume changes from registered repeat MRI. IEEE Trans Med Imaging 1997; 16:623–629Google Scholar
16. Fox NC, Warrington EK, Rossor MN: Serial magnetic resonance imaging of cerebral atrophy in preclinical Alzheimer’s disease. Lancet 1999; 353:2125Google Scholar
17. Chen K, Reiman EM, Alexander GE, Bandy D, Renaut R, Crum WR, Fox NC, Rossor MN: An automated algorithm for the computation of brain volume change from sequential MRIs using an iterative principal component analysis and its evaluation for the assessment of whole-brain atrophy rates in patients with probable Alzheimer’s disease. Neuroimage 2004; 22:134–143Google Scholar
18. Reiman EM, Chen K, Alexander GE, Caselli RJ, Bandy D, Osborne D, Saunders AM, Hardy J: Correlations between apolipoprotein E epsilon 4 gene dose and brain-imaging measurements of regional hypometabolism. Proc Natl Acad Sci U S A 2005; 102:8299–8302Google Scholar
19. Spitzer R, Williams J, Gibbon M, First M: User’s Guide for the Structured Clinical Interview for DSM-III-R (SCID). Washington, DC, American Psychiatric Publishing, 1990Google Scholar
20. Petersen RC, Stevens JC, Ganguli M, Tangalos EG, Cummings JL, DeKosky ST: Practice parameter: early detection of dementia: mild cognitive impairment (an evidence-based review). report of the quality standards subcommittee of the American Academy of Neurology. Neurology 2001; 56:1133–1142Google Scholar
21. McKhann G, Drachman D, Folstein M, Katzman R, Price D, Stadlan EM: Clinical diagnosis of Alzheimer’s disease: report of the NINCDS-ADRDA work group under the auspices of Department of Health and Human Services Task Force on Alzheimer’s disease. Neurology 1984; 34:939–944Google Scholar
22. Knopman D, DeKosky S, Cummings J, Chui H, Corey-Bloom J, Relkin N, Small G, Miller B, Stevens J: Practice parameter: diagnosis of dementia (an evidence-based review). Report of the Quality Standards Subcommittee of the American Academy of Neurology. Neurology 2001; 56:1143–1153Google Scholar
23. Freeborough PA, Fox NC, Kitney RI: Interactive algorithms for the segmentation and quantitation of 3-D MRI brain scans. Comput Methods Programs Biomed 1997; 53:15–25Google Scholar
24. Friston KJ, Ashburner J, Poline JB, Frith CD, Heather JD, Frackowiak RSJ: Spatial registration and normalisation of images. Hum Brain Mapp 1995; 2:165–189Google Scholar
25. Reiman EM, Caselli RJ, Chen K, Alexander GE, Bandy D, Frost J: Declining brain activity in cognitively normal apolipoprotein E epsilon 4 heterozygotes: a foundation for using positron emission tomography to efficiently test treatments to prevent Alzheimer’s disease. Proc Natl Acad Sci U S A 2001; 98:3334–3339Google Scholar