Subcortical MRI Volumes in Neuroleptic-Naive and Treated Patients With Schizophrenia
Abstract
Objective:This study examined whether subcortical volumes of the basal ganglia and thalamus in schizophrenic patients are related to neuroleptic exposure and symptom severity. Method:Basal ganglia substructures and thalamic volumes were measured with magnetic resonance imaging in 96 patients with schizophrenia (50 men and 46 women) and 128 healthy comparison subjects (60 men and 68 women). Twenty-one of the patients were neuroleptic-naive; of the 75 previously treated patients, 48 had received typical neuroleptics only, and 27 had received typical and atypical neuroleptics. The relation of volume measures to treatment status, exposure to neuroleptics, and symptoms was examined.Results:The neuroleptic-naive patients did not differ from the healthy comparison subjects in subcortical volumes except for lower thalamic volume. In the neuroleptic-naive group, volumes did not correlate with severity of negative symptoms, but higher volumes in both the thalamus and the putamen were associated with more severe positive symptoms. The previously treated group showed higher volumes in the putamen and globus pallidus than the healthy comparison subjects and the neuroleptic-naive patients. In the treated group, a higher dose of a typical neuroleptic was associated with higher caudate, putamen, and thalamus volumes, whereas a higher dose of an atypical neuroleptic was associated only with higher thalamic volume. Higher subcortical volumes were mildly associated with greater severity of both negative and positive symptoms. Conclusions:Increased subcortical volumes in treated schizophrenic patients seem to be medication-induced hypertrophy. This hypertrophy could reflect structural adaptation to receptor blockade and may moderate the effects of neuroleptic treatment. Am J Psychiatry 1998; 155: 1711-1717
Neuropathological and neuroimaging studies have examined cortical and subcortical aberrations in schizophrenia (1–6). The role of the basal ganglia-thalamocortical loop in modulating multiple functional domains has been substantiated in research on animals and humans (7–10). Interest in the potential role of basal ganglia pathology in schizophrenia has been spurred by the recognition that the basal ganglia regulate not only motor behavior but also aspects of cognitive and limbic behavior (11–13). Extensive connections of thalamic nuclei with cortical and subcortical regions buttress their role in gating the cerebral cortex (14), but few neuroanatomic studies in schizophrenia have examined the thalamus (1–4).
Magnetic resonance imaging (MRI) complements neuropathological investigations of brain structure. While most MRI studies of cortical structures have reported decreased volume in schizophrenic patients, some studies of the basal ganglia noted increased volume in the putamen, globus pallidus (6, 15, 16), and caudate (17). These studies included chronic patients treated with neuroleptics, which may be associated with striatal activation, neuronal hypertrophy, and synaptic adaptation (18,19). However, the association of early onset and lenticular hypertrophy has also been interpreted as supporting a neurodevelopmental model of schizophrenia (15), which attributes enlarged subcortical structures to decreased pruning (20). A longitudinal study of 29 first-episode patients and 10 comparison subjects, followed for 18 months, reported an increase in caudate volume in the patients relative to the comparison subjects (21). This was associated with younger age and higher exposure to neuroleptics before the study. In a study that used an image averaging technique (4), thalamic abnormalities were reported in 39 male patients—most of whom were treated with neuroleptics for several years—compared with 47 healthy men; consistent with other findings (22,23), the thalamus was smaller in the patients. An assessment of first-episode neuroleptic-naive patients would help clarify treatment effects.
To permit a comprehensive assessment of interconnected subcortical structures implicated in the pathophysiology of schizophrenia, we evaluated both basal ganglia regions and the thalamus. We compared a group of neuroleptic-naive patients with patients treated with typical and atypical neuroleptics, enabling an initial investigation of relations between volume, symptoms, and type of medication.
METHOD
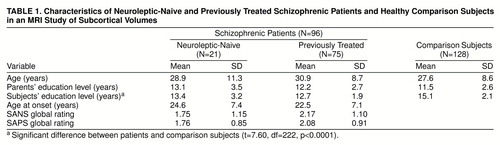
The study participants were 96 patients (54 inpatients and 42 outpatients) and 128 healthy comparison subjects from the schizophrenia Mental Health Clinical Research Center at the University of Pennsylvania. The patients had a DSM-IV diagnosis of schizophrenia (24) established by procedures detailed previously (25). Those with schizophreniform disorder at study entry met the criteria for schizophrenia at follow-up. The healthy comparison subjects also underwent standard evaluations (26, 27). There were 21 neuroleptic-naive patients (13 men and eight women) and 75 previously treated patients (37 men and 38 women). The groups did not differ in age or parental education, but as expected, the patients had a lower level of education (table 1). The mean ages at onset of illness for the neuroleptic-naive and previously treated patients were not significantly different. There were five, 11, and five left-handers in the neuroleptic-naive, previously treated, and healthy comparison groups, respectively. After complete description of the study, written informed consent was obtained from each subject.
Clinical Measures
Rating scales
Evaluations were conducted by trained investigators with established procedures (intraclass correlation coefficient [ICC] >0.85) (25). The patients’ symptoms were rated on the Scale for the Assessment of Negative Symptoms (SANS) (28) and the Scale for the Assessment of Positive Symptoms (SAPS) (29). The groups did not differ on the averaged global ratings of the SANS or the SAPS (table 1) and manifested mild symptoms.
Medications
A medication record documented for each subject the duration and doses of psychotropics before he or she entered research center protocols (30,31). Information from records, caregivers, and patients was updated at 6-month intervals. Therapeutic interventions were clinically based, starting with typical neuroleptics and introducing atypical neuroleptics as indicated. Compliance was assessed by monitoring ingestion, supply, and visits but not blood levels. Total lifetime dose was quantified in chlorpromazine-equivalent units in milligrams per kilogram of body weight (32).
Forty-eight patients had been treated with typical neuroleptics only (haloperidol, N=28; haloperidol decanoate, N=8; loxapine, N=6; thioridazine, N=8; molindone, N=3; thiothixene, N=12; fluphenazine, N=4; fluphenazine decanoate, N=4; trifluoperazine, N=9; perphenazine, N=7; chlorpromazine, N=8). The number of patients taking various medications exceeds 48 because patients had taken several medications over the course of their illness. The mean duration of treatment was 1307.2 days (SD=1375.9, range=2–5954), and the mean drug dose was 407.1 chlorpromazine-equivalent units per day (SD=25.3, range=65.9–1095.1). Twenty-two patients had been treated with typical and then atypical neuroleptics. The typical neuroleptics were haloperidol (N=20), haloperidol decanoate (N=1), loxapine (N=7), thioridazine (N=6), molindone (N=3), thiothixene (N=5), fluphenazine (N=7), fluphenazine decanoate (N=4), trifluoperazine (N=13), perphenazine (N=8), and chlorpromazine (N=7). The mean duration of treatment with typical neuroleptics was 1259.6 days (SD=1371.7, range=1–4238), and the mean dose was 720.4 chlorpromazine-equivalent units per day (SD=936.0, range=58.2–3723.5). The atypical neuroleptics included clozapine (N=15) and risperidone (N=14). The mean duration of treatment with the atypical neuroleptics was 383.4 days (SD=492.8, range=5–1601), and the mean dose was 334.1 chlorpromazine-equivalent units (SD=286.3, range=4.0–919.9). Five patients were treated only with an atypical neuroleptic, risperidone. The mean treatment duration was 70.4 days (SD=66.6, range=1–153), and the mean dose was 272.5 chlorpromazine-equivalent units (SD=90.6, range=150.0–400.0).
MRI Measurements
Acquisition
Scans were acquired on a GE Signa 1.5-T scanner (Milwaukee, Wis.) with uniform protocol and software. MRIs (spoiled GRASS pulse sequence, flip angle=35˚, TR=35 msec, TE=6 msec, field of view=24 cm, number of excitations=1) of 1-mm slice thickness were realigned into a standardized transaxial plane along the anterior commissure-posterior commissure axis. Three-dimensional display and cutting options derive sagittal and coronal images perpendicular to these transaxial slices without affecting image quality for purposes of region drawing.
Volumetric measures
A segmentation algorithm (33,34) used values of pixels within operator-defined regions of interest, and volumetric calculations in milliliters for the caudate, putamen, globus pallidus, and thalamus were performed. The borders of the structures were drawn by two investigators (P.D.M. and V.M.) on the basis of a neuroanatomy atlas and input from a neuroradiologist according to procedures standardized in our laboratory. The reliability (ICC) for 10 random cases (five patients and five comparison subjects) analyzed independently, without previous exposure to these scans, was as follows: for the caudate, 0.98; putamen, 0.99; globus pallidus, 0.94; thalamus, 0.99. The scans were blinded and mixed, and all analysis was completed by one researcher (V.M.).
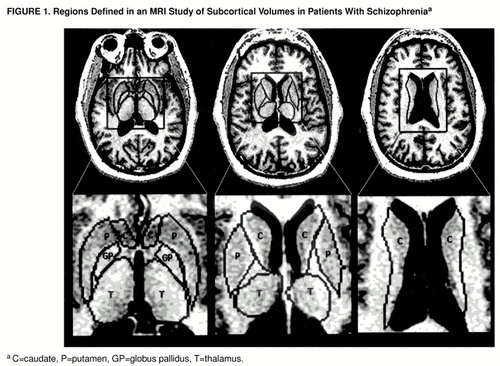
The procedure of placing the regions of interest began by displaying the transaxial images at a magnification factor of 0.89 of actual size. Operators could enlarge scans 16 or more times to view pixels distinctly around small structures such as the thalamostriate vein, kept outside the caudate. The delineation between the putamen and the globus pallidus and the boundaries for the thalamus were clearer on axial than on coronal images. Boundaries were drawn around the head and body of the caudate nucleus, the putamen, the globus pallidus, and the thalamus on full gray scale images. After the segmentation algorithm was allowed to find the true edge of each nucleus, the lines were drawn at least two pixels from the gray matter edges of the nuclei in the white matter tracts surrounding them (figure 1). The head of the caudate was defined in the transaxial plane as the mass of gray matter comprising the lateral walls of the lateral ventricles bounded inferolaterally by the anterior limb of the internal capsule and superolaterally by the external capsule. Region placement began inferiorly when the operator could see the most inferior aspect of the third ventricle and when the chiasmatic cistern was no longer visible, just above the amygdala. The boundary for the head of the caudate continued superiorly until the thalamus could no longer be visualized, and the anterior horn of the lateral ventricles became confluent with the posterior horn. The body of the caudate was defined as the portion above the thalamus after the confluence of the anterior and posterior horns of the lateral ventricles. The nucleus accumbens was included as caudate. The lenticular nucleus was defined as the gray matter bounded by the internal and external capsules. The boundary between the putamen and the globus pallidus was determined by two methods. First, when possible, a strip of white matter was identified between the crisscrossing by fingers of gray matter between the two regions; second, the boundary was noted by the difference in color between the two structures, since the putamen always appeared darker with this acquisition protocol. Boundaries for the globus pallidus began inferiorly at the level of the third ventricle. They extended superiorly until no more gray matter pixels medial to the boundary for the putamen could be detected. Region tracing for the putamen extended superiorly until the thalamus disappeared and the body of the caudate became continuous with the tail. The thalamus was defined as the portion of gray matter bounded medially and posteriorly by the walls of the third ventricle, laterally by the internal capsule, and anteriorly by the fornix and genu of the internal capsule. Region placement began inferiorly above the inferior colliculi when the posterior commissure was no longer visible and ended when the third ventricle merged with the posterior horns and the caudate body appeared. A switch from the full gray scale display to a segmentation map was used to verify that no more gray matter pixels were present when a specific region was no longer identified on the nonsegmented MRI.
Data Analysis
The volumes of the caudate, putamen, globus pallidus, and thalamus were the dependent measures in a group (neuroleptic-naive patients, previously treated patients, healthy comparison subjects)-by-region multivariate analysis of covariance (MANCOVA), with cranial volume as a covariate. Use of this covariate is necessitated by the differences in cranial volume between the sexes and between diagnostic groups. Significant interactions between group and region were decomposed by contrasting each patient subgroup with the healthy comparison group by means of univariate ANCOVAs for each region. The association of volume with medication dose and with treatment duration was examined by correlating volumes with total lifetime dose in chlorpromazine-equivalent units and days of treatment. There were seven patients for whom dose was unavailable for some epochs; they were excluded from the correlational analysis. Because of the sample size, the group of previously treated patients was subdivided for the correlational analysis into 1) the patients treated with typical neuroleptics only (N=44) and 2) the patients treated with typical followed by atypical neuroleptics (N=19) combined with the patients treated with atypical neuroleptics only (N=5). Of the seven patients with missing data, four took typical neuroleptics only, and three were from the combined group. We repeated the analysis including the subjects with missing data by using an estimated average daily dose or excluding missing epochs. The correlations between dose and volume were similar with all approaches, and so we report here the results of the more conservative elimination of subjects with missing data.
RESULTS
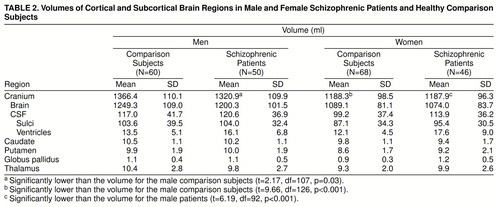
The volumes of brain compartments and subcortical regions are presented in table 2. Cranial volume was lower in the male patients than in the healthy comparison men; among the women it was lower relative to the men in both the patients and the healthy comparison subjects.
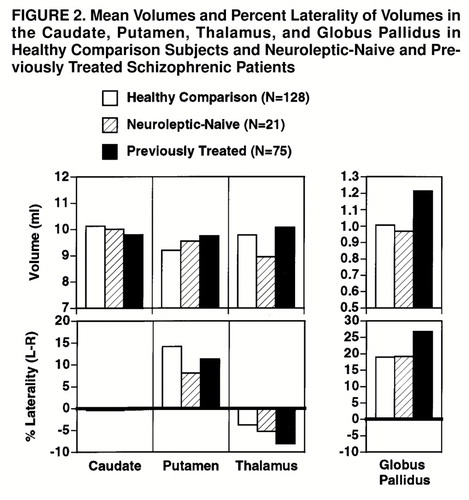
The MANCOVAs comparing patient subgroups (neuroleptic-naive and previously treated patients) with healthy comparison subjects on the four subcortical regions showed a main effect of group (Hotelling-Lawley trace T=0.17; F=2.26, df=16, 424, p=0.003), a main effect of region (T=0.17; F=12.15, df=3, 218, p<0.0001), and a group-by-region interaction (T=0.09; F=3.19, df=6, 434, p=0.004). There was a hemisphere-by-region interaction (T=0.04; F=2.83, df=3, 218, p=0.04) and a group-by-hemisphere-by-region interaction (T=0.06; F=2.11, df=6, 434, p=0.05). The follow-up MANCOVAs comparing the neuroleptic-naive patients with the healthy subjects on the significant interactions showed only a marginal group-by-region interaction (T=0.05; F=2.50, df=3, 144, p=0.06). The group-by-hemisphere-by-region interaction was not significant. On the other hand, the MANCOVA contrasting the previously treated patients with the healthy comparison subjects showed both a group-by-region interaction (T=0.07; F=4.52, df=3, 198, p=0.004) and a group-by-hemisphere-by-region interaction (T=0.06; F=4.00, df=3, 198, p=0.008). These effects are illustrated in figure 2. As can be seen, the neuroleptic-naive group did not differ from the healthy comparison group except for a trend for lower thalamic volume (F=3.08, df=1, 148, p=0.08). On the other hand, the previously treated group showed higher volumes for the putamen (F=4.86, df=1, 202, p=0.03) and globus pallidus (F=12.58, df=1, 202, p=0.0005) (upper graphs of figure 2). The interaction with hemisphere reflects the increased left hemispheric globus pallidus volume in treated patients (lower rightmost graph).
Correlations With Medication Dose
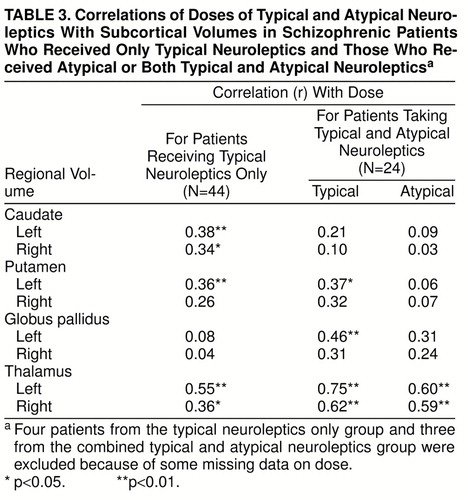
The correlations of subcortical volumes with total lifetime medication dose in chlorpromazine-equivalent units are shown in table 3. For patients treated with typical neuroleptics only, higher dose was associated with bilaterally higher caudate and thalamic volumes and higher left putamen volume. For the patients treated with typical and atypical neuroleptics, a higher dose of a typical neuroleptic was associated with bilaterally higher volume of the thalamus and higher volume of the left putamen and globus pallidus. Only thalamic volume was correlated with dose of atypical neuroleptics. The correlations with duration of treatment were similar but lower. Partial correlations, when age, age at onset, and duration of illness were removed, remained significant.
Correlations With Severity of Symptoms
The correlations of subcortical volumes with severity of global positive and negative symptoms were generally positive: higher volumes were associated with greater severity. For the neuroleptic-naive group, subcortical volumes were not correlated with severity of negative symptoms, but higher volumes of the thalamus and putamen were associated with more severe positive symptoms (r=0.50, df=19, p=0.02, and r=0.53, df=19, p=0.01, respectively). This association was evident for hallucinations (caudate r=0.44, df=19, p=0.04; putamen r=0.58, df=19, p<0.01; thalamus r=0.45, df=19, p=0.04) and bizarre behavior (putamen r=0.51, df=19, p=0.01). For previously treated patients, higher subcortical volumes were associated with greater severity of both negative and positive symptoms. These correlations were small but significant for negative symptoms with volumes of the caudate (r=0.29, df=73, p=0.01) and putamen (r=0.20, df=73, p=0.05) and for positive symptoms with the putamen (r=0.23, df=73, p=0.02) and globus pallidus (r=0.22, df=73, p=0.05). Examination of subcategories of symptoms did not point to more specific links. These correlations were not attenuated by removing medication dose, duration of treatment, current age, age at onset, or duration of illness in partial correlations.
DISCUSSION
This study may help address the origins of subcortical hypertrophy reported in patients with schizophrenia by comparing patients never exposed to neuroleptics with treated patients. Differences between groups and correlations between subcortical volumes and dose of medication indicate that exposure to neuroleptics is associated with hypertrophy. The only region that differed between healthy comparison subjects and neuroleptic-naive patients was the thalamus, which was smaller in the patients. While this effect was only marginal in the present study according to a two-tailed test, it does replicate earlier findings of reduced thalamic volume in schizophrenia (4, 22, 23). Thus, there is some convergence of evidence from neuropathological and neuroimaging studies that suggests thalamic abnormalities in schizophrenia (1–4). This could provide neurobiological substrates for a range of behavioral deficits related to gating that are associated with thalamic and thalamocortical circuitry (35, 36).
Across subcortical regions, with the exception of the caudate, it appears that patients treated with neuroleptics show hypertrophy relative to their neuroleptic-naive counterparts and to healthy comparison subjects. The suggestion that increased subcortical volume is related to exposure to neuroleptics is further strengthened by the positive correlations between medication dose and volumes. Note that for patients treated with typical neuroleptics only, correlations were evident also in the caudate. Little is known from neuroimaging research about the effects of neuroleptics on brain volume. There are preliminary data suggesting that antipsychotics may be related to volume changes in both subcortical regions (21, 37, 38) and cortical regions (31). DeLisi et al. (38) observed larger caudate and lenticular nuclei volumes in chronic patients than in first-episode patients. In a longitudinal study, Chakos et al. (21) reported a 5.7% increase in caudate nuclei in first-episode patients taking typical neuroleptics. Reversal of caudate volume increase was seen in patients who were switched to clozapine in comparison with those who continued to take typical neuroleptics (37). In a longitudinal design, we found that in first-episode patients, a greater rate of reduction in frontal and temporal lobe volumes was associated with improvement of delusions and thought disorder and a higher dose of typical neuroleptics (31). It is noteworthy that in the present study, the dose of atypical neuroleptics is associated with bilaterally higher volumes only in the thalamus. This perhaps is related to differences in mode of action.
Morphometric MRI studies that examined cortical regions of interest have generally reported an association between decreased parenchymal volume and greater symptom severity (39,40). We found small but consistently positive correlations between subcortical volumes and severity of both positive and negative symptoms. This further supports the possibility that the hypertrophy associated with neuroleptic exposure reflects adaptive up-regulation of the occupancy of dopamine receptors (18, 19, 21), with concomitant persistence of symptoms. Indeed, as we see in the neuroleptic-naive group, before intervention with neuroleptics, higher subcortical volumes are quite specifically related to more severe positive symptoms, such as hallucinations and bizarre behavior. In patients treated with neuroleptics, this association, while attenuated, is generalized to both positive and negative symptoms. Thus, larger subcortical volumes portend more severe symptoms regardless of whether these volumes reflect endogenous processes or the effects of treatment.
Our results also suggest that the increase in volume is more pronounced in the left globus pallidus, and the correlations are consistently higher for left hemispheric subcortical regions. Lateralized abnormalities have been implicated in schizophrenia in some structural and functional neuroimaging studies as well as in postmortem studies (1, 31, 41). This supports hypotheses of lateralized brain dysfunction in schizophrenia (42).
While we have observed substantial effects of neuroleptic exposure and dose, we should caution against interpreting all of the differences between the neuroleptic-naive and treated groups as demonstrating medication effects. Although we attempted to control for variables that could conceivably influence volume measures, the attribution of volume differences to medication must await longitudinal study. Such studies could also address more powerfully the relation between volume changes and response to treatment (21,31). However, our results can rule out an explanation of subcortical hypertrophy as reflecting purely a lack of neuronal pruning as part of a neurodevelopmental aberration (15, 20). Medication type and dose also need scrutiny (37). Similarly, further parceling of brain regions will permit assessment of the reciprocity between cortical and subcortical anomalies.
Neuroanatomic studies have implicated multiple brain regions and their connecting circuitry; this may underlie the pervasive deficits evident in schizophrenia. While there are some inconsistencies in MRI structural studies of subcortical regions, most report either increased volume of basal ganglia structures in schizophrenic subjects or no difference from the structures of healthy people. There are few studies of the thalamus, and they suggest decreased volume in schizophrenic subjects. The critical role of neuroleptic intervention by modulating neurotransmitters needs to be addressed in neuroanatomic studies that use large study groups with controlled intervention. This study was limited by the lack of prospective therapeutic intervention with specific medications. However, the results encourage further integration of anatomic and clinical data with neurocognitive and functional neuroimaging.
Received Feb. 11, 1998; revision received June 29, 1998; accepted July 7, 1998. From the Mental Health Clinical Research Center, Neuropsychiatry Section, Department of Psychiatry, University of Pennsylvania School of Medicine. Address reprint requests to Dr. Raquel E. Gur, Neuropsychiatry Section, University of Pennsylvania Medical Center, 10th Floor, Gates Bldg., Philadelphia, PA 19104. Supported by grants MH-42191, MH-43880, and MH-01336 from NIMH and grant RR-00040 from NIH.
 |
 |
 |
1. Heckers S: Neuropathology of schizophrenia: cortex, thalamus, basal ganglia, and neurotransmitter specific projection systems. Schizophr Bull 1997; 23:403–421Crossref, Medline, Google Scholar
2. Jones EG: Cortical development and thalamic pathology in schizophrenia. Schizophr Bull 1997; 23:483–501Crossref, Medline, Google Scholar
3. Pakkenberg B: Pronounced reduction of total neuron number in mediolateral thalamic nucleus and nucleus accumbens in schizophrenia. Arch Gen Psychiatry 1990; 47:1023–1028Crossref, Medline, Google Scholar
4. Andreasen NC, Arndt S, Swayze V II, Cizadlo T, Flaum M, O"Leary D, Ehrhardt JC, Yuh WTC: Thalamic abnormalities in schizophrenia visualized through magnetic resonance image averaging. Science 1994; 266:294–298Crossref, Medline, Google Scholar
5. Buchsbaum MS, Someya T, Teng CY, Abel L, Chin S, Najafi A, Haier RJ, Wu J, Bunney WE Jr: PET and MRI of the thalamus in never-medicated patients with schizophrenia. Am J Psychiatry 1996; 153:191–199Link, Google Scholar
6. Hokama H, Shenton ME, Nestor PG, Kikinis R, Levitt JJ, Metcalf D, Wible CG, O’Donnell BF, Jolesz FA, McCarley RW: Caudate, putamen, and globus pallidus volume in schizophrenia: a quantitative MRI study. Psychiatry Res 1995; 61:209–229Crossref, Medline, Google Scholar
7. Alexander GE, Crutcher MD: Functional architecture of basal ganglia circuits: neural substrates of parallel processing. Trends Neurosci 1990; 13:266–271Crossref, Medline, Google Scholar
8. Parent A, Hazrati LN: Functional anatomy of the basal ganglia, I: the cortico-basal ganglia-thalamo-cortical loop. Brain Res Brain Res Rev 1995; 20:91–127Crossref, Medline, Google Scholar
9. Parent A, Hazrati LN: Functional anatomy of the basal ganglia, II: the place of subthalamic nucleus and external pallidum in basal ganglia circuitry. Brain Res Brain Res Rev 1995; 20:128–154Crossref, Medline, Google Scholar
10. Joel D, Weiner I: The connections of the primate subthalamic nucleus: indirect pathways and the open-interconnected scheme of basal ganglia-thalamocortical circuitry. Brain Res Brain Res Rev 1997; 23:62–78Crossref, Medline, Google Scholar
11. Graybiel AM: The basal ganglia and cognitive pattern generators. Schizophr Bull 1997; 23:459–469Crossref, Medline, Google Scholar
12. Saint-Cyr JA, Taylor AE, Nicholson K: Behavior and the basal ganglia. Adv Neurol 1995; 65:1–28Medline, Google Scholar
13. Carlsson M, Carlsson A: Interactions between glutaminergic and monoaminergic systems within the basal ganglia—implications for schizophrenia and Parkinson’s disease. Trends Neurosci 1990; 13:272–276Crossref, Medline, Google Scholar
14. Jones EG: The Thalamus. New York, Plenum, 1985Google Scholar
15. Jernigan TL, Zisook S, Heaton RK, Moranville JT, Hesselink JR, Braff DL: Magnetic resonance imaging abnormalities in lenticular nuclei and cerebral cortex in schizophrenia. Arch Gen Psychiatry 1991; 48:881–890Crossref, Medline, Google Scholar
16. Elkashef AM, Buchanan RW, Gellad F, Munson RC, Breier A: Basal ganglia pathology in schizophrenia and tardive dyskinesia: an MRI quantitative study. Am J Psychiatry 1994; 151:752–755Link, Google Scholar
17. Breier A, Buchanan RW, Elkashef A, Munson RC, Kirkpatrick B, Gellad F: Brain morphology and schizophrenia: a magnetic resonance imaging study of limbic, prefrontal cortex, and caudate structures. Arch Gen Psychiatry 1992; 49:921–926Crossref, Medline, Google Scholar
18. Lieberman JA, Sheitman BB, Kinon BJ: Neurochemical sensitization in the pathophysiology of schizophrenia: deficits and dysfunction in neuronal regulation and plasticity. Neuropsychopharmacology 1997; 17:205–229Crossref, Medline, Google Scholar
19. Benes FM, Paskevich PA, Davidson J, Domesick VB: The effects of haloperidol on synaptic patterns in the rat striatum. Brain Res 1985; 329:265–273Crossref, Medline, Google Scholar
20. Feinberg I: Schizophrenia: caused by a fault in programmed synaptic elimination during adolescence? J Psychiatr Res 1983; 17:319–334Google Scholar
21. Chakos MH, Lieberman JA, Bilder RM, Borenstein M, Lerner G, Bogerts B, Wu H, Kinon B, Ashtari M: Increase in caudate nuclei volumes of first-episode schizophrenic patients taking antipsychotic drugs. Am J Psychiatry 1994; 151:1430–1436Link, Google Scholar
22. Andreasen NC, Ehrhardt JC, Swayze VW II, Alliger RJ, Yuh WT, Cohen G, Ziebell S: Magnetic resonance imaging of the brain in schizophrenia: the pathophysiologic significance of structural abnormalities. Arch Gen Psychiatry 1990; 47:35–44Crossref, Medline, Google Scholar
23. Flaum M, Swayze VW II, O"Leary DS, Yuh WTC, Ehrhardt JC, Arndt SV, Andreasen NC: Effects of diagnosis, laterality, and gender on brain morphology in schizophrenia. Am J Psychiatry 1995; 152:704–714Link, Google Scholar
24. Spitzer RL, Williams JBW, Gibbon M, First MB: Structured Clinical Interview for DSM-III-R—Patient Version (SCID-P). New York, New York State Psychiatric Institute, Biometrics Research, 1989Google Scholar
25. Gur RE, Mozley PD, Resnick SM, Levick S, Erwin R, Saykin AJ, Gur RC: Relations among clinical scales in schizophrenia. Am J Psychiatry 1991; 148:472–478Link, Google Scholar
26. Shtasel DL, Gur RE, Mozley PD, Richards J, Taleff MM, Heimberg C, Gallacher F, Gur RC: Volunteers for biomedical research: recruitment and screening of normal controls. Arch Gen Psychiatry 1991; 48:1022–1025Crossref, Medline, Google Scholar
27. Spitzer RL, Williams JBW, Gibbon M, First MB: Structured Clinical Interview for DSM-III-R—Non-Patient Version (SCID-NP). New York, New York State Psychiatric Institute, Biometrics Research, 1989Google Scholar
28. Andreasen NC: Scale for the Assessment of Negative Symptoms (SANS). Iowa City, University of Iowa, 1984Google Scholar
29. Andreasen NC: Scale for the Assessment of Positive Symptoms (SAPS). Iowa City, University of Iowa, 1984Google Scholar
30. Szymanski SR, Cannon TD, Gallacher F, Erwin RJ, Gur RE: The course of treatment response in first-episode and chronic schizophrenia. Am J Psychiatry 1996; 153:519–525Link, Google Scholar
31. Gur RE, Cowell P, Turetsky BI, Gallacher F, Cannon T, Bilker W, Gur RC: A follow-up magnetic resonance imaging study of schizophrenia: relationship of neuroanatomical changes to clinical and neurobehavioral measures. Arch Gen Psychiatry 1998; 55:145–152Crossref, Medline, Google Scholar
32. Kaplan HI, Sadock BJ: Synopsis of Psychiatry, 6th ed. Baltimore, Williams & Wilkins, 1992, p 639Google Scholar
33. Yan MXH, Karp JS: Segmentation of 3D MR using an adaptive K-means clustering algorithm. Proceedings of the IEEE Medical Imaging Conference 1994; 4:1529–1533Google Scholar
34. Yan MXH, Karp JS: An adaptive Bayesian approach to three-dimensional MR brain segmentation algorithm, in Information Processing in Medical Imaging. Edited by Bizais Y, Barillot C, DiPaol R. Dordrecht, The Netherlands, Kluwer Academic, 1995, pp 201–213Google Scholar
35. Swerdlow NR, Koob GF: Dopamine, schizophrenia, mania and depression: toward a unified hypothesis of cortico-striato-pallido-thalamic function. Behavioral and Brain Sciences 1987; 10:197–245Crossref, Google Scholar
36. Braff DL: Information processing and attention dysfunctions in schizophrenia. Schizophr Bull 1993; 17:233–259Crossref, Google Scholar
37. Chakos MH, Lieberman JA, Alvir J, Bilder RM, Ashtari M: Caudate nuclei volumes in schizophrenic patients treated with typical antipsychotics or clozapine (letter). Lancet 1995; 345:456–457Crossref, Medline, Google Scholar
38. DeLisi LE, Hoff LA, Schwartz JE, Shields GW, Halthore SN, Simhadri MG, Henn FA, Anand AK: Brain morphology in first-episode schizophrenic-like psychotic patients: a quantitative magnetic resonance imaging study. Biol Psychiatry 1991; 29:159–175Crossref, Medline, Google Scholar
39. Barta PE, Pearlson GD, Powers RE, Richards SS, Tune LE: Auditory hallucinations and smaller superior temporal gyrus volume in schizophrenia. Am J Psychiatry 1990; 147:1457–1462Link, Google Scholar
40. Shenton ME, Kikinis R, Jolesz FA, Pollak SD, LeMay M, Wible CG, Hokama H, Martin J, Metcalf D, Coleman M, McCarley RW: Abnormalities of the left temporal lobe and thought disorder in schizophrenia: a quantitative magnetic resonance imaging study. N Engl J Med 1992; 327:604–612Crossref, Medline, Google Scholar
41. Farde L, Wiesel FA, Stone-Elander S, Halldin C, Nordstrom AL, Hall H, Sedvall G: D2 dopamine receptors in neuroleptic-naive schizophrenic patients: a positron emission tomography study with [11C]raclopride. Arch Gen Psychiatry 1990; 47:213–219Crossref, Medline, Google Scholar
42. Gur RE: Is schizophrenia a lateralized brain disorder? Schizophr Bull (in press)Google Scholar