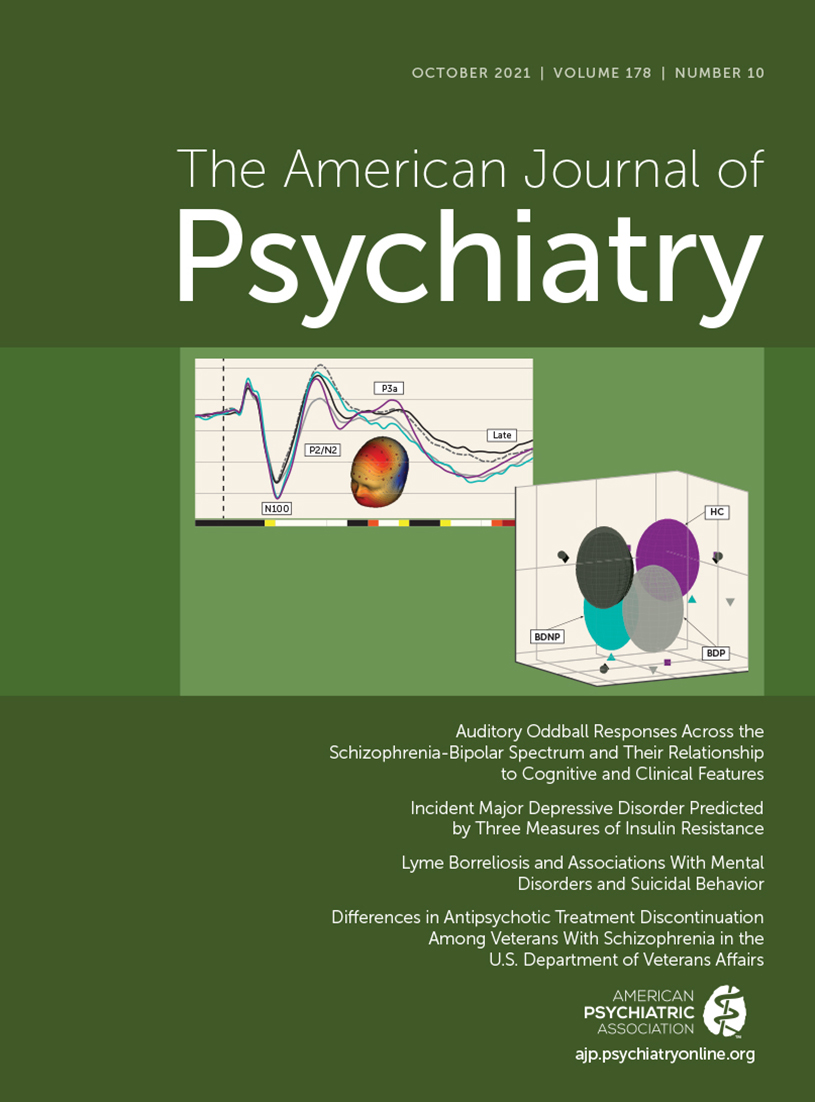
Auditory Oddball Responses Across the Schizophrenia-Bipolar Spectrum and Their Relationship to Cognitive and Clinical Features
Abstract
Objective:
Neural activations during auditory oddball tasks may be endophenotypes for psychosis and bipolar disorder. The authors investigated oddball neural deviations that discriminate multiple diagnostic groups across the schizophrenia-bipolar spectrum (schizophrenia, schizoaffective disorder, psychotic bipolar disorder, and nonpsychotic bipolar disorder) and clarified their relationship to clinical and cognitive features.
Methods:
Auditory oddball responses to standard and target tones from 64 sensor EEG recordings were compared across patients with psychosis (total N=597; schizophrenia, N=225; schizoaffective disorder, N=201; bipolar disorder with psychosis, N=171), patients with bipolar disorder without psychosis (N=66), and healthy comparison subjects (N=415) from the second iteration of the Bipolar-Schizophrenia Network for Intermediate Phenotypes (B-SNIP2) study. EEG activity was analyzed in voltage and in the time-frequency domain (low, beta, and gamma bands). Event-related potentials (ERPs) were compared with those from an independent sample collected during the first iteration of B-SNIP (B-SNIP1; healthy subjects, N=211; psychosis group, N=526) to establish the repeatability of complex oddball ERPs across multiple psychosis syndromes (r values >0.94 between B-SNIP1 and B-SNIP2).
Results:
Twenty-six EEG features differentiated the groups; they were used in discriminant and correlational analyses. EEG variables from the N100, P300, and low-frequency ranges separated the groups along a diagnostic continuum from healthy to bipolar disorder with psychosis/bipolar disorder without psychosis to schizoaffective disorder/schizophrenia and were strongly related to general cognitive function (r=0.91). P50 responses to standard trials and early beta/gamma frequency responses separated the bipolar disorder without psychosis group from the bipolar disorder with psychosis group. P200, N200, and late beta/gamma frequency responses separated the two bipolar disorder groups from the other groups.
Conclusions:
Neural deviations during auditory processing are related to psychosis history and bipolar disorder. There is a powerful transdiagnostic relationship between severity of these neural deviations and general cognitive performance. These results have implications for understanding the neurobiology of clinical syndromes across the schizophrenia-bipolar spectrum that may have an impact on future biomarker research.
Auditory event-related potentials (ERPs) during an oddball task index sensory registration and information-processing deficits in psychiatric syndromes (1–6). In this study, we comprehensively investigated auditory oddball ERPs and event-related oscillations in a large transdiagnostic sample spanning schizophrenia-bipolar syndromes to clarify how deficits relate to diagnosis, symptoms, and sociocognitive functioning. This approach yields biomarkers suitable as therapeutic targets for clinical and neurocognitive interventions and translational research.
The oddball task has frequent standard trials (80% of trials) and infrequent target trials (20% of trials) to which participants respond with a button press (7). Most studies quantify the P300 (or P3b) ERP occurring in response to target tones to be around 300–600 ms poststimulus. Diminished-amplitude P300 ERPs are among the most replicated laboratory phenotypes for psychosis, supporting their biomarker potential for both schizophrenia (1, 8, 9) and bipolar I disorder (6). P300 has a parietal cortex peak that reflects widespread synchronization from distributed cortical and subcortical sources, dorsal and ventral frontoparietal networks, and temporal regions (10–12). P300 is associated with attention, novelty/salience detection, and working memory mechanisms and is modulated by norepinephrine and dopamine systems (10, 13, 14). P300 genetics suggest involvement of neurodevelopmental circuits implicated in psychosis and affective syndrome etiology (15–17) and shared genetic contributions between schizophrenia (15) and bipolar disorder (18, 19). P300 may predict risk for conversion to psychosis (20, 21), and reduced P300 amplitudes may be a stable biological indicator of poor outcomes and severe negative symptoms (22). Associations with risk and poor outcome may relate to P300’s association with cognition (23–27), especially working memory (10, 28, 29). Neurocognitive deficits are among the most important features of psychosis syndromes (30), and they predict functional outcomes (31). At present, the extent to which psychosis mediates P300 deviations in bipolar disorder is unclear (6, 32, 33). Individuals with schizoaffective disorder may have P300 values intermediate to schizophrenia and bipolar disorder (34, 35); however, few studies have addressed this question.
Additional ERP measures can be obtained from oddball paradigm standard and target trials beyond the P300 ERP. ERP components such as the P50, N100, P200, and P3a-like are identifiable in response to standard and target tones topographically centered over the frontal lobe (1, 36). They are primarily generated by cortical neuronal ensembles in the auditory cortex, reflect early thalamocortical communication and primary to secondary cortical communication, and have been linked to nicotinic acetylcholine, GABAergic, and N-methyl-d-aspartate (NMDA) receptor functioning (37, 38) and to genetics implicated in the etiology of psychosis and affective syndromes (16, 39). Inclusion of event-related oscillations can provide complex insights into cortical dysfunction beyond voltage responses that are useful for translational biomarker and genetic targets (1, 37, 40–42).
In this study, from the Bipolar-Schizophrenia Network for Intermediate Phenotypes 2 [B-SNIP2] study, we used a new psychosis sample (N=597) to replicate previous findings from the B-SNIP1 study. In the B-SNIP1 study, the auditory oddball responses of more than 400 patients with schizophrenia or bipolar disorder with psychosis and 440 of their first-degree relatives were compared with the responses of 284 healthy persons (1). To evaluate whether psychosis history mediates auditory oddball responses in bipolar disorder, we included a group of patients with nonpsychotic bipolar disorder (N=66). Guided by previous research, we evaluated the repeatability of auditory oddball ERP findings across the psychosis spectrum (see also Turetsky et al. [8]); the transdiagnostic distributions of auditory oddball responses across psychosis syndromes; a dimensional relationship between cognitive functioning, negative symptoms, and social functioning; and the possibility that auditory oddball responses are useful biomarkers of a psychosis severity dimension, distinct from differences between bipolar disorder with and without psychosis (32, 33, 43, 44).
METHODS
Recruitment
Participants (total N=1,078) were recruited from three Psychosis and Affective Research Domains and Intermediate Phenotypes (PARDIP) sites and five B-SNIP2 consortium sites (three of which were also PARDIP sites) using previously published approaches (for details, see Tamminga et al. [45] and the Methods section in the online supplement). Healthy persons (N=415) were free of any lifetime psychotic disorder or chronic mood disorder and of a family history of psychosis or bipolar disorder in first-degree relatives. Patients were grouped according to their DSM-IV-TR (46) diagnosis of schizophrenia (N=225), schizoaffective disorder (N=201), or bipolar disorder with a history of psychosis (N=171) or with no history of psychosis (N=66). Because patients were recruited from ongoing studies and have not been classified using the Clementz et al. (35) biotypes methods, they were analyzed using only their DSM diagnoses. This study was approved by the institutional review boards of each consortium site, and written informed consent was obtained before participation. Participants’ demographic characteristics and clinical ratings are presented in Table 1.
| Group | Analysis | |||||||||||||
|---|---|---|---|---|---|---|---|---|---|---|---|---|---|---|
| Characteristic | Healthy Comparison (N=415) | Bipolar I Disorder Without Psychotic Features (N=66) | Bipolar I Disorder With Psychotic Features (N=171) | Schizoaffective Disorder (N=201) | Schizophrenia (N=225) | Test | df | p | Post Hoc Tukey’s B | |||||
| N | % | N | % | N | % | N | % | N | % | χ2 | df | p | ||
| Sex | 31.7 | 4 | <0.001 | |||||||||||
| Male | 178 | 43 | 19 | 29 | 78 | 46 | 91 | 45 | 139 | 62 | ||||
| Female | 137 | 57 | 47 | 71 | 93 | 54 | 110 | 55 | 86 | 38 | ||||
| Mean | SD | Mean | SD | Mean | SD | Mean | SD | Mean | SD | F | df | p | ||
| Age (years) | 34.74 | 12.5 | 40.39 | 12.16 | 37.2 | 11.72 | 40.32 | 10.98 | 40.03 | 11.66 | 11.89 | 4, 1073 | <0.001 | |
| N | % | N | % | N | % | N | % | N | % | χ2 | df | p | ||
| Site | 99.27 | 16 | <0.001 | |||||||||||
| Boston | 40 | 29.9 | 25 | 33.8 | 15 | 25 | 15 | 25 | 15 | 25 | ||||
| Chicago | 55 | 41 | 29 | 39.2 | 26 | 43.3 | 26 | 43.3 | 26 | 43.3 | ||||
| Dallas | 7 | 5.2 | 4 | 5.4 | 3 | 5 | 3 | 5 | 3 | 5 | ||||
| Georgia | 21 | 15.7 | 9 | 12.2 | 12 | 20 | 12 | 20 | 12 | 20 | ||||
| Hartford | 11 | 8.2 | 7 | 9.5 | 4 | 6.7 | 4 | 6.7 | 4 | 6.7 | ||||
| Ethnicity | 4.64 | 4 | 0.33 | |||||||||||
| Hispanic | 53 | 13 | 9 | 14 | 32 | 19 | 32 | 16 | 27 | 12 | ||||
| Non-Hispanic | 353 | 87 | 57 | 86 | 138 | 81 | 167 | 84 | 194 | 88 | ||||
| Race | 112.87 | 28 | <0.001 | |||||||||||
| Black or African American | 113 | 28 | 14 | 21 | 44 | 26 | 77 | 39 | 118 | 53 | ||||
| American Indian | 1 | 0 | 0 | 0 | 1 | 1 | 1 | 1 | 2 | 1 | ||||
| Asian | 33 | 8 | 0 | 0 | 1 | 1 | 8 | 4 | 10 | 5 | ||||
| White or Caucasian | 227 | 56 | 45 | 68 | 108 | 64 | 84 | 42 | 66 | 30 | ||||
| Native Hawaiian | 1 | 0 | 1 | 2 | 0 | 0 | 0 | 0 | 0 | 0 | ||||
| Multiracial | 18 | 4 | 4 | 6 | 10 | 6 | 22 | 11 | 16 | 7 | ||||
| Other/ unknown | 14 | 3 | 2 | 3 | 6 | 4 | 8 | 4 | 10 | 5 | ||||
| Mean | SD | Mean | SD | Mean | SD | Mean | SD | Mean | SD | F | df | p | ||
| Illness duration (years) | NA | NA | 23.98 | 12.48 | 19.04 | 12.51 | 23.16 | 12.48 | 21.02 | 11.87 | 4.31 | 3, 621 | 0.01 | BDP/SZ < SZ/SAD/BDNP |
| Years of formal educationb | 15.29 | 2.29 | 14.31 | 3.12 | 14.5 | 2.41 | 13.31 | 2.26 | 12.84 | 2.33 | 46.59 | 4, 1033 | <0.001 | SZ/SAD < BDNP/BDP < HC |
| 17.46 | 3, 635 | <0.001 | ||||||||||||
| Number of trials in each waveform average | ||||||||||||||
| Standard | 542 | 41.77 | 545 | 32.68 | 540 | 42.88 | 533 | 48.39 | 534 | 46.77 | 2.43 | 4, 1073 | 0.05 | n.s. |
| Target | 96 | 6.91 | 94 | 8.92 | 95 | 7.95 | 94 | 8.92 | 94 | 8.89 | 2.66 | 4, 1074 | 0.03 | n.s. |
| GAF scaleb | 83.42 | 6.61 | 57.88 | 11.4 | 56.73 | 13.47 | 53.26 | 11.15 | 50.51 | 11.54 | 456.38 | 4, 942 | <0.001 | SZ/SAD < BDP/BDNP < HC |
| 10.84 | 3, 606 | <0.001 | ||||||||||||
| Birchwood Social Functioning Scaleb | 154.15 | 17.34 | 130.15 | 20.41 | 131.11 | 23.65 | 116.78 | 22.93 | 117.33 | 21.32 | 158.54 | 4, 985 | <0.001 | SAD/SZ < BDNP/BDP < HC |
| 17.82 | 3, 605 | <0.001 | ||||||||||||
| BACSb verbal memory score | –0.29 | 1.15 | –1.21 | 1.31 | –0.77 | 1.32 | –1.36 | 1.33 | –1.5 | 1.32 | 41.94 | 4, 1008 | <0.001 | SZ/SAD/BDNP < BDP < HC |
| 10.64 | 3, 643 | <0.001 | ||||||||||||
| BACS digit sequencing score | –0.33 | 1.01 | –0.64 | 1.13 | –0.68 | 1.17 | –0.97 | 1.04 | –1.33 | 1.18 | 31.93 | 4, 1007 | <0.001 | SZ < SAD/BDP < BDP/BDNP < HC |
| 12.98 | 3, 642 | <0.001 | ||||||||||||
| BACS token motor score | –0.62 | 1.15 | –0.97 | 1.17 | –1.35 | 1.03 | –1.41 | 1.09 | –1.62 | 1.17 | 33.68 | 4, 986 | <0.001 | SZ/SAD/BDP < BDNP < HC |
| 5.77 | 3, 623 | 0.001 | ||||||||||||
| BACS verbal fluency score | 0.13 | 1.16 | –0.31 | 1.25 | –0.3 | 1.07 | –0.58 | 1.08 | –0.71 | 1.17 | 23.49 | 4, 1006 | <0.001 | SZ/SAD < SAD/BDNP/BDP < HC |
| 5.08 | 3, 642 | 0.002 | ||||||||||||
| BACS symbol coding score | –0.11 | 1.07 | –0.75 | 1.01 | –0.77 | 1.08 | –1.13 | 1.17 | –1.4 | 1.07 | 57.02 | 4, 1007 | <0.001 | SZ/SAD < BDP/BDNP < HC |
| 12.62 | 3, 642 | <0.001 | ||||||||||||
| BACS Tower of London score | –0.1 | 1.13 | –0.48 | 1.16 | –0.32 | 1.12 | –0.65 | 1.31 | –0.97 | 1.38 | 18.96 | 4, 1008 | <0.001 | SZ/SAD < SAD/BDNP/BDP < BDP/HC |
| 8.75 | 3, 643 | <0.001 | ||||||||||||
| PANSS positive score | NA | NA | 12.76 | 3.64 | 13.82 | 5.86 | 17.85 | 6.92 | 17.71 | 6.29 | 22.62 | 3, 592 | <0.001 | BDNP/BDP < SZ/SAD |
| PANSS negative score | NA | NA | 14.57 | 5.86 | 13.85 | 6.44 | 16.32 | 7.16 | 17.39 | 6.71 | 9.22 | 3, 591 | <0.001 | BDP/BDNP < BDNP/SAD < SAD/SZ |
| PANSS general score | NA | NA | 31.67 | 8.83 | 31.06 | 10.59 | 33.16 | 9.87 | 32.24 | 10 | 1.28 | 3, 592 | 0.28 | n.s. |
| PANSS total score | NA | NA | 59 | 15.84 | 58.72 | 21.12 | 67.33 | 21.39 | 67.42 | 20.15 | 8.18 | 3, 591 | <0.001 | BDP/BDNP < SAD/SZ |
| MADRS score | NA | NA | 14.76 | 9.33 | 14.56 | 11.82 | 14.01 | 10.7 | 9.75 | 8.94 | 8.90 | 3, 600 | <0.001 | SZ < SAD/BDP/BDNP |
| YMRS score | NA | NA | 9.41 | 7.1 | 8.98 | 8.82 | 10.83 | 7.95 | 9.93 | 7.28 | 1.64 | 3, 599 | 0.18 | n.s. |
TABLE 1. Demographic characteristics and clinical scale scores by group among multiple diagnostic groups across the schizophrenia- bipolar spectrum and healthy comparison subjectsa
Stimuli
Recording conditions, stimulus presentation, and recording equipment were standardized across sites (1, 41, 43, 44). Participants refrained from smoking for 1 hour prior to testing. They were seated in an acoustically quiet booth, and an auditory oddball paradigm was administered. Stimuli were 567 standard tones (1,000 Hz) and 100 target tones (1,500 Hz) presented in pseudorandom order (intertrial interval, ∼1,300 ms) at 70 dB. Participants were asked to press a button when a target was detected and keep a mental count of target tones.
EEG Recording and Preprocessing
EEG was continuously recorded from 64 sensors and preprocessed using previously published methods (1, 43, 44, 47) (for details, see the Methods section in the online supplement). EEG data for each trial were segmented into 1,250-ms epochs extending from 250 ms before trial onset to 1,000 ms after trial onset. Trials containing activity exceeding ±75 mV at any sensor were eliminated from further processing. Our previous study confirmed that patient groups have similar percentages of correct responses (approximately 90%) to target trials, and therefore all artifact-free target trials were included (1). At least 50% of trials were accepted for all participants, and the study groups did not differ on the number of usable trials. Data from included trials were averaged for each participant to create a 64-sensor grand-average ERP. Each ERP was baseline adjusted using the 100-ms prestimulus period (Figures 1 and 2).
ERP Principal Component Analysis for Spatial Data Reduction
The following steps were taken separately for standard and target trials. To use ERP data from every sensor and capture topographical distributions of evoked brain responses across time, we used spatial principal component analysis for the concatenated grand-average voltage data from all groups (implemented using MATLAB, MathWorks, Natick, Mass. [48]). This resulted in one component for standard trials (accounting for 94% of the variance) and two for target trials (the frontal component accounted for 53% of the variance and the parietal component for 45% of the variance) (Figures 1 and 2). The spatial principal component analysis component weights were multiplied by each participant’s grand average data, summed across sensors, and divided by the plus sum of component weights, reducing the waveform from 64 sensors to a voltage-by-time “virtual sensor.” This virtual sensor efficiently summarized the spatial distributions, minimizing the number of statistical comparisons and maximizing the signal-to-noise ratio of ERP data (47, 49, 50). ERP data were then standardized across all participants, and therefore voltage data are reported in standardized microvolts. To compare results from the first iteration of B-SNIP (B-SNIP1), we performed identical analyses using all B-SNIP1 and B-SNIP2 participants. (For the demographic characteristics of B-SNIP1 participants, see the Methods section and Table S1 in the online supplement.)
Event-Related Oscillation Time-Frequency Analysis
Data were also analyzed in the frequency domain. Data from each sensor of the grand-average ERP were converted to the time-frequency domain with a modified Morlet wavelet procedure (3–52 Hz; 5-ms steps; one cycle at the lowest to eight cycles at the highest; output range, 100 ms before to 600 ms after stimulus onset) (1, 41, 51). Power values (squared absolute values of complex wavelet outputs) were then converted to decibels (10×log10).
To identify frequency bands of interest, we performed a frequency principal component analysis (see the Methods section in the online supplement). The three resulting components were low (3–13 Hz), beta (14–29 Hz), and gamma (30–52 Hz) (see Figure S1 in the online supplement). This result is highly consistent with results from the B-SNIP1 study (1) and captures cortically relevant frequency bands resolvable with EEG (52). Waveforms were reduced from 50 frequencies (3–52 Hz) to three frequency bands, resulting in six total waveforms (three standard trials and three target trials). For each frequency component, all sensors were averaged to create one time-frequency waveform (Figure 3). Each time-frequency waveform was then standardized across all participants, and therefore frequency data are reported in standardized power values.

Age Adjustment
To adjust for any age associations with voltage and time-frequency components, we performed the following steps (53): For each voltage and time-frequency component, data were segmented into 20-ms bins from −100 to 600 ms. Linear and quadratic regressions were performed on age using only the healthy sample. When beta coefficients for age effects were significant (p<0.05), data for all participants at that bin were adjusted based on age-related associations found in the healthy group prior to group comparisons (1, 41).
Statistical Analysis
Statistical analyses were performed with SPSS, version 23 (IBM, Armonk, N.Y.), SAS (SAS Institute, Cary, N.C.), and custom MATLAB code.
Comparison of B-SNIP1 and B-SNIP2.
For B-SNIP1 and B-SNIP2 participants, a group-by-study analysis of variance (ANOVA) (healthy, schizophrenia, schizoaffective disorder, and bipolar disorder with psychosis groups, and B-SNIP1 and B-SNIP2 studies) was calculated on each 20-ms time bin from −100 to 600 ms for standard and target ERP components. All ANOVA p values within each component were adjusted using a false discovery rate (FDR) method (54). Additionally, mean responses across the entire ERP time course were correlated by group. For additional equivalence contrast testing between the total sample, the healthy comparison sample, and the psychosis sample, see the Methods section and Figure S2 in the online supplement.
B-SNIP2 sample only analyses.
For each voltage and time-frequency component, a group-by-sex ANOVA was calculated on each 20-ms time bin from −100 to 600 ms. All ANOVA p values within each component were adjusted using an FDR method (54). Sex was included as a factor because of possible differences in distribution of sex by group. Significant effects involving group were averaged within adjacent time bins for each participant. For Tukey’s B post hoc tests, see Table S3 in the online supplement. Additionally, for each EEG variable, a group-by-site ANOVA was performed to rule out any group-by-site interactions; no significant interactions were found.
Group Discrimination Analyses
The above analyses yielded a large number of variables (26 total) significantly differentiating the study groups; however, some variables could provide redundant information. To yield an efficient means for describing group differences across many significant EEG time bins, we used group (healthy, bipolar disorder without psychosis, bipolar disorder with psychosis, schizoaffective disorder, and schizophrenia) as the classification variable and performed canonical discriminant analysis. Similar to principal component analysis, which summarizes total variation among variables, canonical discriminant analysis forms linearly weighted variates (combinations of variables) that maximally separate groups (55, 56). This step efficiently summarized group differentiations and allowed a simple metric for comparing groups on overall EEG patterns (55). (For details, see the Methods section in the online supplement.)
Canonical Correlation Analyses for Clinical Features and Cognition
To evaluate bidirectional relationships between EEG variables and cognition and clinical features, we performed canonical correlation analyses. Canonical correlation analysis identifies the relationship between two sets of variables by maximizing correlations between “predictors” and “criteria” and is particularly useful when there are high intercorrelations within variable sets (56). The outcome of a canonical correlation is correlated pairs of latent variates. Each pair is independent and comprises weighted sums of the predictor variables that maximally correlate with weighted sums of the criterion variables. Interpretation of what the latent variates represent and how they are related to each other can be determined by the weighted sums/loadings of individual measures on the latent structure, much like principal component analysis. The two canonical correlations quantified relationships between EEG variables and 1) cognition, as measured with the Brief Assessment of Cognition in Schizophrenia (BACS) subtests (57, 58) (verbal memory, digit sequencing, token motor, verbal fluency, symbol coding, and Tower of London tests), and 2) clinical features, as measured with the Birchwood Social Functioning Scale, the Positive and Negative Syndrome Scale (PANSS), the Young Mania Rating Scale (YMRS), and the Montgomery-Åsberg Depression Rating Scale (MADRS) (59–62). (For details, see the Methods section in the online supplement.)
Medication Association Analysis
To evaluate relationships between neural components and medication status, two-sided Spearman correlations were computed between on/off status between major drug classes and each significant EEG variable (see Tables S7–S11 in the online supplement).
Results
B-SNIP1 Compared With B-SNIP2 Voltage Virtual Sensors for Standard and Target Trials
There was one time course for standard trials and two for target trials (frontal and parietal) (Figure 1). Each was analyzed with group-by-study ANOVAs in 20-ms segments starting 100 ms prestimulus to 600 ms poststimulus onset. There were no significant group-by-study effects that survived FDR adjustment. To compare EEG morphologies across time, the grand-average ERP response from −100 to 600 ms was correlated between studies for each group (healthy, bipolar disorder with psychosis, schizoaffective disorder, and schizophrenia); all correlations were >0.94. Results are consistent with findings in the paired-stimuli auditory task in the B-SNIP1 sample compared with the B-SNIP2 sample (43). For further details on equivalence testing, see the Methods section and Figure S3 in the online supplement.
Voltage Virtual Sensors for Standard and Target Trials
There was one time course for standard trials and two for target trials (frontal and parietal) (Figure 2). Each was analyzed with group-by-sex ANOVAs in 20-ms segments from 100 ms prestimulus to 600 ms poststimulus onset (FDR-adjusted analyses are shown in Figure 2). After averaging over adjacent significant time bins, 13 significant variables were identified. For ease of interpretation, we reported corresponding traditional ERP component names. For standard trials, five time bins captured significant effects: P50 (60–80 ms), N100 (80–140 ms), rising P200 (140–200 ms), late P200 (200–280 ms), and late (520–580 ms). For the frontal target component, four time bins captured significant effects: N100 (80–140 ms), P2/N2 (140–240 ms), P3a-like (280–360 ms), and late (420–580 ms). For the parietal target component, four time bins captured significant effects: N100 (60–140 ms), N200 (140–260 ms), early P300b (320–420 ms), and late P300b (420–600 ms).
Frequency Bands for Standard and Target Trials
For both standard and target trials, there were three frequency time courses (Figure 3): low (3–13 Hz), beta (14–29 Hz), and gamma (30–52 Hz); each was analyzed with group-by-sex ANOVAs in 20-ms segments starting 100 ms prestimulus to 600 ms poststimulus onset (FDR-adjusted analyses are shown in Figure 3). After averaging over adjacent significant time bins, 13 significant variables were identified. For standard trials, one low bin (early/mid: 20–340 ms), one beta bin (early: 20–160 ms), and three gamma bins (early: 20–90 ms, mid: 180–200 ms, and mid-2: 220–260 ms) captured significant effects. For target trials, three low bins (early: 40–160 ms, mid: 160–290 ms, and late: 300–440 ms), two beta bins (mid: 140–220 ms and late: 420–560 ms), and three gamma bins (mid: 140–180 ms, mid-2: 240–280 ms, and late: 340–600 ms) captured significant effects. No group-by-sex effects were observed.
Multivariate Analyses
Canonical discriminant analysis.
The 26 EEG variables differentiating groups were used to identify canonical variates best capturing group differences. Three variates were significant (variate 1: Wilks’s lambda=0.666, p<0.001, 64.5% of variance; variate 2: Wilks’s lambda=0.858, p<0.001, 17.4% variance; variate 3: Wilks’s lambda=0.924, p=0.001, 11.5% of variance; Figure 4A). For structure matrices, see Table S4 in the online supplement.
The first variate separated the groups along the following diagnostic continuum: healthy (mean=0.53 [SD=0.95]) > bipolar disorder with psychosis (Glass’s delta: −0.49)/bipolar disorder without psychosis (Glass’s delta: −0.56) > schizophrenia (Glass’s delta: −1.10)/schizoaffective disorder (Glass’s delta: −1.16). Neural variables most associated with this variate were as follows: target trial parietal N200 responses (lower is better; r=−0.50), target trial mid low-frequency responses (higher is better; r=0.48), standard trial N100 responses (lower is better; r=−0.45), and standard trial early/mid low-frequency responses (higher is better; r=0.44).
The second variate separated bipolar disorder without psychosis from bipolar disorder with psychosis at the extremes: bipolar disorder without psychosis (Glass’s delta: 0.82) > schizophrenia (Glass’s delta: 0.02)/healthy (mean=0.027 [SD=1.0])/schizoaffective disorder (Glass’s delta: −0.06) > bipolar disorder with psychosis (Glass’s delta: −0.44). Neural variables most associated with this variate were as follows: standard trial ERP P50 responses (higher indicates over-activity; r=0.31), early standard trial beta responses (higher indicates over-activity; r=0.34), and early standard trial gamma responses (higher indicates over-activity; r=0.46).
The third variate separated healthy from bipolar disorder groups at the extremes: healthy (mean=0.13 [SD=0.99])/schizoaffective disorder (Glass’s delta: −0.003)/schizophrenia (Glass’s delta: −0.045) > bipolar disorder with psychosis (Glass’s delta: −0.51)/bipolar disorder without psychosis (Glass’s delta: −0.64). Neural variables most associated with this variate were as follows: standard trial P200 responses (higher is better; r=0.57) and target trial frontal P3a and late ERP responses (higher is better; r=0.45 and r=0.40).
In summary, variate 1 separated groups along an axis of psychopathology severity, variate 2 separated bipolar disorder without psychosis from bipolar disorder with psychosis, and variate 3 separated the bipolar disorder groups from the healthy and nonaffective psychosis groups (Figure 4A).
Canonical Correlation Analysis Relating Neural Responses and Cognitive Performance
In order to capture the relationship between cognitive performance and neural responses regardless of group, we performed a conical correlation between all 26 significant neural variables and six cognitive BACS subtests, maximizing the canonical correlation analysis between a neural latent component and a cognitive latent component. One canonical correlation component (r=0.47, p<0.0001) differentiated healthy participants from the patient groups (Figure 4B).
The cognitive component was related to all cognitive subtests (higher is better; all r values >0.60), and the neural component was related to standard trial N100 responses (lower is better; r=−0.52), standard trial early and early low-frequency responses (higher is better; r=0.54), target trial frontal N100 responses (lower is better; r=−0.42), target trial parietal N100/N200 (lower is better; r=−0.42 and r=−0.49) and P300s responses (higher is better; 320–420 ms: r=0.48 and 420–600 ms: r=0.44), and target trial early/mid/late low-frequency responses (higher is better; r=0.46, r=0.63, and r=0.62).
Given the similarity of structure matrices between canonical discriminant variate 1 (which maximized group separations) and the canonical correlation neural latent component (which maximized correlations with cognition), we performed a Pearson’s correlation between these variates, which showed a strong relationship (r=0.91, p<0.0001; see Figure S2 in the online supplement) that remained even after performing a partial correlation controlling for diagnosis (r=0.89) and separately controlling for the cognition latent component (r=0.88).
Canonical Correlation Analysis Relating Neural Responses and Clinical Features
To capture the relationship between clinical symptoms and neural responses regardless of diagnosis, we performed a canonical correlation between all 26 significant neural variables and six clinical features (measured with the PANSS positive, negative, and general subscales, the MADRS, the YMRS, and the Birchwood Social Functioning Scale). One canonical correlation component was identified (r=0.34, p<0.0001; Figure 4C). The clinical latent component was associated with higher MADRS scores and social functioning (r=0.48; r=0.36) and lower PANSS positive and negative symptom scores (r=−0.34; r=−0.34). The neural latent component was associated with lower response to the standard rising P200 (r=−0.46) and target frontal late trials (420–580 ms: r=−0.51), as well as higher target trial parietal P300b ERP responses (320–420 ms: r=0.35; 420–600 ms: r=0.32).
Discussion
There are four primary outcomes of practical and theoretical importance in our study. First, we replicated previous auditory oddball responses across the psychosis spectrum using a large, independent sample (N=597) and compared them to previous B-SNIP data (N=526) (1, 35). Psychiatry research has been plagued with lingering questions about the field’s ability to reproduce major findings (63). Our results provide a convincing demonstration of the replicability of EEG responses in severe psychiatric syndromes. Despite a complex pattern of responses across disorders, morphologically, ERPs were highly similar across trial type and time (all r values ≥0.94; see also reference 43), and there were no group-by-study interactions that reached a clinically significant threshold (Figure 1; see also Figure S3 in the online supplement). Equivalence contrast tests between studies indicated highly similar responses between the total, healthy, and psychosis samples (see Figure S3 in the online supplement). The consistency of responses found between two large, multisite research studies supports their utility as transdiagnostic biomarkers that are suitable targets for pharmacologic-based and neuroplasticity-based cognitive training interventions (64, 65) and for deriving biologically based subgroups (35).
Second, we used 26 ERPs and event-related oscillations on which groups differed in multivariate analyses to empirically identify “neural variates” that maximally separated diagnostic groups. The first neural variate demonstrated a diagnostic group continuum from healthy subjects to patients with bipolar disorder with psychosis to patients with schizophrenia-like psychosis and was related most strongly to the target trial N200, P300B, and mid/late low-frequency responses and the standard trial N100, N200, early low-frequency responses (Figure 4A). This neural variate was essentially identical to the canonical correlation neural variate empirically derived to capture the relationship between EEG measures and overall cognitive ability (r=0.91; Figure 4B; see also Figure S2 in the online supplement). The magnitude of this relationship indicates that multivariate neural responses during an auditory oddball task could be considered a proxy for cognitive capacity among individuals with a serious psychiatric syndrome (66, 67). This outcome is perhaps unsurprising given the association of P300 (10) and severe psychosis (28, 29) with working memory. However, this finding links previous reports of a transdiagnostic continuum of cognitive dysfunction across psychiatric syndromes (30), their relationship to auditory sensory processing (23, 26, 27), and poor outcomes for patients with psychosis followed for 15 years who had deviant P3b at initial evaluation (22). Future translational, pharmacological, and clinical interventions that use EEG biomarkers should carefully consider the relationship between psychiatric syndromes and general cognitive functioning and examine multivariate neural targets that have overlapping neural circuits (e.g., thalamocortical) and neurotransmitter neurophysiologic properties (e.g., NMDAergic).
Third, when considering the transdiagnostic relationships with clinical features, it was affective and social functioning, rather than psychosis-specific, characteristics that were more strongly associated with neural responses during auditory oddball processing. Lower-amplitude P200 and P3a-like (frontal component) responses, combined with higher-amplitude late P3b responses to targets had the strongest association with clinical features. Both the P200 and frontal P3a-type responses are involved in early stimulus registration and orienting, with the former being previously linked to bipolar disorder with psychosis (32). Bipolar disorder patients are also known to have higher-amplitude P300b responses in mixed groups of patients with serious psychiatric syndromes (1, 33).
Finally, there was a large distinction in neural responses between bipolar disorder patients with and without psychosis (Cohen’s d=1.26; 95% CI=0.98, 1.54), with accentuated ERP and beta/gamma frequency responses during the P50 time period characterizing bipolar disorder without psychosis (43). The P50 response was hypothesized to be related to acetylcholine-mediated hippocampal filtering and has been shown to be associated with the α7 nicotinic acetylcholine receptor subunit gene (CHRNA7) in schizophrenia (68–70). Possibly, there are genetic differences between bipolar disorder with and without psychosis mediating the P50 response. Future studies should investigate whether family history of psychosis interacts with P50 response and CHRNA7. These neurophysiological differences are consistent with growing evidence for partially distinct etiologies. Compared with persons with bipolar disorder without psychosis, those with bipolar disorder with psychosis are 2–3 times more likely to have relatives with bipolar disorder with psychosis (71), and persons with schizophrenia have increased rates of bipolar disorder with psychosis compared with bipolar disorder without psychosis among their relatives (72), which is consistent with twin studies (73). EEG responses in bipolar disorder are also moderated by a family history of psychosis (32), and persons with bipolar disorder have reduced P300b based on the presence of psychosis (33). Future psychiatric nosologies should consider these data in the classification of bipolar disorder with and without psychosis.
Strengths of this study include a large sample spanning multiple serious psychiatric syndromes, substantial clinical characterization, and thorough quantification of ERP and event-related oscillation neural responses from an established auditory processing task. We demonstrated remarkable similarity in neural responses between the present and past B-SNIP samples on ERP waveforms (8), supporting auditory oddball responses as transdiagnostic biomarkers. Limitations of this study are typical of a large cross-sectional study. The bipolar disorder without psychosis group was smaller and their data were collected at only three of the five research centers. Almost all patients were medicated (for correlations of EEG variables and medications, see Table S7 in the online supplement). Treatment effects cannot be definitively excluded; however, previous studies have found minimal medication effects (4). The majority of participants with psychosis, and many with bipolar disorder without psychosis, were taking antipsychotics (schizophrenia, 84%; schizoaffective disorder, 79%; bipolar disorder with psychosis, 65%; and bipolar disorder without psychosis, 39%). There was a significant overall difference in the frequency of mood stabilizer and antidepressant use, but the bipolar disorder groups with and without psychosis had similar rates (mood stabilizers: bipolar disorder with psychosis, 65%; bipolar disorder without psychosis, 68%; lithium: bipolar disorder with psychosis, 23%; bipolar disorder without psychosis, 26%; antidepressants: bipolar disorder with psychosis, 29%; bipolar disorder without psychosis, 35%). The majority of participants were chronic, stable outpatients, but there is also evidence of oddball ERP abnormalities in preonset and first-episode psychosis (20, 21, 74). Overall, these results have implications for understanding the neurobiology of psychosis-bipolar spectrum syndromes and for identifying biomarkers suitable as therapeutic targets for interventions and translational research.
1. : Event-related potential and time-frequency endophenotypes for schizophrenia and psychotic bipolar disorder . Biol Psychiatry 2015 ; 77 : 127 – 136 Crossref, Medline, Google Scholar
2. : Relationships between auditory event-related potentials and mood state, medication, and comorbid psychiatric illness in patients with bipolar disorder . Bipolar Disord 2009 ; 11 : 857 – 866 Crossref, Medline, Google Scholar
3. : Meta-analysis of P300 and schizophrenia: patients, paradigms, and practical implications . Psychophysiology 2003 ; 40 : 684 – 701 Crossref, Medline, Google Scholar
4. : Meta-analysis of the P300 and P50 waveforms in schizophrenia . Schizophr Res 2004 ; 70 : 315 – 329 Crossref, Medline, Google Scholar
5. : Neurophysiological endophenotypes across bipolar and schizophrenia psychosis . Schizophr Bull 2008 ; 34 : 760 – 773 Crossref, Medline, Google Scholar
6. : The P300 event-related potential in bipolar disorder: a systematic review and meta-analysis . J Affect Disord 2019 ; 256 : 234 – 249 Crossref, Medline, Google Scholar
7. : Evoked-potential correlates of stimulus uncertainty . Science 1965 ; 150 : 1187 – 1188 Crossref, Medline, Google Scholar
8. : The utility of P300 as a schizophrenia endophenotype and predictive biomarker: clinical and socio-demographic modulators in COGS-2 . Schizophr Res 2015 ; 163 : 53 – 62 Crossref, Medline, Google Scholar
9. : Schizophrenics have fewer and smaller P300s: a single-trial analysis . Biol Psychiatry 1994 ; 35 : 96 – 103 Crossref, Medline, Google Scholar
10. : Updating P300: an integrative theory of P3a and P3b . Clin Neurophysiol 2007 ; 118 : 2128 – 2148 Crossref, Medline, Google Scholar
11. : Auditory P3a and P3b neural generators in schizophrenia: an adaptive sLORETA P300 localization approach . Schizophr Res 2015 ; 169 : 318 – 325 Crossref, Medline, Google Scholar
12. : Use of swLORETA to localize the cortical sources of target- and distracter-elicited P300 components . Clin Neurophysiol 2011 ; 122 : 1991 – 2002 Medline, Google Scholar
13. : The p300: where in the brain is it produced and what does it tell us? Neuroscientist 2005 ; 11 : 563 – 576 Crossref, Medline, Google Scholar
14. : Dopaminergic mechanisms of target detection: P300 event related potential and striatal dopamine . Psychiatry Res 2011 ; 194 : 212 – 218 Crossref, Medline, Google Scholar
15. : Heritability and reliability of P300, P50 and duration mismatch negativity . Behav Genet 2006 ; 36 : 845 – 857 Crossref, Medline, Google Scholar
16. : Genetic sources of subcomponents of event-related potential in the dimension of psychosis analyzed from the B-SNIP study . Am J Psychiatry 2015 ; 172 : 466 – 478 Link, Google Scholar
17. : P300 and genetic risk for schizophrenia . Arch Gen Psychiatry 2003 ; 60 : 1158 – 1167 Crossref, Medline, Google Scholar
18. : Genetic overlap between bipolar illness and event-related potentials . Psychol Med 2007 ; 37 : 667 – 678 Crossref, Medline, Google Scholar
19. : Auditory P300 in patients with bipolar disorder and their unaffected relatives . Bipolar Disord 2008 ; 10 : 377 – 386 Crossref, Medline, Google Scholar
20. , et al: Association between P300 responses to auditory oddball stimuli and clinical outcomes in the psychosis risk syndrome . JAMA Psychiatry 2019 ; 76 : 1187 – 1197 Crossref, Medline, Google Scholar
21. : Electroencephalography and event-related potential biomarkers in individuals at clinical high risk for psychosis . Biol Psychiatry 2020 ; 88 : 294 – 303 Crossref, Medline, Google Scholar
22. : Clinical significance of auditory target P300 subcomponents in psychosis: differential diagnosis, symptom profiles, and course . Schizophr Res 2015 ; 165 : 145 – 151 Crossref, Medline, Google Scholar
23. :
24. : Audio-visual multisensory integration in superior parietal lobule revealed by human intracranial recordings . J Neurophysiol 2006 ; 96 : 721 – 729 Crossref, Medline, Google Scholar
25. : Association between electroencephalographic modulation, psychotic-like experiences and cognitive performance in the general population . Psychiatry Clin Neurosci 2016 ; 70 : 286 – 294 Crossref, Medline, Google Scholar
26. : Neuropsychological performance and auditory event related potentials in schizophrenia patients and their siblings: a family study . Schizophr Res 2011 ; 130 : 195 – 202 Crossref, Medline, Google Scholar
27. : Neuropsychological correlates of P300 abnormalities in patients with schizophrenia and obsessive-compulsive disorder . Psychiatry Res 2003 ; 123 : 109 – 123 Crossref, Medline, Google Scholar
28. : Memory and cognition in schizophrenia . Mol Psychiatry 2019 ; 24 : 633 – 642 Crossref, Medline, Google Scholar
29. : Working memory in schizophrenia: a meta-analysis . Psychol Med 2009 ; 39 : 889 – 905 Crossref, Medline, Google Scholar
30. : Neuropsychological impairments in schizophrenia and psychotic bipolar disorder: findings from the Bipolar-Schizophrenia Network on Intermediate Phenotypes (B-SNIP) study . Am J Psychiatry 2013 ; 170 : 1275 – 1284 Link, Google Scholar
31. : Longitudinal studies of cognition and functional outcome in schizophrenia: implications for MATRICS . Schizophr Res 2004 ; 72 : 41 – 51 Crossref, Medline, Google Scholar
32. : Family history of psychosis moderates early auditory cortical response abnormalities in non-psychotic bipolar disorder . Bipolar Disord 2013 ; 15 : 774 – 786 Crossref, Medline, Google Scholar
33. : Reduced electroencephalogram responses to standard and target auditory stimuli in bipolar disorder and the impact of psychotic features: analysis of event-related potentials, spectral power, and inter-trial coherence . Bipolar Disord 2018 ; 20 : 49 – 59 Crossref, Medline, Google Scholar
34. : Can P300 distinguish among schizophrenia, schizoaffective and bipolar I disorders? an ERP study of response inhibition . Schizophr Res 2013 ; 151 : 175 – 184 Crossref, Medline, Google Scholar
35. : Identification of distinct psychosis biotypes using brain-based biomarkers . Am J Psychiatry 2016 ; 173 : 373 – 384 Link, Google Scholar
36. : Diagnostic specificity of neurophysiological endophenotypes in schizophrenia and bipolar disorder . Schizophr Bull 2013 ; 39 : 1219 – 1229 Crossref, Medline, Google Scholar
37. : Auditory dysfunction in schizophrenia: integrating clinical and basic features . Nat Rev Neurosci 2015 ; 16 : 535 – 550 Crossref, Medline, Google Scholar
38. : Neurophysiological biomarkers for drug development in schizophrenia . Nat Rev Drug Discov 2008 ; 7 : 68 – 83 Crossref, Medline, Google Scholar
39. : Multivariate genetic correlates of the auditory paired stimuli-based p2 event-related potential in the psychosis dimension from the BSNIP study . Schizophr Bull 2016 ; 42 : 851 – 862 Crossref, Medline, Google Scholar
40. : What can time-frequency and phase coherence measures tell us about the genetic basis of P3 amplitude? Int J Psychophysiol 2017 ; 115 : 40 – 56 Crossref, Medline, Google Scholar
41. : Diagnostic specificity and familiality of early versus late evoked potentials to auditory paired stimuli across the schizophrenia-bipolar psychosis spectrum . Psychophysiology 2014 ; 51 : 348 – 357 Crossref, Medline, Google Scholar
42. : The early auditory gamma-band response is heritable and a putative endophenotype of schizophrenia . Schizophr Bull 2011 ; 37 : 778 – 787 Crossref, Medline, Google Scholar
43. : Auditory paired-stimuli responses across the psychosis and bipolar spectrum and their relationship to clinical features . Biomarkers Neuropsychiatry 2020 ; 3 : 100014 Crossref, Google Scholar
44. : Auditory steady-state EEG response across the schizo-bipolar spectrum . Schizophr Res 2019 ; 209 : 218 – 226 Crossref, Medline, Google Scholar
45. : Clinical phenotypes of psychosis in the Bipolar-Schizophrenia Network on Intermediate Phenotypes (B-SNIP) . Am J Psychiatry 2013 ; 170 : 1263 – 1274 Link, Google Scholar
46.
47. : Neural activations during auditory oddball processing discriminating schizophrenia and psychotic bipolar disorder . Biol Psychiatry 2012 ; 72 : 766 – 774 Crossref, Medline, Google Scholar
48. : Evaluation of PCA and ICA of simulated ERPs: Promax vs. Infomax rotations . Hum Brain Mapp 2007 ; 28 : 742 – 763 Crossref, Medline, Google Scholar
49. : Contributions of spectral frequency analyses to the study of P50 ERP amplitude and suppression in bipolar disorder with or without a history of psychosis . Bipolar Disord 2008 ; 10 : 776 – 787 Crossref, Medline, Google Scholar
50. : Spatiotemporal and frequency domain analysis of auditory paired stimuli processing in schizophrenia and bipolar disorder with psychosis . Psychophysiology 2012 ; 49 : 522 – 530 Crossref, Medline, Google Scholar
51. : Pre-cue fronto-occipital alpha phase and distributed cortical oscillations predict failures of cognitive control . J Neurosci 2012 ; 32 : 7034 – 7041 Crossref, Medline, Google Scholar
52. : Genetic and disorder-specific aspects of resting state EEG abnormalities in schizophrenia . Schizophr Bull 2009 ; 35 : 826 – 839 Crossref, Medline, Google Scholar
53. : The Alzheimer’s Disease Neuroimaging Initiative: age correction in dementia: matching to a healthy brain . PLoS One 2011 ; 6 : 1 – 9 Crossref, Google Scholar
54. : Controlling the false discovery rate: a practical and powerful approach to multiple testing . J R Stat Soc B 1995 ; 57 : 289 – 300 Google Scholar
55. : Tests of significance in canonical analysis . Biometrika 1959 ; 46 : 59 – 66 Crossref, Google Scholar
56. : Canonical Analysis and Factor Comparison. Thousand Oaks, Calif ., Sage Publications , 1977 Crossref, Google Scholar
57. : The Brief Assessment of Cognition in Schizophrenia: reliability, sensitivity, and comparison with a standard neurocognitive battery . Schizophr Res 2004 ; 68 : 283 – 297 Crossref, Medline, Google Scholar
58. : Norms and standardization of the Brief Assessment of Cognition in Schizophrenia (BACS) . Schizophr Res 2008 ; 102 : 108 – 115 Crossref, Medline, Google Scholar
59. : The Social Functioning Scale: the development and validation of a new scale of social adjustment for use in family intervention programmes with schizophrenic patients . Br J Psychiatry 1990 ; 157 : 853 – 859 Crossref, Medline, Google Scholar
60. : Stability of the five-factor structure of the Positive and Negative Syndrome Scale (PANSS) . Schizophr Res 2000 ; 42 : 231 – 239 Crossref, Medline, Google Scholar
61. : A rating scale for mania: reliability, validity and sensitivity . Br J Psychiatry 1978 ; 133 : 429 – 435 Crossref, Medline, Google Scholar
62. : A new depression scale designed to be sensitive to change . Br J Psychiatry 1979 ; 134 : 382 – 389 Crossref, Medline, Google Scholar
63. : Editors’ introduction to the special section on replicability in psychological science: a crisis of confidence? Perspect Psychol Sci 2012 ; 7 : 528 – 530 Crossref, Medline, Google Scholar
64. : Neurophysiologic measures of target engagement predict response to auditory-based cognitive training in treatment refractory schizophrenia . Neuropsychopharmacology 2019 ; 44 : 606 – 612 Crossref, Medline, Google Scholar
65. : Utility of imaging-based biomarkers for glutamate-targeted drug development in psychotic disorders: a randomized clinical trial . JAMA Psychiatry 2018 ; 75 : 11 – 19 Crossref, Medline, Google Scholar
66. : Identification of common neural circuit disruptions in cognitive control across psychiatric disorders . Am J Psychiatry 2017 ; 174 : 676 – 685 Link, Google Scholar
67. : Transdiagnostic impairment of cognitive control in mental illness . J Psychiatr Res 2016 ; 83 : 37 – 46 Crossref, Medline, Google Scholar
68. : Electrophysiological endophenotypes for schizophrenia . Harv Rev Psychiatry 2016 ; 24 : 129 – 147 Crossref, Medline, Google Scholar
69. : Association of promoter variants in the α7 nicotinic acetylcholine receptor subunit gene with an inhibitory deficit found in schizophrenia . Arch Gen Psychiatry 2002 ; 59 : 1085 – 1096 Crossref, Medline, Google Scholar
70. : Linkage of a neurophysiological deficit in schizophrenia to a chromosome 15 locus . Proc Natl Acad Sci USA 1997 ; 94 : 587 – 592 Crossref, Medline, Google Scholar
71. : The genetics of psychotic bipolar disorder . Curr Psychiatry Rep 2008 ; 10 : 178 – 189 Crossref, Medline, Google Scholar
72. : Psychiatric illness in first-degree relatives of schizophrenic and surgical control patients: a family study using DSM-III criteria . Arch Gen Psychiatry 1985 ; 42 : 770 – 779 Crossref, Medline, Google Scholar
73. : A twin study of schizoaffective-mania, schizoaffective-depression, and other psychotic syndromes . Am J Med Genet B Neuropsychiatr Genet 2012 ; 159B : 172 – 182 Crossref, Medline, Google Scholar
74. : Auditory and visual oddball stimulus processing deficits in schizophrenia and the psychosis risk syndrome: forecasting psychosis risk with P300 . Schizophr Bull 2019 ; 45 : 1068 – 1080 Crossref, Medline, Google Scholar