Social Responsiveness, an Autism Endophenotype: Genomewide Significant Linkage to Two Regions on Chromosome 8
Abstract
Objective:
Autism spectrum disorder is characterized by deficits in social function and the presence of repetitive and restrictive behaviors. Following a previous test of principle, the authors adopted a quantitative approach to discovering genes contributing to the broader autism phenotype by using social responsiveness as an endophenotype for autism spectrum disorder.
Method:
Linkage analyses using scores from the Social Responsiveness Scale were performed in 590 families from the Autism Genetic Resource Exchange, a largely multiplex autism spectrum disorder cohort. Regional and genomewide association analyses were performed to search for common variants contributing to social responsiveness.
Results:
Social Responsiveness Scale scores were unimodally distributed in male offspring from multiplex autism families, in contrast with a bimodal distribution observed in female offspring. In correlated analyses differing by Social Responsiveness Scale respondent, genomewide significant linkage for social responsiveness was identified at chr8p21.3 (multipoint LOD=4.11; teacher/parent scores) and chr8q24.22 (multipoint LOD=4.54; parent-only scores), respectively. Genomewide or linkage-directed association analyses did not detect common variants contributing to social responsiveness.
Conclusions:
The sex-differential distributions of Social Responsiveness Scale scores in multiplex autism families likely reflect mechanisms contributing to the sex ratio for autism observed in the general population and form a quantitative signature of reduced penetrance of inherited liability to autism spectrum disorder among females. The identification of two strong loci for social responsiveness validates the endophenotype approach for the identification of genetic variants contributing to complex traits such as autism spectrum disorder. While causal mutations have yet to be identified, these findings are consistent with segregation of rare genetic variants influencing social responsiveness and underscore the increasingly recognized role of rare inherited variants in the genetic architecture of autism spectrum disorder.
Autism spectrum disorder is a common neurodevelopmental disorder characterized by deficits in social function and the presence of repetitive and restrictive behaviors. The etiology of autism spectrum disorder is largely unknown, but genetic influences are known to contribute significantly and major genetic risk factors have been identified in a small percentage of patients (1). A majority of the genetic risk variants identified to date are rare non-inherited mutations that have major effects on disease risk. However, twin and family studies have provided strong evidence for the role of inherited susceptibility factors transmitted through ostensibly unaffected parents (2–4). Thus, identifying forms of transmissible genetic variation in families should have a prominent role in autism spectrum disorder genetic research. Whereas genomewide association has become a method of choice for the identification of common variants influencing heritability, any contribution of rare inherited variation cannot be reliably identified by this approach. Rare inherited variants that are influential, and that converge on a given risk gene for a significant proportion of cases in a clinical population, should theoretically be identifiable through linkage analysis. Although most prior linkage studies of autism have not yielded strong, consistent signals, subject and phenotype selection may have introduced confounds that we attempt to resolve in the approach described here.
An additional aspect of the contribution of heritable common or rare genetic variation relates to what has been labeled the “broader phenotype” in the first-degree relatives of probands with autism spectrum disorder. The broader phenotype refers to the observation that parents and siblings of probands with autism spectrum disorder often have subthreshold autistic-like impairments in social cognition, behavioral rigidity, or language delay when compared with relatives of non-autistic subjects (5). These intermediate phenotypes, also called “endophenotypes,” considered as separable heritable components of the overall disorder, provide one means of reducing heterogeneity in complex neuropsychiatric diseases such as autism spectrum disorder (6, 7). Quantitative endophenotypes also provide additional power when compared with qualitative phenotypes for linkage analysis (8). This is largely because quantitative measures permit an increased sample size by allowing inclusion of clinically unaffected individuals in the analysis, while at the same time avoiding potentially arbitrary categorical classification of subjects (8, 9).
The Social Responsiveness Scale measures heritable, quantitative variation in autistic-like social impairments (10, 11). Twin studies and family studies in normal populations and in cohorts with autism spectrum disorder all indicate significant heritability of traits measured by the Social Responsiveness Scale (9, 12–14). Based on this, we and others have used the Social Responsiveness Scale as a quantitative endophenotype for linkage analysis in families with autism spectrum disorder probands (15, 16). However, no genomewide significant loci have been replicated, consistent with the heterogeneity of autism spectrum disorder and the relatively small sample sizes studied, most consisting of 100–200 families. Furthermore, previous studies have not corrected for sex differences in the distribution of social responsiveness (15, 17, 18), which could attenuate linkage signals. We reasoned that quantitative analysis of social responsiveness measured with the Social Responsiveness Scale using high-density single-nucleotide polymorphism (SNP) genotyping with high-information content, while correcting for sex differences in the distribution of social responsiveness in a relatively large multiplex family sample, would be fruitful. In the present study, we performed multipoint linkage and association analysis using social responsiveness as a quantitative trait in families from the Autism Genetic Resource Exchange. In correlated analyses using Social Responsiveness Scale scores from teacher or parent respondents and from only parent respondents, we have found two loci on chromosome 8 with LOD scores >4.0, among the highest observed in any linkage study of autism spectrum disorder and consistent with genomewide significant linkage.
Method
Samples and Biomaterials
Families were drawn from the Autism Genetic Resource Exchange cohort (19). Purified DNA from lymphoblastoid cell lines was obtained from the Rutgers University Cell and DNA Repository (Piscataway, N.J.). This study was approved by the institutional review boards of the Autism Genetic Resource Exchange, the University of California, Los Angeles (UCLA), and Washington University (St. Louis).
Phenotypes
Scores from the Social Responsiveness Scale (11) were obtained from the Internet System for Assessing Autistic Children database in February 2012 (http://agre.autismspeaks.org/site/c.lwLZKnN1LtH/b.5281593/k.8CB5/What_is_ISAAC.htm). When longitudinal scores were available, the earliest assessment was used. For the primary analysis, total raw scores from assessments contributed by teachers were used, and assessments contributed by parents were used when teacher scores were not available. The correlation between teacher and parent scores (r2=0.57) is shown in Figure SF1 in the data supplement accompanying the online version of this article.
Total raw scores from the Social Responsiveness Scale were adjusted for sex according to normal population means as reported in the scale’s manual (11). No adjustment was applied for age because it was not a significant covariate. Since the Social Responsiveness Scale has not been validated in nonverbal children, we omitted from the analyses individuals with responses to question 9 (“age of first single words”) from the Autism Diagnostic Interview–Revised of “993—had some, lost, not regained” or “994—milestone not yet reached” (20).
In a correlated analysis, we also examined Social Responsiveness Scale scores obtained only from parent report. The use of only parent scores decreases sample size (see Table ST1 in the online data supplement) but eliminates any noise introduced by inconsistencies or systematic differences between parent and teacher respondents. While the “parent-only” analysis cannot be considered independent, it explores one of the assumptions made in our initial model, namely that scores contributed by parents and teachers are interchangeable.
Autism diagnoses were derived from a combination of assessment on the Autism Diagnostic Interview–Revised (20) and/or the Autism Diagnostic Observation Schedule (21) and clinician’s best judgment according to standard protocols of the Autism Genetics Resource Exchange (19). Participants with autism, broad spectrum, or not quite autism were considered “affected” in the qualitative analyses.
SNP Genotypes
Raw genotype data for 943 families were drawn from a previous data set by Wang et al. (22) and subjected to independent quality filtering. Additional families were genotyped in the UCLA Neuroscience Genomics Core (http://www.semel.ucla.edu/ungc) on the Illumina Omni-1 Quad and Omni-2.5–8 platforms (Illumina, San Diego) according to standard manufacturer protocols. Familial relationships in the combined data set were validated using identity-by-descent estimation in PLINK (23). For any monozygotic twin pairs or sample duplicates detected during relationship validation, only one individual was retained for downstream analyses. Each data set was subjected to the following quality filters as applied in PLINK: ≤5% missing data per person or per SNP; minor allele frequency ≥1%; and Hardy-Weinberg equilibrium p value ≥10−7. Because Social Responsiveness Scale scores were available for only a subset of the genotyped cohort, analyses for social responsiveness included 590 families with 1,480 phenotyped individuals.
Genotype imputation was performed separately on each data set using IMPUTE2 and a cosmopolitan reference panel from the 1,000 Genomes Project (24–26). Quality filters included: IMPUTE2 quality score (“info”) ≥0.5; missing data per SNP ≤5%; minor allele frequency ≥1%; and Hardy-Weinberg equilibrium p value ≥10−7. The final data set included 5,814,564 autosomal SNPs passing quality filters.
Linkage Analyses
An independent marker set (r2≤0.1) was identified from the genotyped SNP sets using PLINK (option --indep-pairwise) (23). The pruned marker set consisted of 52,354 autosomal SNPs common to all genotyping platforms. Nonparametric multipoint analyses were performed in Merlin (27). Genomewide multipoint LOD scores are presented in Tables ST2 and ST3 in the online data supplement.
Association Analyses
Single-SNP association analyses for social responsiveness as a quantitative trait were performed on imputed genotypes using the --qfam-total option in PLINK (23), which applies linear regression and uses permutation to correct for nonindependence between family members. Analyses for autism diagnosis as a qualitative trait were performed using the --tdt option in PLINK, with gene-dropping permutations to correct for nonindependence between trios drawn from multiplex families. There were 2,236 affected offspring in 1,250 two-parent families analyzed for association, including trios not used to conduct linkage. Bonferroni correction was applied to p values derived from association analyses in the linked regions of interest using the number of independent markers in the region, as determined using the --indep-pairwise option in PLINK at r2≤0.5.
Results
Clinical/Phenotype Characteristics
We identified families from the Autism Genetic Resource Exchange where two or more offspring had been assessed using the Social Responsiveness Scale (11). To maximize the cohort of genotyped and phenotyped individuals, we used a combination of teacher-reported and parent-reported Social Responsiveness Scale scores. The cohort consisted of 590 families, including 1,480 phenotyped individuals (Table 1). We examined total raw Social Responsiveness Scale scores for the offspring and observed a roughly bimodal distribution correlating with autism spectrum disorder diagnosis (Figure 1). Similarly, there were more male offspring with high scores (indicating greater social impairment), consistent with the male sex bias observed in autism spectrum disorder. The distributions using scores from teacher, parent, or mixed teacher/parent respondents were highly similar within each group. The larger number of individuals with minimal social impairment (low scores) reflects ascertainment bias, with unaffected siblings more often receiving assessments from parents than from teachers. We observed significantly higher scores for males than females from both teacher and parent respondents, as previously observed in the literature (11). While there are likely genetic variants contributing to the sex difference in Social Responsiveness Scale scores, we adjusted scores for sex to focus primarily on genetic variants contributing to variation in social responsiveness in autism spectrum disorder. Total raw scores were adjusted for sex and transformed to Z scores using normal population means and standard deviations (11).
| Characteristic | N | Social Responsiveness Scale Total Raw Score | |||
|---|---|---|---|---|---|
| Mean | SD | Minimum | Maximum | ||
| Families | 590 | ||||
| Phenotyped individuals | 1,480 | ||||
| Parents | |||||
| All | 67 | 36.4 | 25.3 | 5 | 113 |
| Fathers | 32 | 35.0 | 24.4 | 6 | 105 |
| Mothers | 35 | 37.7 | 26.3 | 5 | 113 |
| Autism spectrum disorder | |||||
| All | 967 | 101.8 | 33.9 | 3 | 184 |
| Males | 761 | 103.2 | 33.5 | 8 | 184 |
| Females | 206 | 96.5 | 35.1 | 3 | 169 |
| Non-autism spectrum disorder siblings | |||||
| All | 446 | 27.2 | 27.2 | 0 | 159 |
| Males | 198 | 32.2 | 32.0 | 0 | 159 |
| Females | 248 | 23.1 | 22.0 | 0 | 128 |
TABLE 1. Characteristics of 590 Families From the Autism Genetic Resource Exchange With Social Responsiveness Scale Teacher/Parent Scores
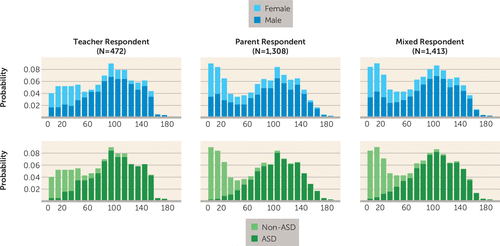
FIGURE 1. Distribution of Total Raw Scores From the Social Responsiveness Scale in Offspring From the Autism Genetic Resource Exchangea
a Social Responsiveness Scale scores form a roughly bimodal distribution corresponding to autism spectrum disorder (ASD) diagnosis. Consistent with the sex bias in ASD, males tend to have higher Social Responsiveness Scale sores, indicating more severe social deficit. Distributions are highly similar regardless of respondent; the larger number of participants with low Social Responsiveness Scale scores from parent respondents reflects ascertainment bias, since unaffected children more typically were assessed by parents but not by teachers.
Genomewide Linkage Analysis
Using an independent set of 52,354 autosomal SNPs pruned for linkage disequilibrium (see Method section), we performed nonparametric multipoint linkage analyses for social responsiveness as a quantitative trait in 590 families from the Autism Genetic Resource Exchange (Figure 2). We observed genomewide significant linkage for social responsiveness on chromosome 8p21.3 centered at rs6587004 (37.6 cM), with a maximum multipoint LOD score of 4.11 (Figure 3) (28). The two-LOD interval encompassing the linkage peak at chr8p21.3 spans approximately 5.7 cM and 2.9 Mb (rs1316738 to rs17088602). While we report the name and location of the peak SNP for interest, we define a two-LOD drop on either side of the linkage peak as the region of interest in which the causal variant(s) are most likely to be found.
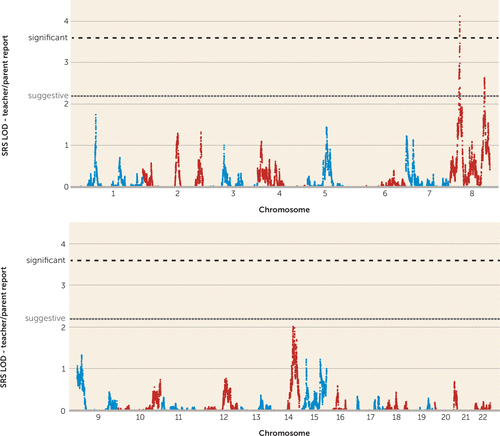
FIGURE 2. Nonparametric Linkage Scan for Social Responsiveness as a Quantitative Trait in 590 Families From the Autism Genetic Resource Exchange Using Teacher/Parent Reportsa
a Gray and black dotted lines denote thresholds for genomewide suggestive (LOD ≥2.2) and significant (LOD ≥3.6) evidence for complex trait linkage, respectively. SRS=Social Responsiveness Scale.
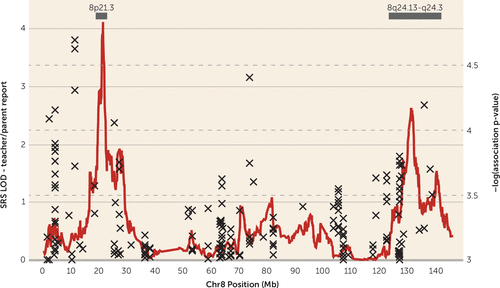
FIGURE 3. Linkage and Association for Social Responsiveness Scale (SRS) Scores, Teacher/Parent Report, on chr8p21.3 and 8q24.22a
a Genomewide significant evidence for linkage (peak LOD=4.11) is observed at chr8p21.3, and suggestive evidence for linkage (peak LOD=2.63) is observed at chr8q24.22. The “x” indicates association signal for SRS score as a quantitative trait using imputed single-nucleotide polymorphism genotype data. Bars indicate the two-LOD regions of interest.
We also observed suggestive evidence for linkage (LOD ≥2.2) (28) on chr8q24.22 with multipoint LOD of 2.63 (peak SNPs rs2959319 at 139.8 cM and rs6470838 at 140.1 cM) (Figure 3). The two-LOD interval for the peak at chr8q24.22 spans approximately 35.3 cM and 18.5 Mb (rs10956146 to rs6583595). Linkage signals with LOD ≥2.2 were not observed elsewhere in the genome (Figure 2).
We considered whether the use of teacher and parent scores interchangeably in our analyzed phenotype might introduce noise to the analysis, and we reanalyzed the subset of 536 families in which the Social Responsiveness Scale score was contributed by a parent (see Table ST1 in the data supplement). Using parent scores only, we again observed genomewide significant evidence for linkage at chr8p21.3 (multipoint LOD=3.65, rs6587004 at 37.6 cM), as well as at chr8q24.22 (multipoint LOD=4.54, rs10505568 at 141.0 cM) (see Figures SF2 and SF3 in the data supplement). The significant linkage signal at chr8q24.22 obtained using parent scores overlaps with the suggestive linkage signal observed using teacher/parent scores, as described above. All other LOD scores observed were ≤1.5. Persistence of the linkage signal at chr8p21.3 and enhancement of the previously suggestive signal at 8q24.22 in the analysis limited to parent-reported scores suggests that the observed linkage signals are robust to any phenotypic noise introduced by differences in the individual performing the Social Responsiveness Scale evaluation and that biological variants underlying social communication exist in these two regions of chr8.
Genomewide and Linkage-Directed Association
We next undertook quantitative association analyses in an attempt to identify common genetic variants that may contribute to social responsiveness in families from the Autism Genetic Resource Exchange. A larger cohort of 1,652 nuclear families, including trios that were not informative for linkage analyses, was analyzed for genomewide association to the Social Responsiveness Scale teacher/parent scores using >5.8 million genotyped and imputed autosomal SNPs. The quantile-quantile plot showed no evidence for score inflation in this family-based analysis. The SNP showing the strongest association with Social Responsiveness Scale scores was rs4689064 on chr4p16.1 (p=2.12×10⁻⁶) (Figure 4). This SNP is intronic to TADA2B (transcriptional adaptor 2 [ADA2 homolog]; OMIM 608790), which coordinates histone acetyltransferase activity and links activation factors to basal transcription machinery to potentiate transcription. The genomic region has been implicated in a variety of phenotypes, including systemic lupus erythematosus (OMIM 605480), spastic paraplegia (OMIM 612335), and Stargardt disease 4 (OMIM 306786). We also observed modest evidence for association at rs5997325 on chr22q12.1 (p=2.65×10⁻⁶) between genes PITPNB (phosphatidylinositol transfer protein, beta) and TTC28 (tetratricopeptide repeat domain 28). This general region has been implicated in multiple disorders such as epilepsy (OMIM 604364), spinal muscular atrophy (OMIM 615048), and myopia (OMIM 608908).
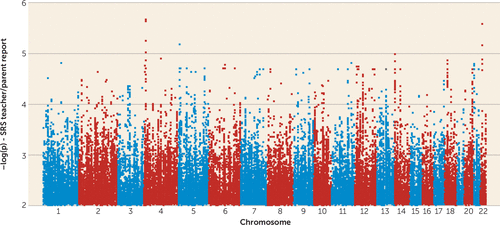
FIGURE 4. Genomewide Association Results for Social Responsiveness Scale (SRS) Teacher/Parent Reportsa
a Quantitative association analyses for SRS were performed using the QFAM option in PLINK (see reference 23).
We specifically examined association signals in the two-LOD intervals underlying the linked regions of interest on chr8p21.3 and chr8q24.22 (Figure 5). For Social Responsiveness Scale teacher/parent scores, there was no significant evidence for association after correction for multiple testing. Similarly, we examined association scores for autism diagnosis as a qualitative trait and found no significant evidence for association in the two-LOD intervals underlying the linked regions of interest. The use of imputed SNP genotypes and a cosmopolitan reference panel from the 1,000 Genomes Project (25, 26) greatly enhances genome coverage over the genotyped marker set, hence increases our ability to detect association. The lack of association observed here suggests two likely scenarios: 1) our study remains underpowered to detect common variants of small effect, which may contribute to variation in social responsiveness; and 2) rare variants may contribute to social responsiveness.
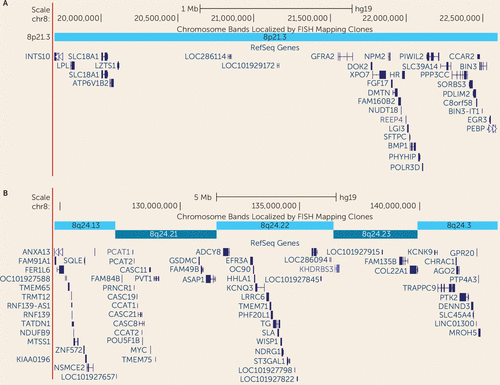
FIGURE 5. Genes in the Two-LOD Regions of Interest Underlying the Linkage Peaks at chr8p21.3 and 8q24.22 in the Two-LOD Regiona
a Regions correspond to the linkage peaks indicated by bars in Figure 3.
Discussion
We took an endophenotype approach to the identification of genetic loci contributing to autism spectrum disorder by searching for genetic factors influencing social responsiveness. Using a combination of teacher-reported and parent-reported scores from the Social Responsiveness Scale as a quantitative trait, we extended previous linkage studies performed in the Autism Genetic Resource Exchange cohort to a sample size of 590 families (16). The use of teacher reports when available is thought to more accurately reflect a child’s social skills in the context of an average group of peers. We note a bimodal distribution of Social Responsiveness Scale scores among parent respondents, consistent with ascertainment bias, in which non-autistic children are less likely to have been evaluated by their teachers. The bimodal distribution is also consistent with a possible rater contrast effect, in which the contrast in social skills between autism spectrum disorder and non-autism spectrum disorder siblings leads parents to underestimate social impairment in the non-autism spectrum disorder sibling and subsequently reduces study power (16).
The observation of a unimodal teacher-report Social Responsiveness Scale distribution for males suggests a continuum of expression of autistic trait liability across all or most males in this clinically ascertained sample of largely multiplex families. This, and the presence of a bimodal distribution for females in the same cohort, replicates previous reports of contrasting distributions between males and females in multiplex autism families (3, 29). These contrasts support sex differential expression of phenotypic features of social cognition in the setting of familial liability to autism, which may substantially contribute to the gender ratio for autism observed throughout the general population.
Our linkage analysis of 590 families from the Autism Genetic Resource Exchange identified a novel locus on chr8p21.3, which exceeds the criteria set by Lander and Kruglyak (28) for genomewide significant linkage in a complex trait using combined teacher/parent Social Responsiveness Scale scores. The two-LOD region of interest at chr8p21.3 includes 34 genes (Figure 5A). While the causal variant(s) may reside anywhere in the interval, we note with interest that the peak SNP (rs6587004) lies in an intronic region of GFRA2 (glial cell line-derived neurotrophic factor [GDNF] family receptor alpha-2; OMIM 601956), which encodes a cell-surface receptor for neurotrophic factors involved in neuron survival and differentiation. The region has been implicated in epilepsy (OMIM 612279) and schizophrenia (OMIM 603013) through linkage approaches, although no causal genes have been identified.
Using a subset of 536 families with parent-only Social Responsiveness Scale reports, we identified a second genomewide significant linkage peak at chr8q24.22. The peak SNP on chr8q24.22 lies in a gene-poor region between ASAP1 (ArfGAP with SH3 domain, ankyrin repeat and PH domain 1; OMIM 605953) and ADCY8 (adenylate cyclase 8 [brain]; OMIM 103070). Among the 68 genes in the linked interval (Figure 5B), we also note with interest KCNQ3, a potassium channel gene implicated in benign neonatal seizures (OMIM 602232); TRAPPC9, a gene encoding a trafficking protein implicated in autosomal recessive mental retardation (OMIM 611966); and KCNK9, a potassium channel gene implicated in Birk-Barel mental retardation dysmorphism syndrome (OMIM 605874). Our region of interest may overlap with a previously reported linkage signal at chr8q24.13 for social responsiveness (posterior probability of linkage=0.37) (30). Previous studies in the Old Order Amish identified significant evidence for linkage to mental health wellness in this region (OMIM 603663). Reanalysis of the data using a subset of families with parent-reported scores supports our hypothesis that teacher- and parent-reported scores can be combined and analyzed as a single trait.
The use of endophenotypes in psychiatric disease has been debated as a means of increasing power to find genetic variants by focusing on simpler aspects of complex behavioral traits (6–8). Previously, we used another quantitative trait related to delay of spoken language to identify association to the CNTNAP2 gene (31). While previous linkage studies of social responsiveness and autism spectrum disorder in 99 families from the Autism Genetic Resource Exchange found no loci shared between the traits, we note with interest that the linkage peak for social responsiveness at chr8p21.3 (N=590 families) colocalizes with a linkage signal for autism spectrum disorder as a qualitative trait in a substantially larger set of Autism Genetic Resource Exchange families (N=1,008 families; multipoint LOD=2.18) (16, 32). Our data support the use of quantitative intermediate traits such as social responsiveness to increase power by reducing heterogeneity in a complex trait such as autism spectrum disorder and identify a highly significant, narrow linked region on chromosome 8p21.3, as well as provide strong evidence for linkage on chromosome 8q24.22.
The genetic heterogeneity of both autism spectrum disorder and social responsiveness are underscored by the lack of consistency between our present findings and those of previous reports, a common theme in autism spectrum disorder (1, 33). We previously reported a microsatellite linkage scan for teacher-reported social responsiveness in 99 families from the Autism Genetic Resource Exchange with suggestive evidence for linkage on chromosomes 11 and 17 (16). Suggestive linkage in the subset of families with only male affected individuals was observed on chromosome 8 at 100 cM (16); however, the signal does not overlap with the findings reported in the present study. Coon et al. (15) performed linkage analyses for Social Responsiveness Scale scores in 64 multiplex families and identified significant nonparametric linkage to chr15q13.3 (LOD=3.64) and suggestive linkage to chr7q31.1-q32.3 (LOD=2.91). In a collection of 70 families segregating autism spectrum disorder with or without language impairment, Bartlett et al. (34) reported strong linkage to social responsiveness as a quantitative trait at chr15q26.2–26.3 and as a dichotomous trait at chr14q32.2–32.33. These studies found little or no evidence for linkage on chromosome 8p21.3 or 8q24.22; we observed a similar lack of signal in their regions of interest.
We considered whether families contributing to the linkage peak could be distinguished from families showing evidence against linkage. However, we examined genotyping platform, individual and family mean Social Responsiveness Scale scores, age at which the Social Responsiveness Scale and the Autism Diagnostic Interview–Revised were administered, Vineland Adaptive Behavior Scales scores, Stanford-Binet IQ full scores, and family size and found no significant differences between linked and unlinked families in each of these factors.
Association analyses using imputed SNP genotypes, both genomewide and in the linked regions, showed little evidence for common variants contributing to Social Responsiveness Scale scores. We also saw little evidence for association with autism spectrum disorder in the genomic regions linked to social responsiveness. The lack of common variant signal is unsurprising given the genetic and phenotypic heterogeneity of a behavioral trait related to social cognition. Association studies of autism spectrum disorder in larger cohorts have found only a handful of variants, each of small effect, despite sample sizes several-fold greater than that used in the present study (22, 35, 36).
Together, findings from our study and from others are consistent with the increasingly recognized role of rare variants in the genetic architecture of autism spectrum disorder (37). Like autism spectrum disorder, social cognition is a complex behavioral trait, but one that we expect is narrower than the broad diagnosis of autism spectrum disorder. Rapid expansion of the human population may have given rise to rare variants influencing variation in social responsiveness, and ever-larger sample sizes will be needed to identify such variants (38). The brevity and ease of administration of the Social Responsiveness Scale and its correlation with traditional autism diagnostics, such as the Autism Diagnostic Interview–Revised and the Autism Diagnostic Observation Schedule, make it feasible to recruit larger cohorts for the study of social responsiveness in general, as well as indicate the scale's value as a rapid screening tool for autism spectrum disorder in population-based research (39, 40).
Conclusions
The identification of two strong loci for social responsiveness validates the use of quantitative intermediate traits to facilitate identification of genetic variants contributing to complex traits such as autism spectrum disorder. While causal mutations have yet to be identified, these findings underscore the increasingly recognized role of rare inherited variants in the genetic architecture of autism spectrum disorder. Future approaches to the discovery of rare variants conferring susceptibility to autism spectrum disorder, and their convergence on genes that participate in and elucidate mechanisms of causation in autism, will be facilitated by quantitative approaches to linking genetic variation, neural signatures, and behavior in large family studies. Here, we have demonstrated the ability to identify susceptibility loci using this approach and have clarified contrasting distributions for quantitative traits in males compared with females, which likely reflect protective factors contributing to the observed sex ratios in familial autistic syndromes.
1 : Genetic architecture in autism spectrum disorder. Curr Opin Genet Dev 2012; 22:229–237Crossref, Medline, Google Scholar
2 : Characteristics and concordance of autism spectrum disorders among 277 twin pairs. Arch Pediatr Adolesc Med 2009; 163:907–914Crossref, Medline, Google Scholar
3 : Sibling recurrence and the genetic epidemiology of autism. Am J Psychiatry 2010; 167:1349–1356Link, Google Scholar
4 : Autism recurrence in half siblings: strong support for genetic mechanisms of transmission in ASD. Mol Psychiatry 2013; 18:137–138Crossref, Medline, Google Scholar
5 : Broader autism phenotype: evidence from a family history study of multiple-incidence autism families. Am J Psychiatry 1997; 154:185–190Link, Google Scholar
6 : The endophenotype concept in psychiatry: etymology and strategic intentions. Am J Psychiatry 2003; 160:636–645Link, Google Scholar
7 : Recent progress in psychiatric genetics-some hope but no hype. Hum Mol Genet 2000; 9:927–935Crossref, Medline, Google Scholar
8 : The role of phenotype in gene discovery in the whole genome sequencing era. Hum Genet 2012; 131:1533–1540Crossref, Medline, Google Scholar
9 : Autistic traits in the general population: a twin study. Arch Gen Psychiatry 2003; 60:524–530Crossref, Medline, Google Scholar
10 : The quantitative nature of autistic social impairment. Pediatr Res 2011; 69:55R–62RCrossref, Medline, Google Scholar
11 : SRS: Social Responsiveness Scale Manual. Los Angeles, Western Psychological Services, 2012Google Scholar
12 : Genetic structure of reciprocal social behavior. Am J Psychiatry 2000; 157:2043–2045Link, Google Scholar
13 : Deficits in reciprocal social behavior in male twins: evidence for a genetically independent domain of psychopathology. J Am Acad Child Adolesc Psychiatry 2003; 42:458–467Crossref, Medline, Google Scholar
14 : Intergenerational transmission of subthreshold autistic traits in the general population. Biol Psychiatry 2005; 57:655–660Crossref, Medline, Google Scholar
15 : Genome-wide linkage using the Social Responsiveness Scale in Utah autism pedigrees. Mol Autism 2010;1:8Crossref, Medline, Google Scholar
16 : A quantitative trait locus analysis of social responsiveness in multiplex autism families. Am J Psychiatry 2007; 164:656–662Link, Google Scholar
17 : Understanding sex bias in autism spectrum disorder. Proc Natl Acad Sci USA 2013; 110:4868–4869Crossref, Medline, Google Scholar
18 : Examining and interpreting the female protective effect against autistic behavior. Proc Natl Acad Sci USA 2013; 110:5258–5262Crossref, Medline, Google Scholar
19 : Changing the landscape of autism research: the Autism Genetic Resource Exchange. Neuron 2010; 68:187–191Crossref, Medline, Google Scholar
20 : ADI-R Autism Diagnostic interview Revised. Manual. Los Angeles, Western Psychological Services, 2003Google Scholar
21 : ADOS: Autism Diagnostic Observation Schedule Manual. Los Angeles, Western Psychological Services, 2001Google Scholar
22 : Common genetic variants on 5p14.1 associate with autism spectrum disorders. Nature 2009; 459:528–533Crossref, Medline, Google Scholar
23 : PLINK: a tool set for whole-genome association and population-based linkage analyses. Am J Hum Genet 2007; 81:559–575Crossref, Medline, Google Scholar
24 : A flexible and accurate genotype imputation method for the next generation of genome-wide association studies. PLoS Genet 2009; 5:e1000529Crossref, Medline, Google Scholar
25 1000 Genomes Project. http://www.1000genomes.org/Google Scholar
26 : A map of human genome variation from population-scale sequencing. Nature 2010; 467:1061–1073Crossref, Medline, Google Scholar
27 : Merlin: rapid analysis of dense genetic maps using sparse gene flow trees. Nat Genet 2002; 30:97–101Crossref, Medline, Google Scholar
28 : Genetic dissection of complex traits: guidelines for interpreting and reporting linkage results. Nat Genet 1995; 11:241–247Crossref, Medline, Google Scholar
29 : Familial aggregation of quantitative autistic traits in multiplex versus simplex autism. Am J Med Genet B Neuropsychiatr Genet 2009; 150B: 328–334Crossref, Medline, Google Scholar
30 : A molecular genetic study of autism and related phenotypes in extended pedigrees. J Neurodev Disord 2013; 5:30Crossref, Medline, Google Scholar
31 : Linkage, association, and gene-expression analyses identify CNTNAP2 as an autism-susceptibility gene. Am J Hum Genet 2008; 82:150–159Crossref, Medline, Google Scholar
32 . Replication of linkage at chromosome 20p13 and identification of suggestive sex-differential risk loci for autism spectrum disorder. Mol Autism 2014; 5:13Crossref, Medline, Google Scholar
33 : Advances in autism genetics: on the threshold of a new neurobiology. Nat Rev Genet 2008; 9:341–355Crossref, Medline, Google Scholar
34 : A genome scan for loci shared by autism spectrum disorder and language impairment. Am J Psychiatry 2014; 171:72–81Link, Google Scholar
35 : A genome-wide linkage and association scan reveals novel loci for autism. Nature 2009; 461:802–808Crossref, Medline, Google Scholar
36 : A genome-wide scan for common alleles affecting risk for autism. Hum Mol Genet 2010; 19:4072–4082Crossref, Medline, Google Scholar
37 : Genetic architectures of psychiatric disorders: the emerging picture and its implications. Nat Rev Genet 2012; 13:537–551Crossref, Medline, Google Scholar
38 : Finding the missing heritability of complex diseases. Nature 2009; 461:747–753Crossref, Medline, Google Scholar
39 : Rapid quantitative assessment of autistic social impairment by classroom teachers. J Am Acad Child Adolesc Psychiatry 2007; 46:1668–1676Crossref, Medline, Google Scholar
40 : Accuracy of phenotyping of autistic children based on Internet implemented parent report. Am J Med Genet B Neuropsychiatr Genet 2010; 153B:1119–1126Medline, Google Scholar


