Special Section on the GAF: Relationship Between the Global Assessment of Functioning and Other DSM Axes in Routine Clinical Work
Abstract
OBJECTIVES: The aim of this study was to investigate the validity of the Global Assessment of Functioning (GAF) when routinely used in clinical work by focusing on the relations between the GAF, other axes in the DSM system, and some demographic variables conceptually derived on theoretical and clinical grounds. METHODS: A clinical database containing data for 5,538 patients assessed by 181 raters as a part of routine practice in psychiatric outpatient settings in Sweden was used. A hierarchical linear regression model and a variance component model were used to analyze the data. Regression models were also used to determine how the relation between the GAF and axis I depends on the selection of diagnostic groups in the sample. RESULTS: Seventeen percent of the systematic variance in GAF scores was explained by diagnostic differences as defined on DSM-IV axis I, and 5.1 percent was explained by psychosocial and environmental problems as measured on DSM-IV axis IV. Unexpectedly, the site of the investigation explained another 3.6 percent of the variance. CONCLUSIONS: The GAF can be used as a comprehensive measure of global mental health in routine clinical work for assessment and for outcome management.
The Global Assessment of Functioning (GAF) (1) is the fifth axis in the DSM system. The purpose of the scale is to measure global severity of psychiatric illness by focusing on a patient's social, psychological, and occupational functioning. The GAF can be used to assess level of functioning and to measure the outcome of treatment. However, the usefulness of the scale depends on the reliability and validity of regular ratings in the clinical setting.
In the study reported here, we addressed the question of validity by using data from a clinical database, focusing on the relationship of the GAF with the other axes in the DSM. Our purpose was to determine whether the systematic variation in assessments was as would be expected on theoretical and empirical grounds.
The DSM system is organized around five independent axes: axis I, psychiatric diagnoses; axis II, personality disorder; axis III, general medical conditions; axis IV, psychosocial and environmental problems; and axis V, the GAF. Because the GAF is defined as a comprehensive scale of mental health, based on functioning and symptoms, an association between axes I, II, IV, and the GAF is inherent in the system. Thus it is possible to conceptually derive relationships between the GAF and those axes. In this article we outline such relations.
Several diagnostic criteria on axes I and II include aspects of functioning. For example, the B criterion for schizophrenia states: "For a significant portion of time … one or major areas of functioning such as work, interpersonal relations, or self-care are markedly below the level achieved prior to the onset" (2). This criterion implies a strong association between axis I and the GAF. Another example is the C criterion for major depressive disorder: "The symptoms cause clinically significant distress or impairment in social, occupational, or other important areas of functioning" (2). This criterion shows that a decrease in GAF scores should be expected for patients with major depressive disorder. For axis II, a relation to GAF scores can be expected as well. The C criterion for personality disorder in DSM-IV-TR (2) focuses on an "enduring pattern" that "leads to clinically significant distress or impairment in social, occupational, or other important areas of functioning" (2). However, no association between axis III (general medical conditions that are potentially relevant to the understanding of the mental disorder) and the GAF should be expected, because the instruction to the GAF points out that impairment in functioning due to physical limitations should not be considered. However, axis IV (psychosocial and environmental problems) can be expected to be systematically related to GAF scores, because it is reasonable to assume that patients with more psychosocial and environmental problems have lower GAF scores in all diagnostic groups.
Several studies have focused on the association between GAF scores and other measurements related to diagnoses or symptoms. Most studies have shown that about 20 percent of the variance in GAF scores can be explained by differences in diagnoses or symptoms (3,4,5,6,7,8). The results of a study by Robert and colleagues (9) deviated from this pattern, showing an explained variance in GAF due to DSM axis I of 63.9 percent. Coffey and associates (10) found that lower GAF scores were associated with schizophrenia, major depression, and personality disorders.
In the study reported here, we empirically assessed the relationship between the GAF, the other axes of the DSM, and a number of demographic variables extrinsic to the DSM system. Our hypotheses were that there would be a relationship between GAF scores and diagnoses on axes I and II, that there would be no relationship between GAF scores and general medical conditions on axis III, and that there would nevertheless be a relatively strong relationship between GAF scores and psychosocial problems on axis IV. In addition, we demonstrated how the amount of systematic variance in GAF scores explained by axis I depends on the selection of diagnostic groups in the sample.
Methods
In the county of Dalarna, Sweden, public psychiatric outpatient care is provided at 14 different sites, one in each rural district. Each site has its own catchment area and is responsible for all psychiatric care to inhabitants over the age of 17 years. The catchment areas vary in population from 6,000 to 55,000 inhabitants. Each site has the same responsibilities, and there is a direct link between the number of inhabitants and the site's budget.
A database of clinical data was started at the request of the county clinical board to be used for outcome studies and quality assurance but was not to be used for performance ratings or economic allocation. A report covering the quality of the work has been delivered to each site every year. For example, GAF scores have been used to calculate effect sizes for different diagnostic groups.
The clinical staff enter their assessments into the database at intake and discharge, along with data about the treatment methods. The occupational groups are psychologists, consultant psychiatrists, residential psychiatrists, social workers, psychiatric assistant nurses, and psychiatric nurses. All team members are trained to make provisional diagnostic assessments according to DSM-IV. The provisional diagnoses are usually discussed and approved by the team before being entered into the database. A few of the staff have received a two-hour course in using the GAF; apart from this, no systematic training program on the GAF has been offered. The frequency with which the staff use the scale varies from just a few assessments per year to every day.
In this study, data for all 10,234 patients who were included in the database between January 1, 1997, and the end of June 2000 were used. To generate the sample, 1,795 patients who missed GAF ratings and 1,027 who missed diagnosis were excluded. In addition, six sites with a total of 1,874 patients were excluded because they had fewer than five patients in one or more diagnostic groups. Only the primary diagnosis was used. The last step was implemented to make the analyses more powerful. This procedure resulted in a sample of 5,538 patients representing eight different DSM-IV classification groups on axis I and six sites. The distribution of diagnoses, sex, and age of the final sample was compared with that of the original database to ascertain the representativeness of the sample. Only a small number of patients were assessed on axis II, and all of these assessments were treated as an extension to axis I in the analyses. The assessments in the sample were made by 181 regular staff members. The clinical board approved the study.
The independent variables are reported descriptively as mean±SD GAF scores. The association with GAF scores was assessed by using the eta-squared statistic, which is an expression for the percentage of variance explained by a factor in an analysis of variance (ANOVA). Eta squared is a universal measure of the relationship between variables and is therefore a useful supplement to the test of significance (F test), because it provides information about how the different variables affect GAF scores (11). With large samples, as in this study, very small differences become significant. For example, an eta-squared value of .001 represents a significant difference. Thus the numerical value of eta squared provides more information about how the different variables affect GAF scores than ordinary tests of significance.
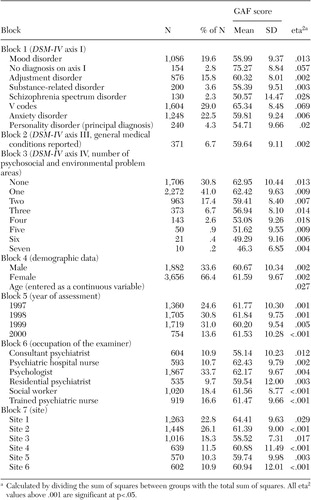
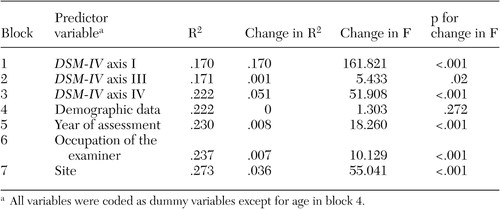
To investigate the association between GAF ratings and the other DSM axes and extrinsic demographic variables, two different statistical analyses were conducted. First, a hierarchical linear multiple regression model was constructed to calculate the R2 values. In this model, the GAF scores were the dependent variable, and the independent variables were entered into the model in blocks by using the enter methods, with all variables within a block entered in a single step. The change in R2 shows the amount of unique variance explained by every new block added to the model. Because the focus of this study was the relation between the GAF and other DSM axes, the diagnoses on DSM axis I were entered as dummy variables in the first block, followed by axis III, axis IV, the demographic variables, and, finally, site. The change in R2 for site represents the unique variance explained when all other factors have been accounted for. The blocks are outlined in Table 1.
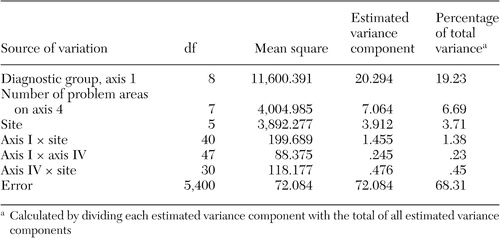
In the second analysis, we investigated the interaction terms among the three factors that explained most of the systematic variance in GAF ratings according to the hierarchical regression analysis: axis I, axis IV, and site. For this purpose a variance component model, ANOVA type I, was calculated. This model has the advantage of making it possible to enter the variables in a hierarchical way and to obtain an estimate of the size of the variables' interactions. The factors were entered in the same order as in the regression model.
The advantage with hierarchical methods compared with, say, correlations, is that the hierarchical design controls for the covariance between the factors in the model. The result is the unique systematic variance in GAF scores for each factor.
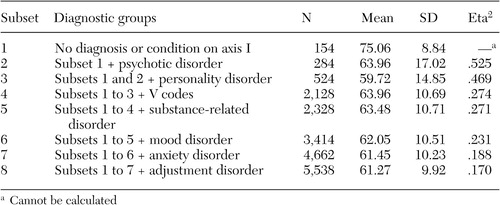
Finally, a set of regression models were constructed to demonstrate how the amount of systematic variance in GAF scores depends on the selection of diagnostic groups on axis I.
All statistics were calculated with use of SPSS 10.1.4.
Results
The analysis of the differences between the study sample and the patients in the original database showed only small, nonsignificant differences. The mean age of the study sample was 41.27±13.92 years and of the patients in the original database was 42.67±14.92 years. The sex distribution in the sample was 66 percent women and 34 percent men, compared with 65 percent women and 35 percent men in the original database. The mean GAF score for the study sample (N=5,538) was 61.24±9.92. (Possible scores range from 0 to 100, with higher scores indicating better functioning.) Descriptive data for the different variables are shown in Table 1.
As can be seen in Table 1, the mean GAF scores for different diagnostic groups in block 1 were in line with our hypotheses; for example, the group without diagnoses on axis I had the highest mean score, followed by the V-codes group and the group with adjustment disorders. Patients with mood disorders, anxiety disorders, eating disorders, or substance-related disorders had scores that were a few points lower. The two groups with the lowest mean GAF scores were those with personality disorders and schizophrenia spectrum disorders. The mean for block 2 (general medical conditions) was only marginally lower than for patients without medical problems. In block 3 (psychosocial and environmental problems), a greater number of reported problem areas was associated with a lower GAF score. The patient's sex was not related to GAF score, but age seemed to have some association, according to block 4. The lowest mean GAF scores in block 6 (occupation of the assessor) were scores derived by consultant psychiatrists. In block 7, the differences among sites were larger than expected.
As can be seen in Table 2, the multiple regression model explained a total of 27.3 percent of the systematic variance in GAF scores. Block 1 (axis I) and block 3 (axis IV) contributed substantially to explaining the variance in GAF scores (17 percent and 5.1 percent, respectively). Block 2 (axis III) contributed only .1 percent. Demographic measures extrinsic to the DSM system in block 4, 5, and 6 contributed very little to the variance in GAF scores, except for site in block 7, which unexpectedly contributed 3.6 percent. This is an intriguing result given that site was entered as the last block, which means that this variance in GAF scores is purely related to site.
In the model presented in Table 3, almost the same main effects were observed as in the multiple regression model, although this analysis considered the variables as random. Thus the result might be possible to generalize and is not restricted to the specific values of the variables we used. The model shows that the interaction effect between axis I and site accounted for 1.38 percent of the variance in GAF scores, which suggests that there were systematic differences in how sites rated the diagnostic groups.
The third analysis was made to highlight the difficulty of comparing estimates of systematic variance in GAF scores attributable to diagnoses on axis I in various studies. The difficulty arises because all estimates rely on a comparison of variance between cluster means relative to variance within cluster groups. Thus, for example, groups that are extremely different in terms of average GAF scores will produce higher estimates. The results of the third analysis, which demonstrated how the amount of variance explained by the GAF depends on the number of diagnostic groups and their average GAF score, is shown in Table 4. The third analysis started with calculating the explained variance in GAF scores by using a subsample consisting of the two diagnostic groups with the highest and the lowest mean GAF scores—the group with no diagnoses and the group with schizophrenia spectrum disorders. For this particular subsample (N=284), eta squared was .525, which means that diagnoses on axis I explained a total of 52.5 percent of the variance in the GAF scores. Next, data for the diagnostic group with the greatest squared Euclidean distance to the mean GAF score for the whole sample were entered one by one into the former subsample. For every new subsample that was created, eta squared was calculated.
Discussion
The observed systematic variation in GAF scores was almost in line with our hypotheses. As expected, DSM-IV axis I explained the highest amount of variance of the scale, followed by DSM-IV axis IV. The relationship between GAF scores, diagnoses, and symptoms is a logical consequence of the fact that, in the DSM system, diagnoses constitute groups of symptoms, and many diagnostic criteria focus on functioning ability. Furthermore, the internal variation within axes I and IV was in line with our hypotheses. Thus the results support the use of the GAF as a comprehensive measure of psychiatric mental health when used routinely in clinical psychiatric work.
However, some results need further attention. The main problem seems to be that site by itself showed an association of 3.6 percent in the regression model. This result means that at individual sites, a given diagnostic group or condition consistently attained higher or lower scores. The unexpectedly high variance that was explained by site and the interaction between site and diagnoses on axis I show that it is primarily diagnoses that are rated differently among sites. It remains to be determined whether this problem is a reflection of real differences within certain diagnostic groups or a systematic bias in GAF scoring among local clinician groups.
The fact that age explained 2.7 percent of variance in the ANOVA might be due to the covariance between age and diagnoses. In the regression model, demographic variables, of which age is one, showed no association with GAF scores, because diagnoses were entered before age, which means that the variance in scores due to the association between age and diagnoses had already been accounted for in the first block. A closer look showed that the mean ages for the group with a mood disorder and the group with a schizophrenia spectrum disorder were significantly higher than for the other diagnoses.
To evaluate the association between different variables and GAF scores as estimated by eta squared and R2, the design of the study has to be considered. The results are dependent both on the difference in average GAF scores among the groups in the study and on the number of groups included. In general, a large difference in average GAF scores will be associated with a high estimate and a large number of groups with a lower estimate. Given these systematic relations, the sample should be representative of the population for which the estimate is intended. We used a database containing information for all outpatient visits during four years, which means that our result of 17 percent covariance between GAF scores and diagnoses is a good estimate of the interrelatedness of GAF scores and major diagnostic groups in an outpatient population. This result compares well with results from other studies, for example, Hilsenroth and colleagues (4), Yamauchi and associates (6), Roy-Byrne and colleagues (5), Endicott and associates (3), and Skodal and colleagues (8), in which almost the same association between GAF scores and diagnoses was found. This consistency of results reinforces the credibility of the estimate.
Conclusions
The study showed a systematic variation in the GAF, which was as we expected and is in line with the results of several studies, when used routinely in clinical work over several years. GAF scores are related to several important factors, such as diagnoses, symptoms, functioning, and psychosocial problems, which suggests that this instrument may be considered a global measurement of mental health. This internal consistency within the axes of the DSM system supports the validity of the GAF. It should be possible to use the GAF for assessment and outcome monitoring in clinical settings.
Acknowledgments
This study was supported by grant 420011 from the Center for Clinical Research in Dalarna, Switzerland.
Mr. Tungström and Mr. Söderberg are affiliated with the psychiatric research and development department of Säter, Sweden, and the department of psychology of the University of Umeå in Sweden, with which Dr. Armelius is affiliated. Send correspondence to Mr. Tungström at Psykiatrins Utvecklingsenhet, Box 350, S-783 27, Säter, Sweden (e-mail, [email protected]). This article is part of a special section on the Global Assessment of Functioning scale.
 |
Table 1. Multiple regression model of relationship between the Global Assessment of Functioning (GAF) and other DSM axes, with GAF scores as the dependent variable (N=5,538)
 |
Table 2. Hierarchical multiple regression analysis of association between the Global Assessment of Functioning (GAF) and other DSM axes, with GAF scores as the dependent variable (N=5,538)
 |
Table 3. Components of estimated variance in Global Assessment of Functioning (GAF) scores for axis I, axis IV, and site as well as two-way interactions, with GAF score as the dependent variable (N=5,538)
 |
Table 4. Explained variance (eta2) in Global Assessment of Functioning (GAF) scores due to differences in axis I diagnoses, depending on number of diagnostic groups and sample size (N=5,538)
1. Diagnostic and Statistical Manual of Mental Disorders, 4th ed. Washington, DC, American Psychiatric Association, 1994Google Scholar
2. Diagnostic and Statistical Manual of Mental Disorders, Text Revision. Washington, DC, American Psychiatric Association, 2000Google Scholar
3. Endicott J, Spitzer RL, Fleiss JL, et al: The Global Assessment Scale: a procedure for measuring overall severity of psychiatric disturbance. Archives of General Psychiatry 33:766–771, 1976Crossref, Medline, Google Scholar
4. Hilsenroth MJ, Ackerman SJ, Blagys MD, et al: Reliability and validity of DSM-IV axis V. American Journal of Psychiatry 157:1858–1863, 2000Link, Google Scholar
5. Roy-Byrne P, Dagadakis C, Unutzer J, et al: Evidence for limited validity of the revised Global Assessment of Functioning scale. Psychiatric Services 47:864–866, 1996Link, Google Scholar
6. Yamauchi K, Ono Y, Baba K, et al: The actual process of rating the Global Assessment of Functioning Scale. Comprehensive Psychology 42:403–409, 2001Crossref, Medline, Google Scholar
7. Garrison WB: Exploring Paths to Global Assessment of Functioning Scale Scores: A Naturalistic Investigation of Psychoanalytic Treatment. Garden City, NY, Adelphi University, Gordon F. Derner Institute of Advanced Psychology Studies, 2001Google Scholar
8. Skodol AE, Link BG, Shrout PE, et al: The revision of axis V in DSM-III-R: should symptoms have been included? American Journal of Psychiatry 145:825–829, 1988Google Scholar
9. Robert P, Aubin V, Dunmarcet M, et al: Effect of symptoms on assessment of social functioning: comparison between axis V of DSM III-R and the Psychosocial Aptitude Rating Scale. European Psychiatry 6:67–71, 1991Google Scholar
10. Coffey M, Jones SH, Thornicroft G: A brief mental health outcome scale: relationships between scale scores and diagnostic/sociodemographic variables in the long-term mentally ill. Journal of Psychiatric and Mental Health Nursing 3:89–93, 1996Crossref, Medline, Google Scholar
11. Nunnally JC, Bernstein IH: Psychometric Theory, 3rd ed. New York, McGraw Hill, 1994Google Scholar


