MRI Hyperintensities and Depressive Symptoms in a Community Sample of Individuals 60–64 Years Old
Abstract
OBJECTIVE: Previous studies have found associations of magnetic resonance imaging (MRI) signal hyperintensities with depression in the elderly. The present study investigates the association in a younger community sample (age 60–64 years) of depressed subjects and comparison groups for potential mediating and confounding variables. METHOD: A subsample of 475 persons 60–64 years of age from a larger community survey underwent brain MRI scans. White matter hyperintensities were quantified by using an automated procedure, and basal ganglia hyperintensities were quantified by using semiquantitative visual ratings. The study also assessed depressive symptoms and use of antidepressant medication. Potential mediating or confounding variables assessed included physical disability, hypertension, stroke, diabetes, head injury, cortisol, thyroid-stimulating hormone, cognitive functioning, smoking, and alcohol use. RESULTS: Depressive symptoms were found to be related to total brain white matter hyperintensities but not to basal ganglia hyperintensities. However, associations disappeared when statistical adjustment was made for physical disability and smoking. CONCLUSIONS: Depressive symptoms are related to white matter hyperintensities in mid-adult life in a community sample. Physical disability appears to play an important role in this association.
Magnetic resonance imaging (MRI) studies of patients with major depression have found a higher prevalence of signal hyperintensities on T2-weighted imaging, particularly in subjects with later depression onset (1). Such findings have influenced the concept of vascular depression, a late-onset subtype of depression that involves increased cardiovascular risk factors and hyperintensities of deep white matter or subcortical gray matter (2, 3).
The early work on hyperintensities and depression was carried out in clinical samples. However, more recently there have been studies in community samples of older people. In a Rotterdam scan study (4), 1,077 persons 60–90 years of age with severe white matter hyperintensities (WMHs) were found to have 3–5 times the risk of depressive symptoms, with the association being stronger for deep than for periventricular WMHs. Similar findings emerged from a scanning study of 92 high-functioning normal elderly volunteers 66–80 years of age (5). Although none of these volunteers had clinical depression, deep WMHs, but not periventricular WMHs, were associated with depressive symptoms. The association was especially strong in individuals carrying the APOE-4 allele. In the Cardiovascular Health Study (6), scans were carried out on 3,236 persons ≥65 years of age, and depressive symptoms were monitored over the subsequent 7 years. Depressive symptoms were associated with small lesions of the basal ganglia, large cortical white matter lesions, and severe subcortical white matter grade.
Most of the research on WMHs and depression has involved elderly samples, and little is known about the association in middle age. Here we report data from a community sample of individuals 60–64 years old that assessed the association between depressive symptoms and white matter and basal ganglia hyperintensities. We also investigated a range of potential mediating or confounding variables that might account for any associations found. These variables were sociodemographic characteristics, physical disability, history of stroke, history of head injury, diabetes, thyroid-stimulating hormone (TSH), cortisol, cognitive functioning, brain atrophy, hypertension, smoking, and alcohol use.
Method
Participants
A community survey was carried out with 2,551 adults 60–64 years of age living in Canberra (Australian Capital Territory) and the neighboring town of Queanbeyan (New South Wales). The participants were part of the PATH Through Life Project, which is a longitudinal study of social, psychological, and biological risk factors for high-prevalence mental health problems. The project involves cohorts initially 20–24, 40–44, and 60–64 years of age, with a plan to conduct follow-up assessments every 4 years for 20 years. Further details on the full PATH Through Life Project have been published previously (7, 8). The present study concerns a subset of the data from the 60–64-year-old cohort. The participants were recruited randomly from the electoral roll (enrollment to vote is compulsory for Australian citizens), with a response rate of 58.3% for the 60–64 age group. When characteristics of this sample were compared to census data on the population, the sample was found to be better educated but similar in marital status and employment status.
Participants were interviewed by a team of professional survey interviewers experienced in epidemiological and social surveys. Most interviews were carried out in the participant’s home, but subjects could also choose to be interviewed at the Centre for Mental Health Research by the same interviewer. Participants were asked to self-complete a questionnaire on a Hewlett-Packard 620LX palmtop personal computer using the Surveycraft software (SPSS Inc., Chicago) for computer-assisted personal interviewing. The interview covered sociodemographic characteristics, anxiety and depression, substance abuse, cognitive function, well-being, physical health, health habits, use of health services, personality, coping styles, early life psychosocial risk factors, and current psychosocial risk factors. The interviewer never saw the answers to these questions presented on the computer. Some basic physical tests were also carried out by the interviewer (e.g., blood pressure, grip strength, visual acuity, lung functioning, memory, reaction time), and the participants were asked to provide a cheek swab from which DNA could be extracted.
During the community survey, respondents were asked whether they would be willing to undergo an MRI scan; 2,076 (81.4%) out of 2,551 said they would. Subsequently, a randomly selected subsample of 622 of the willing 2,076 were invited to undergo a scan, and 478 (76.8%) participated. This subgroup also provided a blood sample. Those who underwent a scan were significantly more likely than the full sample to be of English-speaking background (χ2=5.37, df=1, p=0.02) and had significantly better physical health per the SF-12 physical component score (t=4.30, df=2539, p<0.001), more years of education (t=2.83, df=2544, p=0.005), and better cognitive functioning per the Mini-Mental State Examination (t=3.76, df=2533, p<0.001), the Spot-the-Word test (t=2.04, df=2483, p<0.05), and a recall task (t=3.42, df=2549, p<0.001). However, there was not a significant difference in depressive symptoms (t=1.54, df=2537, p<0.13).
Magnetic Resonance Imaging
All subjects were imaged with a 1.5-Tesla Philips Gyroscan ACS-NT scanner (Philips Medical Systems, Best, the Netherlands) for T1-weighted three-dimensional structural and T2-weighted fluid attenuated inversion recovery (FLAIR) sequence MRI. A scout mid-sagittal image was first acquired to locate anterior to posterior commissure plane. The T1-weighted MRI was acquired in coronal orientation using a T1-FFE sequence with the following parameters: repetition time (TR)/echo time (TE)=28.05/2.64 msec; flip angle=30°; matrix size=256×256; field of view=260×260 mm; slice thickness=2.0 mm; and mid-slice to mid-slice distance=1.0 mm, yielding overcontiguous coronal slices. The FLAIR sequence was acquired in coronal orientation with TR/TE/TI=11000/140/2600 msec; matrix size=256×256; field of view=230×230 mm; slice thickness=4.0 mm, with no gap between slices.
Quantification of Hyperintensities
MRI scans were transferred to an independent Windows NT workstation and visualized by using the software package ANALYZE (Mayo Foundation, Rochester, Minn.). A special computer program written by one of us (W.W.) automatically delineated WMHs in both the periventricular and deep regions, and this was validated against visual ratings. The major steps of the WMH volumetric estimation are as follows: 1) making an age-specific FLAIR template; 2) coregistration of FLAIR and T1 images of the same subject, using FLAIR as the target and T1 as the source; 3) spatial normalization of the coregistered FLAIR and T1 images into Talairach space; 4) detecting and grading WMHs from each FLAIR image, with T1 as a reference, for the removal of false WMH detection caused by artifacts such as partial-volume effect; 5) visual inspection of each WMH map resulting from the computer algorithm, and manual removal of any wrongly classified WMHs from the map; and 6) computing the total WMH volume in each brain and the separate WMH volumes in each lobe and arterial territory using corresponding masks. The details of the process are described elsewhere (9). The absolute volume of total white matter and WMHs were determined, and the percentage of white matter with a hyperintense signal was calculated for each subject. The results of the automated process were examined by an experienced operator for face validity. Twenty scans were processed twice to determine the retest reliability of the procedure, and 100% correspondence was noted. For concurrent validity, the scans were visually rated by two independent clinicians experienced in examining MRI scans on a modified Fazekas scale (10). One hundred scans were rated visually, and the intraclass correlations (ICC) between the automated measures and the visual ratings were modest (whole brain WMHs: ICC=0.43 [F=1.76, df=1, 99, p=0.003]; deep WMHs: ICC=0.63 [F=2.74, df=1, 99, p<0.001); periventricular WMHs: ICC=0.59 [F=2.44, df=1, 99, p<0.001). Pearson correlations were also calculated (whole brain: r=0.79, df=98, p<0.001; deep: r=0.72, df=98, p<0.001; periventricular: r=0.72, df=98, p<0.001). The automated process did not identify hyperintensities in gray matter (e.g., basal ganglia), for which visual ratings on the modified Fazekas scale were used. The interrater reliability (weighted kappa) for these ratings, established on 57 cases, was 1.00 for right basal ganglia extent, 0.89 for left basal ganglia extent, 0.90 for right basal ganglia intensity, and 0.80 for left basal ganglia intensity.
Assessment of Depressive Symptoms and Syndrome
As part of the community survey, participants completed the depression section of the Primary Care Evaluation of Mental Disorders Patient Health Questionnaire (11), which asks about DSM-IV major depression symptoms in the last 2 weeks. This questionnaire was scored to give a continuous scale from 0 to 27 and also to classify participants as having a major or minor depressive syndrome. To be classified with major depressive syndrome, a participant had to have five or more symptoms, including “little interest or pleasure in doing things” or “feeling down, depressed, or hopeless.” For minor depressive syndrome, a person had to have two to four symptoms, including the two specified. Participants were also asked “In the last month, have you taken or used any medications (including herbal remedies) for depression?” In some of the analyses reported below, those who responded “yes” were grouped together with those classified as having a depressive syndrome on the Patient Health Questionnaire.
Assessment of Potential Mediators or Confounders
Age and gender were recorded during the community survey. Participants were asked a series of questions about educational achievements, and these were used to calculate years of education. Physical disability was assessed with the physical component summary of the 12-item Short Form Health Survey (12). History of stroke was assessed by asking “Have you ever suffered a stroke, ministroke or TIA (transient ischemic attack)?” History of head injury was assessed by asking “Have you ever had a serious head injury where you became unconscious for more than 15 minutes?” Diabetes was defined as following a diabetic diet, using oral hypoglycemics or insulin, or having a fasting blood glucose of ≥10. Other blood tests examined were TSH and cortisol levels. Cognitive functioning was assessed with the Mini-Mental State Examination (13). Brain atrophy was measured by dividing cerebrospinal fluid volume by intracranial volume. Blood pressure was measured twice during the interview by using an M4 blood pressure monitor (Omron Healthcare, Bannockburn, Ill.), and values for diastolic and systolic pressure were averaged. Hypertension was defined as subjects either taking medication for hypertension or having a mean systolic blood pressure of ≥160 or a mean diastolic blood pressure of ≥95. Smoking was assessed by the questions “Do you currently smoke?” and “Have you ever smoked regularly?” Alcohol use was assessed with the Alcohol Use Disorders Identification Test (14). Categorical estimates of weekly consumption were derived from the quantity and frequency items of the Alcohol Use Disorders Identification Test as described previously (15). Participants were defined as hazardous/harmful drinkers on the basis of the definitions of the National Health and Medical Research Council (16), namely, 28 or more standard drinks per week for men and 14 or more for women, where one standard drink contains 10 g of alcohol. Abstainers/occasional drinkers included those who did not drink alcohol at all or drank less than monthly.
Statistical Analysis
Initial descriptive analyses involved comparing mean hyperintensities for depression syndrome subjects, nondepressed subjects taking depression medication, and nondepressed subjects not taking depression medication. This comparison was carried out by using estimated marginal means (and 95% confidence intervals) after we adjusted for gender.
Predictors of depression caseness were evaluated by using logistic regression, with the odds ratio used as the index of effect size. Predictors of depression symptom scores were evaluated by using negative binomial regression, which was used in preference to linear regression because of the extreme skew of the score distribution. For the negative binomial regressions, effect size was measured by incidence rate ratios, which give the rate of increase in depression symptoms for each unit increase in the predictor variable (17).
Variables were evaluated as potential mediators or confounders by assessing whether they had a significant Pearson correlation with both depression symptom score and total brain WMHs. If a variable fulfilled both of these conditions, it was entered as a covariate in the logistic and negative binomial regressions predicting depression from hyperintensities. The significance level was set at p<0.05.
Results
There were 475 participants with data for both MRI hyperintensities and depressive symptoms. Given the small number of cases, those with major and minor depressive syndrome were combined into one depression syndrome group. There were 17 participants in the depression syndrome group (five with major and 12 with minor depressive syndrome; mean Patient Health Questionnaire score=10.88 [SD=3.41]). There were 21 participants who were taking depression medication (prescription [N=17] or nonprescription [N=4]) but who were not currently syndromal (mean Patient Health Questionnaire score=5.38 [SD=4.02]), and 437 nondepressed participants not taking depression medication (mean Patient Health Questionnaire score=1.81 [SD=2.12]). English was not the first language of 9.5% of the participants, but this did not differ significantly between the depression groups.
We present the results for WMHs first, then the basal ganglia hyperintensities. Associations with all WMHs and severe WMHs were generally similar, so only the former are presented here. Table 1 shows the mean regional WMH density for the three groups. It can be seen that the depression syndrome subjects had a higher density of WMHs in most regions, while the nondepressed subjects taking depression medication tended to be intermediate between the other two groups. Infarct-like lesions were present in six subjects (1.2%), four subcortical and two cortical. None of these participants was rated as depressed.
An examination of correlations among the regional WMHs found that they were generally high across regions, justifying the use of a total brain WMH score as a global summary measure. The exception was the cerebellum, which was uncorrelated with the other regions.
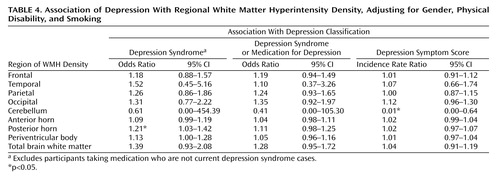
Evaluation of potential mediators or confounders (Table 2) found only three variables that fulfilled the condition of being correlated with both total brain WMHs and depression score. These were physical disability, being a current smoker, and female gender. Mean physical disability scores (with lower scores indicating greater disability) were 44.32 (SD=14.85) for the depression syndrome group, 45.65 (SD=11.56) for the nondepressed subjects taking depression medication, and 50.30 (SD=8.13) for the nondepressed subjects not taking depression medication. The prevalence of smoking in the three groups was 23.5% for the depression syndrome group, 14.3% for the nondepressed subjects taking depression medication, and 6.6% for the nondepressed subjects not taking depression medication. Women comprised 65% of the depression syndrome group, 57% of the nondepressed subjects taking depression medication, and 46% of the nondepressed subjects not taking depression medication. These three variables (gender, smoking, and physical disability) were therefore included as covariates in regression analyses predicting depression from WMHs. Table 3 shows the results adjusted for gender only, and Table 4 shows the results adjusted for gender, smoking, and physical disability. It can be seen that most of the significant associations disappear after adjustment for all three covariates. Only two associations remain significant (out of 27 regression analyses), and one association (cerebellar hyperintensities with depression symptom score) is actually in the opposite direction to prediction. In the regression analyses summarized in Table 4, physical disability was the only variable to significantly predict depression in all 27 analyses. Smoking was significant in 12 of the 18 logistic regression analyses, but in none of the negative binomial regressions. Gender was not significant in any analysis.
Analysis of manual ratings of basal ganglia hyperintensities showed them to be uncommon. For the right basal ganglia, 97% of the sample had no hyperintensities. For the left basal ganglia, the figure was 98%. Regression analyses predicting depression from hyperintensity ratings showed no significant associations.
Discussion
The present study of a community sample of individuals 60–64 years old replicates earlier findings from both clinical and community samples of an association between white matter hyperintensities and depression. While some earlier studies reported associations specifically with deep WMHs (4, 18), the present study found evidence of associations in both frontoparietal and periventricular white matter. This is not surprising given the generally high correlations found between WMHs across these regions. We did not find a specific relationship between depressive symptoms and hyperintensities in the frontal white matter. This is not inconsistent with the literature, since only a few authors have reported such specificity in the association (19).
Contrary to the findings of the Cardiovascular Health Study (6), no associations were found between basal ganglia hyperintensities and depressive symptoms. However, the prevalence of basal ganglia hyperintensities in the present sample was low (only 2%–3%, compared with >25% in the Cardiovascular Health Study), which limits the ability to detect any association. The basal ganglia have received much attention in the depression literature, with many studies having found decreased basal ganglia volumes or hyperintense lesions in these structures in late-onset depression patients (20). It is noteworthy, however, that basal ganglia volumes were found to be normal in depressed subjects who were physically healthy in one study (21). While the focus of our report is hyperintensities rather than the volume of brain structures, this finding raises issues about the relationship among depression, the brain, and physical health, which we will subsequently discuss.
The dominant interpretation of the association between WMHs and depression is that these lesions disrupt frontal-subcortical circuits controlling mood and thereby produce “vascular depression” (3). However, we found that the association between WMHs and depressive symptoms disappeared after statistical adjustment for physical disability and current smoking. In regression analyses in which WMHs, physical disability, and smoking were simultaneously entered as predictors, only physical disability had a significant association with depressive symptoms. This finding is consistent with results from the Cardiovascular Health Study that found MRI infarcts and white matter grade were no longer associated with depressive symptoms after adjustment for physical disability and cognitive impairment (18, 22). The Cardiovascular Health Study also found that physical disability continued to be a strong predictor of depressive symptoms independent of MRI infarcts and white matter grade.
There are a number of possible interpretations of the role of physical disability. The first is that WMHs cause physical disability, which in turn causes depressive symptoms. In other words, physical disability is a mediator or intervening variable in the causal path (23). Consistent with this possibility, several other studies have found that WMHs are associated with physical disability (24), motor impairments (25), and impaired balance (26), and there is evidence that physical disability is a risk factor for depression in older people (27). Another possibility is that WMHs independently cause both depressive symptoms and physical disability; this is less likely, however, since WMHs predict disability after depressive symptoms are controlled but do not predict depressive symptoms after disability is controlled. However, because our data are cross-sectional, there is a limitation on causal inference. A better test of the causal paths would be provided by longitudinal data. The present sample is due for follow-up after 4 years, which will provide a stronger basis for causal inference. Whatever the causal mechanism, the presence of WMHs associated with depressive symptoms in midlife justifies efforts at preventing this source of depression at the population level (28).
Finally, a number of limitations of the study must be acknowledged. The prevalence of depression was low, and the diagnosis was not made by a clinician but with a self-completed interview. Our subjects were in mid-adult life, while the majority of the vascular depression literature concerns elderly individuals over the age of 65. It is possible that the association between depressive symptoms and cerebrovascular disease becomes stronger in the elderly. Depression, when present in our subjects, was mild in intensity, and it is possible that the clinical picture of vascular depression is one of severe depression, often resistant to treatment and needing hospitalization. Furthermore, those who accepted to have a scan tended to be healthier, with better cognitive functioning and higher education and who spoke English as their first language. On the other hand, the study has considerable strengths, with its relatively large community sample covering a narrow age range and the automated assessment of regional WMHs. It therefore offered us the opportunity to examine the relationship between WMHs and depressive symptoms at the mild end of the spectrum, in which confounding factors of other illnesses and cognitive impairment were less likely to have an impact.
 |
 |
 |
 |
Received Feb. 19, 2004; revision received April 5, 2004; accepted May 10, 2004. From the Centre for Mental Health Research, Australian National University; and the School of Psychiatry, University of New South Wales, Neuropsychiatric Institute, Prince of Wales Hospital, Sydney N.S.W., Australia. Address correspondence and reprint requests to Dr. Jorm, Centre for Mental Health Research, Australian National University, Canberra 0200, Australia; [email protected] (e-mail). This study was supported by project and program grants from the National Health and Medical Research Council. The authors thank the staff of the PATH Through Life Project for their contributions.
1. Videbech P: MRI findings in patients with affective disorder: a meta-analysis. Acta Psychiatr Scand 1997; 96:157–168Crossref, Medline, Google Scholar
2. Krishnan KR, Hays JC, Blazer DG: MRI-defined vascular depression. Am J Psychiatry 1997; 154:497–501Link, Google Scholar
3. Alexopoulos GS, Meyers BS, Young RC, Campbell S, Silbersweig D, Charlson M: “Vascular depression” hypothesis. Arch Gen Psychiatry 1997; 54:915–922Crossref, Medline, Google Scholar
4. De Groot JC, de Leeuw FE, Oudkerk M, Hofman A, Jolles J, Breteler MMB: Cerebral white matter lesions and depressive symptoms in elderly adults. Arch Gen Psychiatry 2000; 57:1071–1076Crossref, Medline, Google Scholar
5. Nebes RD, Vora IJ, Meltzer CC, Fukui MB, Williams RL, Kamboh MI, Saxton J, Houck PR, DeKosky ST, Reynolds CF: Relationship of deep WMHs and apolipoprotein E genotype to depressive symptoms in older adults without clinical depression. Am J Psychiatry 2001; 158:878–884Link, Google Scholar
6. Steffens DC, Krishnan RR, Crump C, Burke GL: Cerebrovascular disease and evolution of depressive symptoms in the Cardiovascular Health Study. Stroke 2002; 33:1636–1644Crossref, Medline, Google Scholar
7. Jorm AF, Dear KBG, Rodgers B, Christensen H: Interaction between mother’s and father’s affection as a risk factor for anxiety and depression symptoms: evidence for increased risk in adults who rate their father as having been more affectionate than their mother. Soc Psychiatry Psychiatr Epidemiol 2003; 38:173–179Crossref, Medline, Google Scholar
8. Jorm AF, Anstey KJ, Christensen H, Rodgers B: Gender differences in cognitive abilities: the mediating role of health status and health habits. Intelligence 2004; 32:7–23Crossref, Google Scholar
9. Wen W, Sachdev PS: The topography of white matter hyperintensities on brain MRI in 60–64 years old individuals. Neuroimage 2004 (in press)Google Scholar
10. Fazekas F, Chawluk JB, Alavi A, Hurtig HI, Zimmerman RA: MR signal abnormalities at 1.5 T in Alzheimer’s dementia and normal aging. AJR Am J Roentgenol 1987; 149:351–356Crossref, Medline, Google Scholar
11. Spitzer RL, Kroenke K, Williams JBW: Validation and utility of a self-report version of PRIME-MD: the PHQ Primary Care Study. JAMA 1999; 282:1737–1744Crossref, Medline, Google Scholar
12. Ware J Jr, Kosinski M, Keller SD: A 12-item short-form health survey: construction of scales and preliminary tests of reliability and validity. Med Care 1996; 34:220–233Crossref, Medline, Google Scholar
13. Folstein MF, Folstein SE, McHugh PR: “Mini-Mental State”: a practical method for grading the cognitive state of patients for the clinician. J Psychiatr Res 1975; 12:189–198Crossref, Medline, Google Scholar
14. Saunders JB, Aasland OG, Babor TF, De La Fuente JR, Grant M: Development of the Alcohol Use Disorders Identification Test (AUDIT): WHO collaborative project on early detection of persons with harmful alcohol consumption, II. Addiction 1993; 88:791–804Crossref, Medline, Google Scholar
15. Caldwell TM, Rodgers B, Jorm AF, Christensen H, Jacomb PA, Korten AE, Lynskey MT: Patterns of association between alcohol consumption and symptoms of depression and anxiety in young adults. Addiction 2002; 97:583–594Crossref, Medline, Google Scholar
16. National Health and Medical Research Council: Is There a Safe Level of Daily Consumption of Alcohol for Men and Women? Canberra, Australian Government Publishing Service, 1992Google Scholar
17. Kelsey JL, Whittemore AS, Evans AS, Thompson WD: Methods in Observational Epidemiology. New York, Oxford University Press, 1996Google Scholar
18. O’Brien J, Desmond P, Ames D, Schweitzer I, Harrigan S, Tress B: A magnetic resonance imaging study of white matter lesions in depression and Alzheimer’s disease. Br J Psychiatry 1996; 168:477–485Crossref, Medline, Google Scholar
19. Simpson S, Baldwin RC, Jackson A, Burns AS: Is subcortical disease associated with a poor response to antidepressants? neurological, neuropsychological and neuroradiological findings in late-life depression. Psychol Med 1998; 28:1015–1026Crossref, Medline, Google Scholar
20. Sheline YI: Neuroimaging studies of mood disorder effects on the brain. Biol Psychiatry 2003; 54:338–352Crossref, Medline, Google Scholar
21. Lenze EJ, Sheline YI: Absence of striatal volume differences between depressed subjects with no comorbid medical illness and matched comparison subjects. Am J Psychiatry 1999; 156:1989–1991Link, Google Scholar
22. Sato R, Bryan RN, Fried LP: Neuroanatomic and functional correlates of depressed mood: the Cardiovascular Health Study. Am J Epidemiol 1999; 150:919–929Crossref, Medline, Google Scholar
23. MacKinnon DP, Lockwood CM, Hoffman JM, West SG, Sheets V: A comparison of methods to test mediation and other intervening variable effects. Psychol Methods 2002; 7:83–104Crossref, Medline, Google Scholar
24. Steffens DC, Bosworth HB, Provenzale JM, MacFall JR: Subcortical white matter lesions and functional impairment in geriatric depression. Depress Anxiety 2002; 15:23–28Crossref, Medline, Google Scholar
25. Guo X, Skoog I, Matousek M, Larsson L, Palsson S, Sundh V, Steen B: A population-based study on motor performance and white matter lesions in older women. J Am Geriatr Soc 2000; 48:967–970Crossref, Medline, Google Scholar
26. Starr JM, Leaper SA, Murray AD, Lemmon HA, Staff RT, Deary IJ, Whalley LJ: Brain white matter lesions detected by magnetic resonance imaging are associated with balance and gait speed. J Neurol Neurosurg Psychiatry 2003; 74:94–98Crossref, Medline, Google Scholar
27. Cole MG, Dendukuri N: Risk factors for depression among elderly community subjects: a systematic review and meta-analysis. Am J Psychiatry 2003; 160:1147–1156Link, Google Scholar
28. Hickie I, Scott E: Late-onset depressive disorders: a preventable variant of cerebrovascular disease? Psychol Med 1998; 28:1007–1013Crossref, Medline, Google Scholar