Three-Dimensional Analysis With MRI and PET of the Size, Shape, and Function of the Thalamus in the Schizophrenia Spectrum
Abstract
OBJECTIVE: In an exploration of the schizophrenia spectrum, the authors compared thalamic size, shape, and metabolic activity in unmedicated patients with schizophrenia and schizotypal personality disorder to findings in age- and sex-matched healthy control subjects. METHOD: Coregistered magnetic resonance imaging (MRI) and positron emission tomography scans were obtained in 27 schizophrenic patients, 13 patients with schizotypal personality disorder, and 32 control subjects who performed a serial verbal learning test during tracer uptake. After thalamus edges were outlined on 1.2-mm MRI scans, a radial warping program yielded significance probability mapping in three dimensions. RESULTS: Significance probability mapping (with resampling) identified an area in the region of the mediodorsal nucleus bilaterally with significantly lower relative metabolism in the schizophrenia group than in either the control or schizotypal personality disorder groups, which did not differ from each other. The three groups did not differ significantly in total thalamic volume in square millimeters or thalamic volume relative to brain volume. Shape analyses revealed that schizophrenic patients had significantly fewer pixels in the left anterior region, whereas patients with schizotypal personality disorder had significantly fewer pixels in the region of the right mediodorsal nucleus than did control subjects. CONCLUSIONS: Schizophrenic patients showed significant metabolism and shape differences from control subjects in selective subregions of the thalamus, whereas patients with schizotypal personality disorder showed only a difference in shape. Because the mediodorsal and anterior nuclei have different connections with limbic and prefrontal structures, the anterior thalamic shrinkage and mediodorsal metabolic and shape changes might relate to the different clinical pictures in schizotypal personality disorder and schizophrenia.
The thalamus, which is involved in the processing of sensory inputs and almost all interactions among cortical, subcortical, and brainstem nuclei, is of major interest in schizophrenia. Investigators have speculated that a thalamic abnormality could be associated with the deficiencies in filtering stimuli, focusing attention, or sensory gating reported in schizophrenia (1–5). Andreasen et al. (2) hypothesized that the signs and symptoms of schizophrenia could be explained by abnormalities in midline structures that modulate attention and information processing, particularly the thalamus and its related circuitry.
Postmortem neuropathology in schizophrenia has shown a loss of volume and cell number in the thalamus (6–9), especially in the mediodorsal nucleus (8, 9). Synaptic degeneration in the thalamus (10), reduced parvalbumin-immunoreactive thalamocortical projection neurons (11), and chromatolytic change in the medial thalamus (12) have also been reported. The mediodorsal nucleus is of particular interest because it serves as a major cortical relay from the limbic system and has connections to the prefrontal cortex (13).
Magnetic resonance imaging (MRI) studies have generally shown a reduction in thalamic size in schizophrenia (see reference 14 for review). The earliest study (15) found a trend for the thalamus to be smaller in male patients than in comparison subjects (p=0.05), a difference that reached significance for both sexes in a later study with more subjects (16). While a study by Andreasen et al. (2) that used an image-averaging approach suggested a loss of volume in the lateral thalamus, change in the adjacent internal capsule, or both (see discussion in references 1 and 17), limits of resolution did not permit the determination of which specific nuclei were affected. A combined MRI/positron emission tomography (PET) study revealed no significant decrease in whole thalamic area, but shape analysis suggested decreased left anterior and right posterior size (1). A family study found the left thalamus to be smaller in relatives of schizophrenic patients than in normal subjects (18). Reduced thalamic area was also reported in childhood-onset schizophrenia (19, 20), with a continued decrease over 2-year follow-up. In a study of patients with late-life schizophrenia (average age=59 years), divided into subgroups with early (before age 45) or late (after age 45) onset of illness, reduced thalamic volume was found in patients with early-onset schizophrenia, whereas increased thalamic volume characterized patients with late-onset illness (21). Portas et al. (22) outlined the thalamus on coronal sections and did not find whole volume decreases.
Previous PET studies that examined the thalamus in schizophrenia have produced mixed findings. In comparisons of schizophrenic and normal subjects, studies variously found thalamic metabolic rates in schizophrenia to be higher (in adults [23] and adolescents [24]), lower (1, 25, 26), lower in patients with the deficit syndrome only (27), or unchanged (28–32). There are two important possible explanations for the disagreement among studies. First, PET findings could be affected by the use of varied uptake conditions. Different tasks may involve activation to varying degrees of different thalamic nuclei, as well as the corresponding afferent or efferent brain regions connected to a specific nuclear group. In a study that used a task requiring sustained attention—the visual continuous performance test—we found that the anterior nucleus, which has a major output to the cingulate gyrus (33), had lower activity in schizophrenic than in normal control subjects (1). A task with a cognitive focus different from that of the continuous performance test might reveal abnormalities in a region of the thalamus other than the anterior nucleus. For example, previous work linking a deficit in the formation of long-term memory to mediodorsal thalamic lesions (34, 35) suggests that schizophrenic patients might show mediodorsal dysfunction during a verbal memory task.
Second, methodological problems could have confounded the strength of differences between normal and schizophrenic subjects (1). With two exceptions (1, 24), all studies assessed thalamic function on the basis of coordinates placed visually or stereotaxically in the center of the thalamus. For example, region of interest placement in the center of the thalamus by stereotaxis may blur or lump together thalamic nuclei with different functions. The possibility that certain thalamic nuclei, such as the anterior and mediodorsal nuclei, which have reciprocal connections with frontal lobe structures, may be key in schizophrenia (36) underlines the need for precise localization. Individual differences among patients and comparison subjects in size, shape, and position of the thalamus could obscure findings in studies that rely on stereotaxis to define regions of interest. For more precise comparison of regions of the thalamus, an MRI-derived three-dimensional anatomical template would facilitate reliable identification of thalamic regions.
The major goals of this study were threefold.
1. Enhanced spatial resolution. We wanted to extend our previous work with 7.5-mm full width at half maximum PET and a two-dimensional 5-mm-thick MRI template in a new and larger group of patients by using both higher-resolution PET (4.5 mm full width at half maximum) and three-dimensional coregistered 1.2-mm MRI. This methodology provides more precise localization of the thalamus, which is necessary to elucidate the subregions that are hypothesized to be dysfunctional in schizophrenia.
2. Memory function. Because our past work primarily used a visual vigilance task, the continuous performance test, we decided to tap additional functions of theoretical relevance by using a serial verbal learning task that requires both short-term (i.e., working memory) and encoding for long-term memory and is related to the literature on the various thalamic nuclear groups and their respective connections.
3. Schizophrenia spectrum. We wondered whether thalamic abnormalities in schizophrenia would also characterize schizotypal personality disorder. Because schizotypal personality disorder is genetically related to schizophrenia (37), inclusion of this patient group could help clarify our understanding of deficits that are central to the pathophysiology of schizophrenia. Possible biological markers in schizotypal personality disorder are less likely to be affected by contaminating influences of histories of antipsychotic drug treatment and hospitalizations. Since no previous study has examined thalamic size, shape, or function in schizotypal personality disorder, it appeared valuable to address this gap in the literature.
METHOD
Participants
Twenty-seven schizophrenic patients (20 men and seven women; mean age=38.3 years, SD=14.3) were evaluated with the Comprehensive Assessment of Symptoms and History (38) and were diagnosed as having schizophrenia (N=24) or schizoaffective disorder (N=3), according to DSM-IV. Patients were neuroleptic naive (N=7) or neuroleptic free for a median of 3 weeks (N=20; 15 men and five women; none had taken long-acting neuroleptics; shortest washout=12 days; next shortest=14 days; longest=3 years). Total scores on the 18-item Brief Psychiatric Rating Scale (BPRS) (39) were obtained for 25 of the patients on the day of their PET scan (mean=54.4, SD=12.1; range=30–85; minimum possible rating=18).
Thirteen patients with schizotypal personality disorder (12 men and one woman; mean age=43.3 years, SD=13.6) were interviewed with the Schedule for Affective Disorders and Schizophrenia (40)and the Structured Interview for DSM-III-R Personality Disorders (41). All met DSM-IV criteria for schizotypal personality disorder. Mean total BPRS score (N=12) was 37.5 (SD=6.2; range=28–46).
Thirty-two normal control subjects (25 men and seven women; mean age=41.8, SD=12.1) received a Comprehensive Assessment of Symptoms and History interview to exclude psychiatric illness in themselves or first-degree relatives. Both patients and volunteers were screened as described elsewhere (42). After a complete description of the study to all subjects, written informed consent was obtained.
PET [18F]Fluorodeoxyglucose (FDG) Uptake Task and Procedure
Intravenous lines were inserted in the left arm for blood sampling and the right arm for FDG injection. After placement of intravenous lines, participants were moved to a comfortable chair in a sound-attenuated room. Before the procedure, participants were read standard instructions about the serial verbal learning task, which was developed for the 32-minute FDG-uptake period and is analogous to the California Verbal Learning Test (43). The serial verbal learning task comprised five 16-word lists, each containing four words from four semantic categories (e.g., fruits, clothing, colors, spices). A more detailed description is provided elsewhere (42). Scores were recorded for total number of correctly recalled words, recall by semantic clustering versus serial ordering, intrusions (words not in list), and perseverations (repetition of word on the same trial).
PET and MRI
PET scans (20 slices, 6.5-mm intervals) were obtained with a head-dedicated GE scanner (model PC2048B) with measured resolution of 4.5 mm in plane (4.2–4.5 mm across 15 planes). T1-weighted axial MRI scans were acquired with the GE Signa 5x system (TR=24 msec, TE=5 msec, flip angle=40°, slice thickness=1.2 mm, pixel matrix=256×256, field of view=23 cm, total slices=128).
PET and MRI Coregistration
The PET and MRI scans were obtained in the axial plane (canthomeatal line) through use of the same individually molded thermoplastic head holder. PET scans were coregistered to MRI by using brain slice edges (44). PET edges were automatically generated following image smoothing with a radial threshold-seeking algorithm on all 20 PET slices. MRI edges were hand drawn on the brain edge by identifying 50–100 points and passing a best-fit spline curve through the points. MRI within-edge area was assessed in 10 subjects from the current group, traced by two independent tracers, which yielded an intraclass correlation coefficient (ICC) of 0.98 (45). Accuracy was tested by scanning a subject with capillary tubes that were fastened to the face and were filled with a mixture of copper sulfate (0.5 M) and FDG; the resulting distance between the two marker centers (FDG and copper sulfate both outside and independent of the traced edge) was 1.79 mm, compared with 1.83 mm reported by others (44). Imaging and coregistration procedures are described in detail elsewhere (42).
Tracing of the Thalamus on MRI
Thalami were traced on contiguous 1.2-mm axial MRI scans with tracing guidelines as shown (Figure 1). To determine the reliability of tracing methods, two independent tracers examined right thalamus tracings from axial slice levels ranging from top to bottom of the thalamus for a subset of the current group (24 subjects). Intertracer reliability (ICC) for two tracers was 0.91 for area and 0.99 for relative metabolic rate. Intertracer overlap percentage was calculated as the number of pixels common to both tracers’ outlines multiplied by 100 and divided by the average number of pixels in each tracer’s outlines (94.5% for the thalamus).
For comparability with previous work (1), the shape of the thalamus was examined by selecting, for each participant, one MRI slice that passed through the center of the thalamus in the z direction, matching a standard atlas at 41% of head height (46).
Statistical Analysis
Two complementary approaches were used to analyze relative glucose metabolic rate (rGMR): analysis of variance (ANOVA) on thalamic slice levels and groups and significance probability mapping for an exploration of thalamic subregions. The ANOVA for rGMR used a three-group (control, schizophrenia, schizotypal personality disorder)×13 (slice: 1–13)×2 (hemisphere: right, left) mixed-factorial design. Average rGMR was calculated for left and right thalami as the mean activity value for all pixels in the region of interest divided by whole brain activity. A 3×2 mixed-factorial design was used for the thalamus-volume analysis. The first variable comprised three groups; the second, two hemispheres. Separate ANOVAs were done for absolute thalamic volume (in cubic millimeters) and relative thalamic volume (thalamic volume in cubic millimeters divided by brain volume in cubic millimeters). Thus, our statistical approach allowed 1) specific a priori hypothesis testing of mean rGMR within the MRI-based outline of the thalamus with a single F ratio (group by slice by hemisphere) to control type I error, and 2) pixel-by-pixel t test significance probability mapping (47, 48) using the entire three-dimensional reconstruction of the thalamus. The significance probability mapping approach included a conservative resampling method (49) to determine significance levels (42, 50) with actual PET thalamus data from a pool of 30 additional normal control subjects (age- and sex-matched) studied under identical conditions. An empirical table of cluster volumes was created by generating 5,000 random samples from the total pool of 62 volunteers and obtaining the single largest cluster for each random draw. Volumes for the 0.05, 0.025, and 0.01 significance levels were obtained, permitting a test of whether any given pixel cluster volume might occur by chance if groups differed no more than random sets of volunteers.
All statistical analyses involving repeated measures with more than two levels used Greenhouse-Geisser epsilon corrections to adjust probabilities for repeated measures F values. We report here the uncorrected degrees of freedom for these analyses and for t tests that required correction because of heterogeneity of variance.
RESULTS
Thalamic rGMR
The three-way mixed-design ANOVA for rGMR in the thalamus (group [normal control subjects, schizophrenic patients, and patients with schizotypal personality disorder] by slice by hemisphere) confirmed a group-by-slice interaction (Table 1). A significant main effect of slice indicated a dorsal-to-ventral gradient for thalamic rGMR across groups. The main effects of group and hemisphere and the other interactions were not significant. To determine how the two patient groups contributed to the significant group-by-slice interaction, two-group ANOVAs were conducted. A significant group-(control versus schizophrenia) by-slice interaction emerged in which schizophrenic patients showed lower rGMR in middle and ventral thalamus slice levels (slices 7–13) and higher rGMR in the most dorsal slices (slices 1–4) than volunteers (Table 1). A significant group-(schizotypal personality disorder versus schizophrenia) by-slice interaction indicated a strikingly similar pattern of differences between the two patient groups. Last, no significant group effect or interaction with group was found in the three-way ANOVA comparing the normal control and schizotypal personality disorder groups.
The significance probability mapping analysis comparing thalamic rGMR in control subjects and schizophrenic patients indicated that patients had significantly decreased metabolic rate, located primarily bilaterally in the region of the mediodorsal nucleus (Figure 2). The significance probability mapping analysis comparing thalamic rGMR in the two patient groups (Figure 3) revealed significantly lower rGMR, primarily in the mediodorsal region of the left and right thalami, in schizophrenic patients than in patients with schizotypal personality disorder. Last, the three-dimensional significance probability mapping analysis comparing control subjects and patients with schizotypal personality disorder revealed no significant difference in thalamic rGMR.
Size and Shape of the Thalamus
Analysis of total brain volume showed no significant difference among the three groups (control: mean=1318 cm3, SD=109; schizophrenia: mean=1272, SD=119; schizotypal personality disorder: mean=1390, SD=201; all t values<1.98, p>0.05). Absolute thalamic volume (average of left and right) did not differ significantly among the groups (control: mean=6221 mm3, SD=793; schizophrenia: mean=5904, SD=871; schizotypal personality disorder: mean=6085, SD=1040; F=1.06, df=2, 69, p=0.35). The group-by-hemisphere interaction also failed to reach significance (F=0.39, df=2, 69, p=0.68). Similarly, the three groups did not differ in relative thalamic volume [control: mean=0.473% (mm3 divided by brain volume in mm3], SD=0.06; schizophrenia: mean=0.466%, SD=0.07; schizotypal personality disorder: mean=0.442%, SD=0.07; F=1.23, df=2, 69, p=0.30); the interaction with hemisphere also was not significant (F=0.50, df=2, 69, p=0.61).
Figure 4 shows the statistical contour maps of thalamic shape for each group. Compared with control subjects, schizophrenic patients had significantly fewer pixels at the anterior tip of the left thalamus. Compared with both normal control subjects and schizophrenic patients, patients with schizotypal personality disorder had significantly fewer pixels in the region of the right mediodorsal nucleus (for all Fisher’s exact tests, p<0.05).
BPRS and Task Performance
Among the combined groups with schizophrenia and schizotypal personality disorder, those with higher total BPRS scores on the day of the PET scan had lower metabolic rates in the region of the mediodorsal and pulvinar nuclei of the thalamus (Figure 5).
Except for three schizophrenic patients who could not complete the task, all subjects were cooperative and performed at above-chance levels (analyses excluding patients who failed to finish the task did not change the imaging findings). Not surprisingly, both control subjects and patients with schizotypal personality disorder had better scores on most performance measures than schizophrenic patients. The control and schizotypal personality disorder groups recalled significantly more correct words and had significantly higher semantic-clustering-strategy scores than the schizophrenic group (Table 2). In contrast, the schizophrenic patients had significantly higher serial-order scores than control subjects. Compared with the control subjects, patients with schizotypal personality disorder did not differ significantly on intrusion scores, whereas schizophrenic patients had significantly more intrusions. Last, the three groups did not differ on perseveration scores.
DISCUSSION
Our finding of diminished thalamic metabolism in schizophrenic patients compared with control subjects is consistent with previous findings (1, 25, 26, 51). However, this is the first study to show significantly decreased rGMR primarily located bilaterally in the region of the mediodorsal nucleus in schizophrenic patients. This finding is consistent with detailed neuropathological studies that have reported decreased neuronal density and volume reduction in the mediodorsal nucleus (8, 9). The mean volume of the medial dorsal nucleus, approximately 500 mm3 in postmortem brain (9), may be compared with the PET scanner resolution assessed with our measured full width at half maximum (slice center) of 122 mm 3 or four full width at half maximum volume. This places the medial dorsal nucleus in the range of moderate recovery coefficients. Patients with schizotypal personality disorder did not differ significantly from control subjects in thalamic rGMR and showed less severe symptoms than schizophrenic patients, suggesting that thalamic abnormalities may be related to symptom severity in the schizophrenia spectrum.
The lack of differences between schizophrenic and normal subjects in total thalamic volume is consistent with a recent volumetric MRI study (52), as well as with other work that examined thalamic area (see reference 14 for review). Our negative finding does not seem only to be the result of inadequate group size (N=59); we had 0.80 power to detect a 10% difference in volume. The observed control-versus-schizophrenia effect size was 0.38, which was only 4.7% of thalamic volume; with our group size we had 0.33 power to detect such a small volume effect. An earlier shape-analysis finding that the left anterior region of the thalamus is significantly smaller in schizophrenic than in normal subjects (1) was replicated in the present study. Shape analysis also revealed significantly fewer pixels in the region of the right mediodorsal nucleus in patients with schizotypal personality disorder. Shrinkage of the brain in other areas may occur in patients with schizotypal personality disorder, as suggested by the ventricle abnormalities found in this same group of patients with schizotypal personality disorder (53).
Abnormalities in the anterior and mediodorsal nuclei are of interest because of their connections with various other structures. The primary connections of the anterior nucleus are with limbic structures including the hippocampus and cingulate gyrus. The anterior nucleus receives substantial input from the hippocampus by means of the fornix, and the hippocampus has been implicated in many studies of schizophrenia (7). One of the main outputs of the anterior nucleus is to the cingulate gyrus, which is also considered a portion of the limbic system and has been reported to show low rGMR in schizophrenia (54).
The mediodorsal nucleus of the thalamus constitutes the most prominent subcortical afferent to the prefrontal cortex (55), with which it is intimately associated (13, 56, 57). Indeed, some researchers have defined prefrontal cortex as that region receiving projections from the mediodorsal nucleus (58, 59). Findings of both metabolic and volumetric thalamic reductions in schizophrenia that have been reported in the literature may reflect a lack of normal frontothalamic afferent activity, which might result primarily from diminished frontal activity (60) or more generally from disturbed connections between frontal-striatal-thalamic regions. This possibility is suggested by diminished coherence of white matter tracts in the internal capsule (61), reduced frontothalamic rGMR correlations (62), and rGMR hypofrontality during a sensorimotor gating paradigm thought to be mediated by frontal-striatal-thalamic circuitry (63).
The possibility that group differences in rGMR are due entirely to total thalamic volume loss and partial volume effects is unlikely because the groups did not differ in either absolute or relative total thalamic volume. The present volumetric data are consistent with those of Portas et al. (52), who concluded that “significant differences…will emerge when only specific nuclei are considered” (p. 654). Similarly, postmortem data revealed changes in the medial dorsal nucleus rather than in the entire thalamus (8, 9). Area measurements in MRI, typically done on a slice cutting through the dorsoventral midpoint, might be more sensitive to nuclear change at this level than total volumetric measures. The shape analysis that was done on one axial slice through the middle of the thalamus suggests the possibility that schizophrenic patients have a size reduction in the left anterior nucleus region, whereas patients with schizotypal personality disorder have a reduction in the right mediodorsal nucleus region. While changes in total volume were not significant, it is still possible that thalamic volume reduction or reduction in another nucleus contributes to the outline position and to the anterior change.
The possibility that changes in thalamic size could be entirely drug related is raised by a report (64) of caudate enlargement after neuroleptic treatment. However, we previously observed MRI-assessed decreases in the right anterior region in never-medicated patients (1). Pakkenberg (8, 9) did not find medication history related to percent volume loss in postmortem studies. Last, postmortem biochemical studies (65) found elevated dopamine levels in the thalamus of schizophrenic patients, but not in neuroleptic-treated patients with Huntington’s disease.
Poor task performance could be related to the significantly lower thalamic rGMR in schizophrenic patients than in patients with schizotypal personality disorder and normal subjects. Overall, the schizophrenic group performed at above chance levels, however, and had higher serial-order scores than the normal group. The patients’ use of the serial-ordering strategy indicates that they were actively engaged in the task (although the semantic-clustering strategy would have been a more efficient approach). In our previous report (1), which also found lower thalamic metabolism in schizophrenic than in normal groups, there were no statistically significant between-group differences in scores on a visual continuous performance test. Moreover, lower thalamic metabolism in schizophrenia has also been found in PET studies carried out under resting conditions (25–27).
Among the patients with schizophrenia and schizotypal personality disorder, reduced thalamic rGMR, particularly in the left mediodorsal and pulvinar regions of the thalamus, was associated with higher BPRS scores on the day of the PET scan. This finding suggests that disruptions in these selective subregions of the thalamus and their interconnected neural circuits play an important role in the production of symptoms in the schizophrenia spectrum.
Received Sept. 24, 1998; revision received Feb. 5, 1999; accepted Feb 12, 1999. From the Department of Psychiatry, Mount Sinai School of Medicine. Address reprint requests to Dr. Hazlett, Department of Psychiatry, Box 1505, 1 Gustave L. Levy Place, Mount Sinai School of Medicine, New York, NY 10029-6574; [email protected] (e-mail) Supported by NIMH grants MH-40071 (to Dr. Buchsbaum) and MH-56460 (to Dr. Hazlett) and a Young Investigator Award from the National Alliance for Research on Schizophrenia and Depression (to Dr. Hazlett).
 |
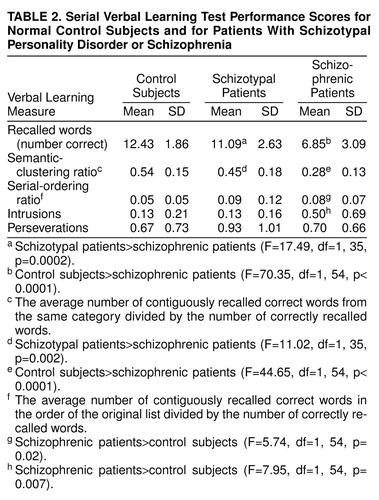 |

FIGURE 1. Three-Dimensional Tracing and t Test Mapping of the Thalamus in Normal Control Subjects and Schizophrenic Patientsa
aEdge enhancement improves MRI tracing of the thalamus. Left inset: enlarged view of the thalamus with the edge outline shown. Right inset: same image with gradient filter applied showing enhanced outline of the thalamus drawn by the tracer.
Tracing guidelines: for each thalamus region of interest, an automatic boundary-finding method based on a Sobel gradient filter provides a reproducible edge. For each point placed by the tracer with a mouse along the thalamus edge, the computer program searched within a 3×3 grid for the maximum gradient value. If there were gaps in the white edge, the tracer placed a point on either side of the gap. A spline curve was fitted to the set of points to provide a continuous edge. The most inferior slice traced was identified as the slice above that which visualized any superior colliculus. Next, the thalamus was traced in each hemisphere until it was no longer visible (approximately 10–15 slices per hemisphere).
Main image: left and right thalamus metabolic rate t test comparison of schizophrenic patients and control subjects (average of 13 slices). The thalamus is viewed as if the viewer were standing behind the person and to the person’s right side. The left side of the picture is the left thalamus. First, the axial slices containing the thalamus and the edges that were traced (typically 10–15 slices) were interpolated to yield 13 axial slices (mean normal control axial height) (figure 2). Next, for each axial level and hemisphere containing a thalamus edge, the average thalamus contour across the group of 32 control subjects was calculated, and each subject’s thalamus was stretched radially at 360 angular positions from the centroid. For every radius, the length in pixels for the subject was set to the average normal control length, and all pixel values were adjusted by proportional linear interpolation. The 360 positions provided oversampling so that every x, y pixel location was filled with a new transformed value. This yielded thalamic volumes with the same number of voxels for every subject. Coregistered PET was similarly warped. The resulting thalami entered a three-dimensional interpolation program, and t tests were performed on every level. The gray surface is the three-dimensional average MRI thalamus contour from the control subjects. The orange solid region is the cluster of t tests (p<0.05) comparing relative metabolic rate in control subjects and patients. Schizophrenic patients had significantly lower relative glucose metabolism in this region, which primarily includes the mediodorsal nucleus.

FIGURE 2. Three-Dimensional Significance Probability Mapping of the Thalamus in Normal Control Subjects and Schizophrenic Patientsa
aUpper left: MRI with three-dimensional thalamus superimposed for orientation. Upper right: close-up view of center of illustration in upper left in area of yellow frame. Bottom row: t tests from the 13 thalamic level tracings are shown for the left and right thalamus; orange areas outlined in white are the contiguous pixels that reached the p<0.05 threshold for control subjects>schizophrenic patients. This decrease in schizophrenic patients was observed primarily in the region of the mediodorsal nucleus and was confirmed for the left thalamus (resampling p<0.05, two-tailed, mean cluster t value=2.62, maximum t value=4.94, mean cluster rGMR=1.31 in control subjects and 1.18 in schizophrenic patients) and the right thalamus (p<0.05, mean t value=2.51, maximum t value=4.68, mean cluster rGMR=1.30 in control subjects and 1.17 in schizophrenic patients). Both clusters reached the resampling criterion for p<0.05; a cluster with this volume would not occur in the thalamus more than once in 20 random drawings of groups of 27 and 32 normal control subjects from our large pool of normal control subjects. Key drawing of major thalamic nuclei is described in the report by Buchsbaum et al. (1). VA=ventral anterior nucleus, AV=anteroventral nucleus, CeM=central median nucleus, MD=mediodorsal nucleus, Pul=pulvinar nucleus, VPL=ventral posterior lateral nucleus, VL=ventral lateral nucleus.

FIGURE 3. Thalamic rGMR in Normal Control Subjects, Schizophrenic Patients, and Patients With Schizotypal Personality Disordera
aTop: as in figure 2, t tests were conducted for control subjects and patients with schizotypal personality disorder and for patients with schizophrenia and schizotypal personality disorder. Control subjects and patients with schizotypal personality disorder were not significantly different by resampling method. Bottom: blue areas outlined in white indicate where schizophrenic patients had significantly lower relative glucose metabolism than patients with schizotypal personality disorder (left: p<0.05, one-tailed; mean t value=–2.55; maximum t value=–4.03; mean cluster rGMR for schizophrenia=1.18, mean cluster rGMR for schizotypal personality disorder=1.36; right: p<0.05, one-tailed; mean t value=–2.57; maximum t value=–3.84; mean cluster rGMR for schizophrenia=1.08, mean cluster rGMR for schizotypal personality disorder=1.24).

FIGURE 4. Thalamus Contour Differences Among Normal Control Subjects, Schizophrenic Patients, and Patients With Schizotypal Personality Disordera
aTally plots are applied to the left and right thalamic outlines of the three groups at the 41% level to assess shape. The top row shows the number of subjects for each pixel position whose thalamus outline is outside this x, y location. Each thalamus is expressed within the same size thalamic bounding box, based on the average normal control, to remove effects of brain size. The color scale is white for all subjects, green for 50% of the subjects, blue for 10% of the subjects, and black for 0% of subjects. Thus, the center of the structure is white, indicating that at this position, all subjects’ outlines were outside this area (i.e., all subjects have pixels in this area). At the median size (half of the subjects have a thalamic outline outside the pixel location, and half have an outline inside the pixel location), the color is green. Thalamic outlines tallied for control subjects (top left), schizophrenic patients (top middle), and patients with schizotypal personality disorder (top right) are shown. The difference plots (bottom row) show the difference in percentage at each pixel location between control and patient groups. The color bar shows areas where a larger percentage of control subjects than patients have a pixel inside the thalamic outline in orange and red. For example, red (bottom left) indicates an area at the anterior tip of the left thalamus where control subjects were significantly more likely to have a pixel coordinate inside the thalamic outline than were schizophrenic patients. The red (bottom middle and right) indicates a smaller width in the mediodorsal region in patients with schizotypal personality disorder than in control subjects and schizophrenic patients. The Fisher’s exact tests (middle row) are consistent with these group differences. Each Fisher’s exact plot is a 2×2 test for each pixel. For example, the number of control subjects for whom the pixel is inside and outside their own thalamic outline is contrasted with the number of schizophrenic patients for whom the pixel is inside or outside their outline. Yellow areas (middle row) indicate a Fisher’s exact value with a significance level of <0.05.

FIGURE 5. Correlations Between Total BPRS Scores on the Day of the PET Scan and Thalamic rGMR in the Schizophrenia Spectruma
aTop: in the combined group with schizophrenia and schizotypal personality disorder (N=37), the statistically significant correlation coefficients between BPRS scores and left thalamic rGMR are shown in the three-dimensional format. Blue areas indicate negative correlations (r<–0.33), and orange areas indicate positive correlations (r>0.33; tabled r values are p<0.05, two-tailed). Bottom: 13 individual thalamic slice levels from superior to inferior are shown; blue areas are the contiguous pixels that reached the resampling criterion (mean r value within the cluster was –0.39, and the maximum r value was –0.55; by resampling criterion this reached a significance level of p<0.05, one-tailed). When the method of Friston et al. was used, the maximum pixel value reached a significance level of p<0.05, two-tailed (p<0.05 for r<−0.48). Thus, in the blue areas, which are primarily in the mediodorsal and pulvinar region of the left thalamus, reduced rGMR was associated with increased symptoms as measured by the BPRS on the day of the PET scan.
1. Buchsbaum MS, Someya T, Teng CY, Abel L, Chin S, Najafi A, Haier RJ, Wu J, Bunney WE Jr: PET and MRI of the thalamus in never-medicated patients with schizophrenia. Am J Psychiatry 1996; 153:191–199Link, Google Scholar
2. Andreasen NC, Arndt S, Swayze V II, Cizadlo T, Flaum M, O’Leary D, Ehrhardt JC, Yuh WTC: Thalamic abnormalities in schizophrenia visualized through magnetic resonance image averaging. Science 1994; 266:294–298Crossref, Medline, Google Scholar
3. McGhie A, Chapman J: Disorders of attention and perception in early schizophrenia. Br J Med Psychol 1961; 34:102–116Google Scholar
4. Braff D: Information processing and attention dysfunctions in schizophrenia. Schizophr Bull 1993; 19:233–259Crossref, Medline, Google Scholar
5. Carlsson M, Carlsson A: Interactions between glutamatergic and monoaminergic systems within the basal ganglia. Trends Neurosci 1990; 13:272–276Crossref, Medline, Google Scholar
6. Bogerts B, Falkai P, Greve B, Schneider T, Pfeiffer U: The neuropathology of schizophrenia. J Hirnforsch 1993; 34:193–203Medline, Google Scholar
7. Bogerts B: The temporolimbic system theory of positive schizophrenic symptoms. Schizophr Bull 1997; 23:423–435Crossref, Medline, Google Scholar
8. Pakkenberg B: Pronounced reduction of total neuron number in mediodorsal thalamic nucleus and nucleus accumbens in schizophrenics. Arch Gen Psychiatry 1990; 47:1023–1028Google Scholar
9. Pakkenberg B: The volume of the mediodorsal thalamic nucleus in treated and untreated schizophrenics. Schizophr Res 1992; 7:95–100Crossref, Medline, Google Scholar
10. Blennow K, Davidsson P, Gottfries C, Ekman R, Helig M: Synaptic degeneration in thalamus in schizophrenia. Lancet 1996; 348:692–693Crossref, Medline, Google Scholar
11. Danos P, Bauman B, Bernstein H, Franz M, Stauch R, Northoff G, Krell D, Falkai P, Bogerts B: Schizophrenia and anteroventral thalamic nucleus. Psychiatry Res Neuroimaging 1998; 82:1–10Crossref, Medline, Google Scholar
12. Casanova M, Carosella N, Kleinman J: Neuropathological findings in a suspected case of childhood schizophrenia. J Neuropsychiatry 1990; 2:313–318Crossref, Medline, Google Scholar
13. Goldman-Rakic P, Porrino L: The primate mediodorsal (MD) nucleus and its projection to the frontal lobe. J Comp Neurol 1985; 242:535–560Crossref, Medline, Google Scholar
14. Andreasen NC: The role of the thalamus in schizophrenia. Can J Psychiatry 1997; 42:27–33Crossref, Medline, Google Scholar
15. Andreasen NC, Ehrhardt JC, Swayze VW II, Alliger RJ, Yuh WT, Cohen G, Ziebell S: Magnetic resonance imaging of the brain in schizophrenia: the pathophysiologic significance of structural abnormalities. Arch Gen Psychiatry 1990; 47:35–44Crossref, Medline, Google Scholar
16. Flaum M, Swayze VW II, O’Leary DS, Yuh WTC, Ehrhardt JC, Arndt SV, Andreasen NC: Effects of diagnosis, laterality, and gender on brain morphology in schizophrenia. Am J Psychiatry 1995; 152:704–714Link, Google Scholar
17. Jones E: Cortical development and thalamic pathology in schizophrenia. Schizophr Bull 1997; 23:483–501Crossref, Medline, Google Scholar
18. Seidman L, Faraone S, Goldstein J, Goodman J, Kremen W, Matsuda G, Hoge E, Kennedy D, Makris N, Caviness V, Tsuang M: Reduced subcortical brain volumes in nonpsychotic siblings of schizophrenic patients. Am J Med Genet 1997; 74:507–514Crossref, Medline, Google Scholar
19. Frazier J, Giedd J, Hamburger S, Albus K, Kaysen D, Vaituzis A, Rajapakse J, Lenane M, McKenna K, Jacobsen L, Gordon C, Breier A, Rapoport J: Brain anatomic magnetic resonance imaging in childhood-onset schizophrenia. Arch Gen Psychiatry 1996; 53:617–624Crossref, Medline, Google Scholar
20. Rapoport JL: Child psychiatry comes of age: growing sophistication, evolving strategies (editorial). Am J Psychiatry 1997; 154:1043–1045Google Scholar
21. Corey-Bloom J, Jernigan T, Archibald S, Harris MJ, Jeste DV: Quantitative magnetic resonance imaging of the brain in late-life schizophrenia. Am J Psychiatry 1995; 152:447–449Link, Google Scholar
22. Portas C, Goldstein J, Shenton M, Hokama H, Wible C, Fischer I, Kikinis R, Donnino R, Jolesz F, McCarley R: Volumetric evaluation of the thalamus in schizophrenic male patients using magnetic resonance imaging. Biol Psychiatry 1998; 43:649–659Crossref, Medline, Google Scholar
23. Resnick S, Gur R, Alavi A, Gur R, Reivich M: Positron emission tomography and subcortical glucose metabolism in schizophrenia. Psychiatry Res 1988; 24:1–11Crossref, Medline, Google Scholar
24. Jacobsen LK, Giedd M, Castellanos FX, Vaituzis AC, Hamburger SD, Kumra S, Lenane MC, Rapoport JL: Progressive reduction of temporal lobe structures in childhood-onset schizophrenia. Am J Psychiatry 1998; 155:678–685Link, Google Scholar
25. Wiesel F, Wik G, Sjögren I, Blomqvist G, Greitz T, Stone-Elander S: Regional brain glucose metabolism in drug free schizophrenic patients and clinical correlates. Acta Psychiatr Scand 1987; 76:628–641Crossref, Medline, Google Scholar
26. Wik G, Wiesel F, Sjögren I, Blomqvist G, Greitz T, Stone-Elander S: Effects of sulpiride and chlorpromazine on regional cerebral glucose metabolism in schizophrenic patients as determined by emission tomography. Psychopharmacology (Berl) 1989; 97:309–318Crossref, Medline, Google Scholar
27. Tamminga C, Thaker G, Buchanan R, Kirkpatrick B, Alphs L, Chase T, Carpenter W: Limbic system abnormalities identified in schizophrenia using positron emission tomography with fluorodeoxyglucose and neocortical alterations with deficit syndrome. Arch Gen Psychiatry 1992; 49:522–530Crossref, Medline, Google Scholar
28. Buchsbaum MS, Wu JC, DeLisi LE, Holcomb HH, Hazlett E, Cooper-Langston K, Kessler R: Positron emission tomography studies of basal ganglia and somatosensory cortex neuroleptic drug effects. Biol Psychiatry 1987; 66:479–494Crossref, Google Scholar
29. Kling AS, Metter EJ, Riege WH, Kuhl DE: Comparison of PET measurement of local brain glucose metabolism and CAT measurement of brain atrophy in chronic schizophrenia and depression. Am J Psychiatry 1986; 143:175–180Link, Google Scholar
30. Siegel BV Jr, Buchsbaum MS, Bunney WE Jr, Gottschalk LA, Haier RJ, Lohr JB, Lottenberg S, Najafi A, Nuechterlein KH, Potkin SG, Wu J: Cortical-striatal-thalamic circuits and brain glucose metabolic activity in 70 unmedicated male schizophrenic patients. Am J Psychiatry 1993; 150:1325–1336Google Scholar
31. Szechtman H, Nahmias C, Garnett S, Firnau G, Brown G, Kaplan R, Cleghorn J: Effect of neuroleptics on altered cerebral glucose metabolism in schizophrenia. Arch Gen Psychiatry 1988; 45:523–532Crossref, Medline, Google Scholar
32. Szymanski S, Gur R, Gallacher F, Mozley L, Gur R: Vulnerability to tardive dyskinesia development in schizophrenia. Neuropsychopharmacology 1996; 15:567–575Crossref, Medline, Google Scholar
33. Carpenter M, Sutin J: Human Neuroanatomy. Baltimore, Williams & Wilkins, 1983Google Scholar
34. Choi D, Sudarsky L, Schacter S, Biber M, Burke P: Medial thalamic hemorrhage with amnesia. Arch Psychol 1983; 40:611–613Google Scholar
35. Squire LR, Moore RY: Dorsal thalamic lesions in a noted case of human memory dysfunction. Ann Neurol 1979; 6:503–506Crossref, Medline, Google Scholar
36. Crosson B, Hughes C: Role of the thalamus in language. Schizophr Bull 1987; 13:605–621Crossref, Medline, Google Scholar
37. Siever L, Silverman J, Horvath T, Klar H, Coccaro E, Keefe R, Pinkham L, Rinaldi P, Mohs R, Davis K: Increased morbid risk for schizophrenia-related disorders in relatives of schizotypal personality disordered patients. Arch Gen Psychiatry 1990; 47:634–640Crossref, Medline, Google Scholar
38. Andreasen NC, Flaum M, Arndt S: The Comprehensive Assessment of Symptoms and History (CASH): an instrument for assessing diagnosis and psychopathology. Arch Gen Psychiatry 1992; 49:615–623Crossref, Medline, Google Scholar
39. Overall JE, Gorham DR: The Brief Psychiatric Rating Scale. Psychol Rep 1962; 10:799–812Crossref, Google Scholar
40. Endicott J, Spitzer RL: A diagnostic interview: the Schedule for Affective Disorders and Schizophrenia. Arch Gen Psychiatry 1978; 35:837–844Crossref, Medline, Google Scholar
41. Stangl D, Pfohl B, Zimmerman M: A structured interview for DSM-III personality disorders: a preliminary report. Arch Gen Psychiatry 1985; 42:591–596Crossref, Medline, Google Scholar
42. Shihabuddin L, Buchsbaum M, Hazlett E, Haznedar M, Harvey P, Newman A, Schnur D, Spiegel-Cohen J, Wei T, Machac J, Knesaurek K, Vallabhojosula S, Biren M, Ciaravolo T, Luu-Hsia C: Dorsal striatal size, shape, and metabolic rate in neuroleptic-naive and previously medicated schizophrenic patients performing a verbal learning task. Arch Gen Psychiatry 1998; 55:235–243Crossref, Medline, Google Scholar
43. Delis D, Kramer J, Kaplan E, Ober B: California Verbal Learning Test. San Antonio, Psychological Corp, 1987Google Scholar
44. Pelizzari C, Chen G, Spelbring D, Weichselbaum R, Chen C: Accurate three-dimensional registration of CT, PET, and/or MR images of the brain. J Comput Assist Tomogr 1989; 13:20–26Crossref, Medline, Google Scholar
45. Bartko J: On various intraclass correlation reliability coefficients. Psychol Bull 1976; 83:762–765Crossref, Google Scholar
46. Matsui T, Hirano A: An Atlas of the Human Brain for Computerized Tomography. Tokyo, Igaku-Shoin, 1978Google Scholar
47. Bartels P, Subach J: Significance probability mappings and automated interpretation of complex pictorial scenes, in Digital Processing of Biomedical Imagery. Edited by Preston E, Onoe M. New York, Academic Press, 1976, pp 101–114Google Scholar
48. Friston KJ, Frith C, Liddle P, Frackowiak R: Plastic transformation of PET images. J Comput Assist Tomogr 1991; 15:634–659Crossref, Medline, Google Scholar
49. Arndt S, Cizadlo T, Andreasen NC, Heckel D, Gold S, O’Leary DS: Tests for comparing images based on randomization and permutation methods. J Cereb Blood Flow 1996; 16:1271–1279Google Scholar
50. Haznedar MM, Buchsbaum MS, Metzger M, Solimando A, Spiegel-Cohen J, Hollander E: Anterior cingulate gyrus volume and glucose metabolism in autistic disorder. Am J Psychiatry 1997; 154:1047–1050Google Scholar
51. Tamminga CA, Thaker GK, Buchanan R, Kirkpatrick B, Alphs LD, Chase TN, Carpenter WT: Limbic system abnormalities identified in schizophrenia using positron emission tomography with fluorodeoxyglucose and neocortical alterations with deficit syndrome. Arch Gen Psychiatry 1992; 49:522–530Crossref, Medline, Google Scholar
52. Portas C, Goldstein J, Shenton M, Hokama H, Wible C, Fischer I, Kikinis R, Donnino R, Jolesz F, McCarley R: Volumetric evaluation of the thalamus in schizophrenic male patients using magnetic resonance imaging. Biol Psychiatry 1998; 43:649–659Crossref, Medline, Google Scholar
53. Buchsbaum MS, Yang S, Hazlett E, Siegel BV Jr, Germans M, Haznedar M, O’Flaithbheartaigh S, Wei T, Silverman J, Siever LJ: Ventricular volume and asymmetry in schizotypal personality disorder and schizophrenia assessed with magnetic resonance imaging. Schizophr Res 1997; 27:45–53Crossref, Medline, Google Scholar
54. Haznedar MM, Buchsbaum MS, Luu C, Hazlett EA, Siegel BV Jr, Lohr J, Wu J, Haier RJ, Bunney WE Jr: Decreased anterior cingulate gyrus metabolic rate in schizophrenia. Am J Psychiatry 1997; 154:682–684Link, Google Scholar
55. Fuster J: The Prefrontal Cortex. New York, Raven Press, 1989Google Scholar
56. Jones E: The Thalamus. New York, Plenum, 1985Google Scholar
57. Van Buren J, Borke R: Variations and Cerebral Connections of the Thalamus. New York, Springer-Verlag, 1972Google Scholar
58. Rose J, Woolsey C: The orbitofrontal cortex and its connections with the mediodorsal nucleus in rabbit, sheep, and cat. Association for Research in Nervous and Mental Disease Proceedings 1948; 27:210–282Google Scholar
59. Uylings H, Van Eden C: Qualitative and quantitative comparison of the prefrontal cortex in rat and in primates, including humans. Prog Brain Res 1990; 85:31–62Crossref, Medline, Google Scholar
60. Andreasen NC, O’Leary DS, Flaum M, Nopoulos P, Watkins GL, Boles Ponto LL, Hichwa RD: Hypofrontality in schizophrenia: distributed dysfunctional circuits in neuroleptic-naive patients. Lancet 1997; 349:1730–1734Google Scholar
61. Buchsbaum MS, Tang CY, Peled S, Gudbjartsson H, Lu D, Hazlett EA, Downhill J, Haznedar M, Fallon JH, Atlas SW: MRI white matter diffusion anisotropy and PET metabolic rate in schizophrenia. Neuroreport 1998; 9:425–430Crossref, Medline, Google Scholar
62. Katz M, Buchsbaum MS, Siegel BV, Wu J, Haier RJ, Bunney WE: Correlational patterns of cerebral glucose metabolism in never-medicated schizophrenics. Neuropsychobiology 1996; 33:1–11Crossref, Medline, Google Scholar
63. Hazlett EA, Buchsbaum MS, Haznedar MM, Singer MB, Schnur DB, Jimenez EA, Buchsbaum BR, Troyer BT: Prefrontal cortex glucose metabolism and startle eyeblink modification abnormalities in unmedicated schizophrenia patients. Psychophysiology 1998; 35:186–198Crossref, Medline, Google Scholar
64. Chakos MH, Lieberman JA, Bilder RM, Borenstein M, Lerner G, Bogerts B, Wu H, Kinon B, Ashtari M: Increase in caudate nuclei volume of first-episode schizophrenic patients taking antipsychotic drugs. Am J Psychiatry 1994; 151:1430–1436Google Scholar
65. Oke A, Putz C, Adam R, Bird E: Neuroleptic treatment is an unlikely cause of elevated dopamine in thalamus of schizophrenic subjects. Psychiatry Res Neuroimaging 1992; 45:203–208Crossref, Medline, Google Scholar