Incident Major Depressive Disorder Predicted by Three Measures of Insulin Resistance: A Dutch Cohort Study
Abstract
Objective:
Major depressive disorder is the leading cause of disability worldwide. Yet, there remain significant challenges in predicting new cases of major depression and devising strategies to prevent the disorder. An important first step in this process is identifying risk factors for the incidence of major depression. There is accumulating biological evidence linking insulin resistance, another highly prevalent condition, and depressive disorders. The objectives of this study were to examine whether three surrogate measures of insulin resistance (high triglyceride-HDL [high-density lipoprotein] ratio; prediabetes, as indicated by fasting plasma glucose level; and high central adiposity, as measured by waist circumference) at the time of study enrollment were associated with an increased rate of incident major depressive disorder over a 9-year follow-up period and to assess whether the new onset of these surrogate measures during the first 2 years after study enrollment was predictive of incident major depressive disorder during the subsequent follow-up period.
Methods:
The Netherlands Study of Depression and Anxiety (NESDA) is a multisite longitudinal study of the course and consequences of depressive and anxiety disorders in adults. The study population comprised 601 NESDA participants (18–65 years old) without a lifetime history of depression or anxiety disorders. The study’s outcome was incident major depressive disorder, defined using DSM-IV criteria. Exposure measures included triglyceride-HDL ratio, fasting plasma glucose level, and waist circumference.
Results:
Fourteen percent of the sample developed major depressive disorder during follow-up. Cox proportional hazards models indicated that higher triglyceride-HDL ratio was positively associated with an increased risk for incident major depression (hazard ratio=1.89, 95% CI=1.15, 3.11), as were higher fasting plasma glucose levels (hazard ratio=1.37, 95% CI=1.05, 1.77) and higher waist circumference (hazard ratio=1.11 95% CI=1.01, 1.21). The development of prediabetes in the 2-year period after study enrollment was positively associated with incident major depressive disorder (hazard ratio=2.66, 95% CI=1.13, 6.27). The development of high triglyceride-HDL ratio and high central adiposity (cut-point ≥100 cm) in the same period was not associated with incident major depression.
Conclusions:
Three surrogate measures of insulin resistance positively predicted incident major depressive disorder in a 9-year follow-up period among adults with no history of depression or anxiety disorder. In addition, the development of prediabetes between enrollment and the 2-year study visit was positively associated with incident major depressive disorder. These findings may have utility for evaluating the risk for the development of major depression among patients with insulin resistance or metabolic pathology.
Major depressive disorder is the leading cause of disability worldwide (1). Yet, there remain significant challenges in predicting new cases of major depression and devising strategies to prevent the disorder (2). An important first step in this process is identifying risk factors for the incidence of major depressive disorder.
There is accumulating biological evidence linking insulin resistance, another highly prevalent condition, with the development of depressive disorders (3–7). Animal models of insulin resistance show an increased risk of depression-like behaviors, as well as neuroinflammation, dysregulated mitochondrial function, and decreased neurogenesis, all factors hypothesized to be relevant to human depression (8, 9). In addition, studies show that treatment for insulin resistance in animals can reverse depression-like behavior (10–14).
A meta-analysis of the association between insulin resistance and major depressive disorder established a positive cross-sectional relationship between the two conditions (15). Additional studies indicate that major depressive disorder increases the risk for the subsequent development of type 2 diabetes and metabolic syndrome, endocrinologic conditions in which insulin resistance plays an important role (15–20). Yet few studies have examined whether insulin resistance increases the risk of incident major depressive disorder. Among them, a study of elderly men found that insulin resistance corresponded to a risk ratio of 2.3 for the development of incident depression in a 5-year follow-up period (21).
The Netherlands Study of Depression and Anxiety (NESDA) presents a unique opportunity to address the question of insulin resistance and incident major depressive disorder because it is among the few studies that have extensively assessed behavioral and psychosocial risk factors, metabolic function, and the incidence of major depression in a longitudinal design (22).
Here, we investigated whether insulin resistance increased the rate of incident major depressive disorder by using three surrogate measures of insulin resistance with up to 9 years of follow-up. In our primary analysis, we evaluated whether a high ratio of triglycerides to high-density lipoprotein (HDL) predicted incident major depressive disorder. This measure has been well correlated with the gold standard for insulin resistance and is often used in a clinical context. To evaluate the consistency of our findings, we also tested whether two related surrogate metabolic measures, fasting plasma glucose levels and waist circumference, were associated with incident major depression (23–26).
In our secondary analysis, we evaluated whether incident metabolic pathology in the 2 years following study enrollment corresponded to an increased rate of incident major depressive disorder in the subsequent 7 years of follow-up. We tested three related exposure measures: high triglyceride-HDL ratio, prediabetes (fasting plasma glucose level ≥5.54 mmol/L), and high central adiposity (high waist circumference).
Our objective was to define a subset of patients with major depression for whom a potential risk for depression is predicted by metabolic pathology. This, in turn, may inform future treatment and prevention strategies in this clinical population.
Methods
NESDA Sample and Study Design
Nine years of prospective data from the NESDA cohort (23) were used in this study. Briefly, NESDA aims to examine the etiology, course, and consequences of depression and anxiety, combining biological, behavioral, and psychosocial measures. It is a multisite longitudinal study using a Dutch cohort of participants who were 18 to 65 years old at enrollment. At enrollment, the cohort’s 2,981 participants were currently experiencing depression or anxiety, or had a lifetime history of depression or anxiety, or were control subjects with no history of either disorder. Individuals were excluded from NESDA enrollment if they did not speak Dutch or if they had a history of other psychiatric disorders (e.g., psychotic, obsessive-compulsive, bipolar, or severe addiction disorders) (23).
The present analysis was restricted to NESDA participants with no lifetime history of depression or anxiety disorders; among these, we excluded individuals who were lost to follow-up after study enrollment (N=601). Although the focus was on major depressive disorder onset, we also excluded those with a history of anxiety disorder because of high comorbidity among affective disorders and overlap in biological mechanisms (27, 28).
Participants were followed up at 2, 4, 6, and 9 years for a psychiatric interview (including screening for major depressive disorder, anxiety disorders, and bipolar disorder), questionnaires, physical measurements, and biospecimen collection (Figure 1). The NESDA protocol was approved by the ethical review board of the VU University Medical Center Amsterdam, and all participants provided written informed consent.
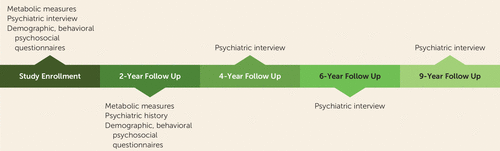
a Each point in the timeline represents a visit and describes measures used in the study.
Surrogate Measures of Insulin Resistance and Additional Metabolic Measures
The primary exposure was specified a priori as triglyceride-HDL ratio (both values measured in mmol/L), a surrogate measure of insulin resistance that is both informative and easy to obtain (29–31). We used sex-specific cut-points to define high triglyceride-HDL ratios (females, ≥0.83; males, ≥1.22) (31). The area under the curve was 0.76 when compared with the homeostatic model assessment of insulin resistance in a German population (31). This is consistent with findings from other studies of European populations.
Secondary exposure measures were also defined, including fasting plasma glucose levels (mmol/L), taken as a continuous variable, and prediabetes (fasting plasma glucose level ≥5.54 mmol/L) (32). Central adiposity was considered two ways. First, continuous central adiposity was measured by waist circumference (33, 34). Second, it was dichotomized, based on a cut-point of ≥100 cm to define high central adiposity, because this cut-point corresponds well to insulin resistance in both males and females, with an area under the curve ≥0.85 when compared with the homeostatic model of assessment for insulin resistance (24).
All laboratory measures were collected in the morning in a fasting state. Triglyceride, HDL, and fasting plasma glucose levels were adjusted for medication use based on the average decline in these values after treatment; this method was performed and described in a previous NESDA study (35).
Incident Major Depressive Disorder
Major depressive disorder was defined using the Composite International Diagnostic Interview (CIDI), version 2.1 (36), at each study visit. The CIDI is a comprehensive and fully standardized diagnostic interview designed to assess mental disorders according to DSM-IV criteria. At each study wave, the CIDI was used to evaluate whether participants experienced major depression since the last interview. Incident major depressive disorder was defined as the occurrence of a participant’s first depressive episode.
The recency of a depressive episode was reported by participants for the following intervals: within the past 2 weeks, 2 weeks to 1 month ago, 1 month to 6 months ago, 6 months to 12 months ago, and more than 12 months ago. The date of major depressive disorder onset was estimated using the date that the CIDI was administered minus the recency of the first depressive episode (using the midpoint of the reported time interval). For participants who experienced a depressive episode >12 months prior to the interview, we recorded major depressive disorder onset as the midpoint between 12 months ago and their previous study visit.
Participants were monitored until the first of the following events occurred: incident major depressive disorder or their last study visit. Follow-up time was measured as the difference between study enrollment and the incidence of major depressive disorder or a participant’s last study visit, whichever came first.
Covariates
The following variables were measured using self-report questionnaires: age at study enrollment, sex, years of education, physical activity (metabolic equivalent of task hours/week), and smoking status (current, former, or never). Harmful or hazardous drinking was measured using the Alcohol Use Disorders Identification Test, an inventory measuring risk for alcohol misuse (score range, 0–40, where a higher score represents a greater risk for misuse) (37). Additional details about these study measures can be found in the description of the design, methods, and rationale for the NESDA study (22).
Three confounders that were identified in previous research—race, marital status, and income—were not included in our analyses because their proportions were very similar between exposure groups in our study population.
Statistical Analysis
Means and frequencies summarized baseline participant characteristics stratified by high or low triglyceride-HDL ratio. All insulin resistance measures were compared using Pearson correlations to better understand the relationship between various measures of metabolic function in our study sample. In addition, the rate of incident major depressive disorder during the 9-year follow-up was summarized in a negative log survival plot, which is reflective of the hazard function of incident depression over the study period.
We evaluated associations between all exposures and the incidence of major depressive disorder by estimating hazard ratios and corresponding 95% confidence intervals using Cox regression analysis. Each exposure was evaluated separately. The linearity of the log hazard of incident major depressive disorder and the proportional hazards assumption were tested with graphical methods, including the evaluation of Schoenfeld residuals and Martingale residuals. Nonproportional hazards among exposure variables and covariates were addressed with a time-by-exposure interaction.
The possible confounding effects of sociodemographic and behavioral variables were accounted for by statistical adjustment, including age, sex, education, physical activity, harmful alcohol use, and smoking status.
We then evaluated whether the newly onset metabolic pathology between study enrollment and the 2-year follow-up visit was associated with an increased rate of incident major depression in the subsequent 7 years. Each analysis was restricted to participants who did not have the metabolic pathology at enrollment and did not develop major depression between enrollment and the 2-year follow-up visit. Models were adjusted for the same confounders as our primary analysis. Sex and smoking status were derived using data from the study enrollment visit. All remaining confounders were based on measures from the 2-year follow-up visit.
Given differences between men and women in the frequency of high triglyceride-HDL ratio in this study population (Table 1), we repeated our primary analysis with multiplicative sex-by-exposure interactions.
| Characteristic | Whole Group | High Triglyceride-HDL Ratio | Low Triglyceride-HDL Ratio | |||
|---|---|---|---|---|---|---|
| (N=601) | (N=161) | (N=440) | ||||
| N | % | N | % | N | % | |
| Female | 365 | 60.6 | 86 | 53.1 | 279 | 63.4 |
| Marital status, married or partner | 454 | 75.4 | 454 | 78.4 | 327 | 74.3 |
| Northern European ancestry | 582 | 96.7 | 158 | 97.5 | 424 | 96.4 |
| Mean | SD | Mean | SD | Mean | SD | |
| Age (years) | 40.9 | 14.5 | 44.3 | 14.2 | 39.6 | 14.4 |
| Education (years) | 12.9 | 3.2 | 12.3 | 3.2 | 13.1 | 3.2 |
| Income (score 0–23)b | 11.0 | 6.0 | 10.9 | 5.9 | 11.1 | 6.0 |
| Alcohol Use Disorders Identification Test score | 4.7 | 3.6 | 4.9 | 4.0 | 4.7 | 3.4 |
| Physical activity (metabolic equivalents, hours/week) | 64.3 | 52.7 | 59.7 | 53.8 | 66.2 | 52.3 |
| Fasting plasma glucose (mmol/L)c | 5.1 | 0.8 | 5.4 | 1.1 | 5.0 | 0.7 |
| Waist circumference (cm) | 88.0 | 13.5 | 96.5 | 14.1 | 84.8 | 11.9 |
| HDL (mmol/L)c | 1.6 | 0.4 | 1.3 | 0.3 | 1.8 | 0.4 |
| Triglycerides (mmol/L)c | 1.3 | 0.8 | 2.2 | 1.0 | 0.9 | 0.3 |
| Triglyceride-HDL ratio | 0.9 | 0.8 | 1.8 | 1.0 | 0.6 | 0.2 |
TABLE 1. Baseline demographic and clinical characteristics of adult participants (18–65 years old) by triglyceride-HDL ratioa
Missing data were imputed 10 times using fully conditional specification methods; categorical data were filled in with the discriminant function and continuous variables with the regression function (missing data ranged from 1% for harmful alcohol use to 14% for triglyceride levels).
Analyses were performed with SAS, version 9.4 (38).
Results
The median follow-up time was 9 years (interquartile range, 6–9 years). The mean triglyceride-HDL ratio was 0.88 (SD=0.78). On average, participants with a high triglyceride-HDL ratio were older, less likely to be female, less educated, and less physically active compared with those with a low triglyceride-HDL ratio. A NESDA study published in 2012 found that participants with no history of depression or anxiety had prevalences of 2.8% for cardiovascular disease, 39.0% for hypertension, 16.8% for impaired fasting glucose, and 14.6% for obesity, and 21.3% had at least one chronic disease at baseline (3). Surrogate insulin resistance measures were moderately correlated (fasting plasma glucose level and waist circumference, r=0.44; triglyceride-HDL ratio and waist circumference, r=0.41; triglyceride-HDL ratio and fasting plasma glucose level, r=0.21). Among our study population of individuals with no history of major depression, a total of 14.0% reported incident major depression (N=84; N=30 after 2 years) during the 9-year follow-up period.
Negative log survival plots suggested an association between high triglyceride-HDL ratio and major depressive disorder incidence. Findings were similar when stratified by high and low waist circumference and by prediabetes and no prediabetes. Negative log survival plots suggested an association between high triglyceride-HDL ratio and the incidence of major depression. Findings were similar when stratified by high and low waist circumference and by prediabetes and no prediabetes (triglyceride-HDL ratio, N=405; high central adiposity, N=367; prediabetes, N=426).
In adjusted analyses, triglyceride-HDL ratio, taken as a continuous variable, was associated with an increased risk for incident major depressive disorder in the 9-year follow-up period (hazard ratio=1.89, 95% CI=1.15, 3.11). Similarly, fasting plasma glucose level and waist circumference were also positively associated with incident major depression in the same follow-up period (Table 2).
| Model | Adjusted Hazard Ratio | 95% CI |
|---|---|---|
| Model 1: triglyceride-HDL ratio (insulin resistance; 1 ratio unit) | 1.89 | 1.15, 3.11 |
| Model 2: waist circumference (5 cm) | 1.11 | 1.01, 1.21 |
| Model 3: fasting plasma glucoseb (1 mmol/L) | 1.37 | 1.05, 1.77 |
TABLE 2. Cox regression models of the association between triglyceride-HDL ratio, waist circumference, and fasting plasma glucose level at study enrollment and incident major depressive disorder in adults (N=601)a
In Cox proportional hazards models of incident insulin resistance (categorical measures for newly onset high triglyceride-HDL ratio, high waist circumference, and prediabetes) between study enrollment and the 2-year follow-up visit as exposure, the incidence of prediabetes was positively associated with incident major depression (hazard ratio=2.66, 95% CI=1.13, 6.27). However, incident high triglyceride-HDL ratio and high waist circumference were not associated with incident major depression (Table 3). In all cases, confidence intervals were wide as a result of the small number of incident cases.
| Model | Eventsb | Total Follow-Up Person-Years | Adjusted Hazard Ratio | 95% CI |
|---|---|---|---|---|
| Model 1: high triglyceride-HDL ratio: females ≥0.83; males ≥1.22 (N=405) | 41 | 3,362 | 1.77 | 0.77, 4.10 |
| Model 2: high central adiposity: waist circumference ≥100 cm (N=367) | 35 | 3,087 | 0.48 | 0.06, 3.69 |
| Model 3: prediabetes: fasting plasma glucose ≥5.54 mmol/L (N=426) | 47 | 3,542 | 2.66 | 1.13, 6.27 |
TABLE 3. Cox regression models of the association between the development of high triglyceride-HDL ratio, high central adiposity, and prediabetes at the 2-year follow-up and incident major depressive disorder in adultsa
We found no effect modification between sex and exposure for all three exposure measures by sex. The following interaction terms represent the ratio by which the hazard ratio changed when participants were female rather than male: 0.95, 95% CI=0.92, 1.01; fasting plasma glucose level by sex, 0.85, 95% CI=0.52, 1.40; waist circumference by sex, 1.01, 95% CI=0.97, 1.05.
Discussion
We found that a moderate clinical increase in a surrogate measure of insulin resistance (i.e., a one-unit change in triglyceride-HDL ratio) corresponded to an 89% increase in the rate of incident major depressive disorder in a 9-year follow-up period. Thus, our results suggest that a surrogate of insulin resistance, a highly prevalent condition that may precede the development of type 2 diabetes by several years, may predict the development of major depressive disorder in adults.
These conclusions are broadly consistent with research on the relationship between other metabolic conditions and the development of major depressive disorder. A study of elderly males living in Australia found that insulin resistance values ≥1.85, as measured by the homeostasis model assessment of insulin resistance, corresponded to an odds ratio of 1.61 for major depression in a 5-year follow-up period (21). A meta-analysis that evaluated the relationship between metabolic syndrome and incident major depressive disorder among elderly and nonelderly adults in Europe, the United States, Australia, and Japan found that metabolic syndrome was associated with a 49% increased odds of incident major depression (39). Another meta-analysis of adults in several countries found that the presence of type 2 diabetes was associated with a 15% increased risk of major depression; follow-up time in these studies ranged from 2 to 10 years (16).
Multiple biological mechanisms may link insulin resistance to the development of major depression. The presence of insulin resistance appears to promote neuroinflammation in neurobiological models of depression (4, 40). The inflammatory hypothesis of depression suggests that the presence of proinflammatory cytokines may lead to a reduction in serotonin levels, as well as reduced neurogenesis and synaptic plasticity-physiological states, which are associated with the presence of depression (41–43). Moreover, insulin resistance is associated with dysregulation of glucocorticoids in the hypothalamic-pituitary-adrenal axis, a state which has been reliably associated with the presence of depressive disorders (9, 40). The common pathophysiological platform between insulin resistance and depressive disorders has been reported previously by our group (44, 45) and other investigators (46) and is distinct from the findings of the metabolic syndrome construct reported previously in the NESDA cohort.
Insulin resistance is a condition that may progress from compensatory hyperinsulinemia to impaired glucose tolerance, prediabetes, and, ultimately, type 2 diabetes (47). We therefore measured the association between two additional exposure measures and incident major depressive disorder to evaluate consistency across these overlapping measures of metabolic function. Indeed, when using central adiposity, we found that a 5-cm increase in waist circumference at enrollment corresponded to an average 11% increased rate of major depression in the 9-year follow-up period. Similarly, we found that a one-unit increase in fasting plasma glucose level (mmol/L), which represents a moderate rise in blood glucose levels, corresponded to a 37% increased rate of incident major depression in the follow-up period, indicating that all three exposures (triglyceride-HDL ratio, fasting plasma glucose level, and waist circumference) in this study were positively associated with an increased incidence of major depression.
We did not detect an interaction between sex and any exposure measure for the rate of incident major depression, suggesting that the effect of insulin resistance on our outcome was similar for men and women. Few studies have evaluated sex differences in the rate of incident major depressive disorder based on metabolic function. Two studies that assessed questions concerning mean differences in depression characteristics by sex found mixed results (48, 49).
Our secondary aim was to assess whether the recent onset of metabolic pathology was associated with the incidence of major depression. We found that the new development of prediabetes in a 2-year time period, but not high triglyceride-HDL ratio or high central adiposity, was predictive of new major depressive disorder. However, the confidence intervals were wide for this secondary analysis. A larger sample size may be warranted in order to address this question because our sample for this portion of the analysis was limited to individuals who did not develop major depression before the 2-year visit and were free of the relevant metabolic pathology at baseline. While high triglyceride-HDL ratio and high central adiposity are surrogate markers of insulin resistance, in themselves, they may not be predictive of the incidence of major depressive disorder, especially in the absence of elevated fasting glucose levels. Prediabetes, however, is a state where hyperglycemia is present in addition to insulin resistance; therefore, the development of prediabetes could plausibly predict incident major depression, whereas insulin resistance alone does not.
This study has several limitations. The gold standard for measuring insulin resistance, the euglycemic clamp technique, was not available. Therefore, we included clinically accessible surrogate biomarkers of insulin resistance. In addition, this analysis was not powered to measure the development of metabolic pathology in a 2-year follow-up period. Replication of these findings and additional analysis on the onset of prediabetes as it relates to the onset of major depression would be useful.
Indeed, there was a loss of follow-up for a number of participants, with reasons including health issues, refusal to participate, death, and noncontact (50). However, overall attrition was relatively low for a psychiatric study: 12.9% between baseline and 2 years for the entire NESDA sample.
In spite of these issues, the ability to predict an increased risk in major depressive disorder incidence using standard clinical tests of metabolic status can be deployed as an important tool for treatment and prevention. Indeed, our own work suggests that certain treatments that decrease insulin resistance can aid in the treatment of major depression in a subset of patients. It will be especially important to ascertain in future studies whether reversing insulin resistance is able to decrease the risk of future clinical depression.
In summary, the development of clinically significant prediabetes between study enrollment and the 2-year follow-up visit may have increased the rate of major depressive disorder in the subsequent 7 years, whereas high triglyceride-HDL ratio and high central adiposity did not. If replicated, these findings may have utility for physicians and researchers evaluating the risk for the development of major depression, as well as implications for our understanding of major depressive disorder pathogenesis.
1. : Depression is the leading cause of disability around the world . JAMA 2017 ; 317 : 1517 Google Scholar
2. : Understanding the heterogeneity of depression through the triad of symptoms, course and risk factors: a longitudinal, population-based study . J Affect Disord 2000 ; 59 : 1 – 11 Crossref, Medline, Google Scholar
3. : Common mental disorders associated with 2-year diabetes incidence: the Netherlands Study of Depression and Anxiety (NESDA) . J Affect Disord 2012 ; 142 ( Suppl ): S30 – S35 doi: 10.1016/S0165-0327(12)70006-X Crossref, Medline, Google Scholar
4. : The association between depressive symptoms and insulin resistance, inflammation and adiposity in men and women . PLoS One 2017 ; 12 ( 11 ): e0187448 Crossref, Medline, Google Scholar
5. : Insulin resistance, affective disorders, and Alzheimer’s disease: review and hypothesis . J Gerontol A Biol Sci Med Sci 2004 ; 59 : 178 – 183 , discussion 184–192 Crossref, Medline, Google Scholar
6. : Does pioglitazone improve depression through insulin-sensitization? results of a randomized double-blind metformin-controlled trial in patients with polycystic ovarian syndrome and comorbid depression . Psychoneuroendocrinology 2013 ; 38 : 767 – 776 Crossref, Medline, Google Scholar
7. : Insulin resistance, an unmasked culprit in depressive disorders: promises for interventions . Neuropharmacology 2018 ; 136 ( Pt B ): 327 – 334 Crossref, Medline, Google Scholar
8. : Neuroendocrine link between stress, depression and diabetes . Pharmacol Rep 2013 ; 65 : 1591 – 1600 Crossref, Medline, Google Scholar
9. : Is there a “metabolic-mood syndrome”? A review of the relationship between obesity and mood disorders . Neurosci Biobehav Rev 2015 ; 52 : 89 – 104 Crossref, Medline, Google Scholar
10. : NMDA receptor involvement in antidepressant-like effect of pioglitazone in the forced swimming test in mice . Psychopharmacology (Berl) 2012 ; 223 : 345 – 355 Crossref, Medline, Google Scholar
11. : Antidepressant-like effect of pioglitazone in the forced swimming test in mice: the role of PPAR-gamma receptor and nitric oxide pathway . Behav Brain Res 2011 ; 224 : 336 – 343 Crossref, Medline, Google Scholar
12. : WY14643 produces anti-depressant-like effects in mice via the BDNF signaling pathway . Psychopharmacology (Berl) 2015 ; 232 : 1629 – 1642 Crossref, Medline, Google Scholar
13. : Antidepressant-like effect of atorvastatin in the forced swimming test in mice: the role of PPAR-gamma receptor and nitric oxide pathway . Eur J Pharmacol 2014 ; 745 : 52 – 58 Crossref, Medline, Google Scholar
14. : Pioglitazone, a PPARγ agonist rescues depression associated with obesity using chronic unpredictable mild stress model in experimental mice . Neurobiol Stress 2016 ; 3 : 114 – 121 Crossref, Medline, Google Scholar
15. : Association between metabolic syndrome and depressive symptoms in middle-aged adults: results from the Whitehall II study . Diabetes Care 2009 ; 32 : 499 – 504 Crossref, Medline, Google Scholar
16. : Bidirectional association between depression and metabolic syndrome: a systematic review and meta-analysis of epidemiological studies . Diabetes Care 2012 ; 35 : 1171 – 1180 Crossref, Medline, Google Scholar
17. : Diabetes mellitus, glycemic control, and incident depressive symptoms among 70- to 79-year-old persons: the health, aging, and body composition study . Arch Intern Med 2007 ; 167 : 1137 – 1144 Crossref, Medline, Google Scholar
18. : Vascular disease and future risk of depressive symptomatology in older adults: findings from the Health, Aging, and Body Composition study . Biol Psychiatry 2008 ; 64 : 320 – 326 Crossref, Medline, Google Scholar
19. : Metabolic syndrome predisposes to depressive symptoms: a population-based 7-year follow-up study . J Clin Psychiatry 2008 ; 69 : 178 – 182 Crossref, Medline, Google Scholar
20. : Bidirectional prospective associations of metabolic syndrome components with depression, anxiety, and antidepressant use . Depress Anxiety 2016 ; 33 : 754 – 764 Crossref, Medline, Google Scholar
21. : Insulin resistance and depressive symptoms in older men: the health in men study . Am J Geriatr Psychiatry 2015 ; 23 : 872 – 880 Crossref, Medline, Google Scholar
22. : The Netherlands Study of Depression and Anxiety (NESDA): rationale, objectives and methods . Int J Methods Psychiatr Res 2008 ; 17 : 121 – 140 Crossref, Medline, Google Scholar
23. : Surrogate measures of insulin sensitivity vs the hyperinsulinaemic-euglycaemic clamp: a meta-analysis . Diabetologia 2014 ; 57 : 1781 – 1788 Crossref, Medline, Google Scholar
24. : Use of waist circumference to predict insulin resistance: retrospective study . BMJ 2005 ; 330 : 1363 – 1364 Crossref, Medline, Google Scholar
25. : PPAR-γ agonists for the treatment of major depression: a review . Pharmacopsychiatry 2017 ; 50 : 49 – 55 Medline, Google Scholar
26. : Pioglitazone could induce remission in major depression: a meta-analysis . Neuropsychiatr Dis Treat 2016 ; 13 : 9 – 16 Crossref, Medline, Google Scholar
27. : The overlap between anxiety, depression, and obsessive-compulsive disorder . Dialogues Clin Neurosci 2015 ; 17 : 249 – 260 Crossref, Medline, Google Scholar
28. : Comorbid depression and anxiety spectrum disorders . Depress Anxiety 1996 –1997; 4 (
29. : Should triglycerides and the triglycerides to high-density lipoprotein cholesterol ratio be used as surrogates for insulin resistance? Metabolism 2010 ; 59 : 299 – 304 Crossref, Medline, Google Scholar
30. : Does the association of the triglyceride to high-density lipoprotein cholesterol ratio with fasting serum insulin differ by race/ethnicity? Cardiovasc Diabetol 2008 ; 7 : 4 Crossref, Medline, Google Scholar
31. : Impact of the triglyceride/high-density lipoprotein cholesterol ratio and the hypertriglyceremic-waist phenotype to predict the metabolic syndrome and insulin resistance . Horm Metab Res 2017 ; 49 : 542 – 549 Crossref, Medline, Google Scholar
32. : A1C versus glucose testing: a comparison . Diabetes Care 2011 ; 34 : 518 – 523 Crossref, Medline, Google Scholar
33. : BMI and waist circumference cut-offs for corresponding levels of insulin sensitivity in a Middle Eastern immigrant versus a native Swedish population: the MEDIM population based study . BMC Public Health 2016 ; 16 : 1242 Crossref, Medline, Google Scholar
34. : Obesity index that better predict metabolic syndrome: body mass index, waist circumference, waist hip ratio, or waist height ratio . J Obes 2013 ; 2013 : 269038 Crossref, Medline, Google Scholar
35. : Longitudinal associations between metabolic syndrome components and telomere shortening . J Clin Endocrinol Metab 2015 ; 100 : 3050 – 3059 Crossref, Medline, Google Scholar
36. : Reliability and validity studies of the WHO—Composite International Diagnostic Interview (CIDI): a critical review . J Psychiatr Res 1994 ; 28 : 57 – 84 Crossref, Medline, Google Scholar
37. : The Alcohol Use Disorders Identification Test (AUDIT): validation of a screening instrument for use in medical settings . J Stud Alcohol 1995 ; 56 : 423 – 432 Crossref, Medline, Google Scholar
38.
39. : Depression and type 2 diabetes over the lifespan: a meta-analysis . Diabetes Care 2008 ; 31 : 2383 – 2390 Crossref, Medline, Google Scholar
40. : Pathological parainflammation and endoplasmic reticulum stress in depression: potential translational targets through the CNS insulin, klotho and PPAR-γ systems . Mol Psychiatry 2013 ; 18 : 154 – 165 Crossref, Medline, Google Scholar
41. : The fiery landscape of depression: a review of the inflammatory hypothesis . Pak J Med Sci 2013 ; 29 : 877 – 884 Medline, Google Scholar
42. : Hippocampal atrophy in recurrent major depression . Proc Natl Acad Sci USA 1996 ; 93 : 3908 – 3913 Crossref, Medline, Google Scholar
43. : Neurobiology of depression . Neuron 2002 ; 34 : 13 – 25 Crossref, Medline, Google Scholar
44. : Insulin resistance in depressive disorders and Alzheimer’s disease: revisiting the missing link hypothesis . Neurobiol Aging 2005 ; 26 ( Suppl 1 ): 103 – 107 Crossref, Medline, Google Scholar
45. : Insulin resistance: a missing link no more . Mol Psychiatry 2016 ; 21 : 1648 – 1652 Crossref, Medline, Google Scholar
46. : Bipolar disorder and diabetes mellitus: epidemiology, etiology, and treatment implications . Ann Clin Psychiatry 2005 ; 17 : 83 – 93 Crossref, Medline, Google Scholar
47. : Pathogenesis of type 2 diabetes mellitus . Med Clin North Am 2004 ; 88 : 787 – 835, ix Crossref, Medline, Google Scholar
48. : Association between metabolic syndrome and depressive symptom profiles—sex-specific? J Affect Disord 2013 ; 151 : 1138 – 1142 Crossref, Medline, Google Scholar
49. : Sex differences in the relation of depressive symptoms, hostility, and anger expression to indices of glucose metabolism in nondiabetic adults . Health Psychol 2006 ; 25 : 484 – 492 Crossref, Medline, Google Scholar
50. : Sociodemographic and psychiatric determinants of attrition in the Netherlands Study of Depression and Anxiety (NESDA) . Compr Psychiatry 2012 ; 53 : 63 – 70 Crossref, Medline, Google Scholar