Dissociated Functional Brain Abnormalities of Inhibition in Boys With Pure Conduct Disorder and in Boys With Pure Attention Deficit Hyperactivity Disorder
Abstract
Objective: Inhibitory dysfunction may be a transdiagnostic etiopathophysiology of disruptive behavior disorders. Functional magnetic resonance imaging (fMRI) of inhibitory control has only been investigated in patients with attention deficit hyperactivity disorder (ADHD), including comorbidity with conduct disorder, showing frontal-striatal dysfunction. This study investigates differences and commonalities in functional neural networks mediating inhibitory control between medication-naive adolescents with pure conduct disorder and those with pure ADHD to identify biological markers that distinguish these clinically overlapping disorders. Method: Event-related fMRI was used to compare brain activation of 13 boys with noncomorbid conduct disorder, 20 with noncomorbid ADHD, and 20 normal boys during an individually adjusted tracking stop task that measures the neural substrates of inhibition and stopping failure. Results: During successful inhibition, only patients with ADHD showed reduced activation in the left dorsolateral prefrontal cortex in relation to comparison subjects and patients with conduct disorder. During inhibition failures compared to go responses, both patient groups shared underactivation in the posterior cingulate gyrus in relation to comparison subjects. Patients with conduct disorder showed reduced activation in bilateral temporal-parietal regions compared to the other groups, which did not differ in this measure. Conclusions: Patients with pure ADHD or pure conduct disorder show qualitative differences in their brain abnormality patterns during inhibitory control. Inhibition-mediating prefrontal regions appear to be specifically reduced in ADHD, whereas posterior temporal-parietal, performance monitoring networks are specifically dysfunctional in conduct disorder. The findings provide pioneering evidence that distinct neurobiological abnormalities may be underlying the overlapping behavioral phenotype of the two disruptive disorders.
Abnormalities in inhibitory networks have been hypothesized to be a shared and transdiagnostic pathophysiological substrate of disruptive behavior disorders (1) . Attention deficit hyperactivity disorder (ADHD), characterized by behavioral features of inattention, impulsiveness, and hyperactivity (DSM-IV, reference 1 ) has consistently been associated with neuropsychological deficits in inhibitory functions (2 , 3) and with brain abnormalities in the inhibition-mediating inferior and dorsolateral prefrontal cortex, the cingulate, and the caudate (2 , 4 – 8) .
Conduct disorder, a disorder of proactive aggression and antisocial behavior, overlaps clinically, behaviorally, and cognitively with ADHD, and a high comorbidity exists between both disorders (9) . Uncertainty about the distinction between the disorders has led to clinical difficulties expressed in differences in diagnostic schemes: in the DSM-IV, they are treated as independent disorders; in the ICD-10, the mixed state is regarded as a subtype of hyperkinetic disorder (10) . Furthermore, it has been uncertain whether conduct disorder has a neurobiological basis other than that associated with ADHD (11) . A dysfunction in inhibitory networks may be a distinctive neurocognitive basis of conduct disorder. Deficits in frontal-temporal/limbic inhibitory mechanisms have been suggested to account for the lack of control over aggressive and antisocial behaviors (12) . Neuropsychological studies show that children with conduct disorder/oppositional defiant disorder alone are also impaired in their inhibitory capacity (13) . Although findings are less consistent with smaller effect sizes (14) and in comorbid cases, ADHD symptoms account more for poor inhibitory performance than symptoms of oppositional deviant disorder/conduct disorder (15) .
Electrophysiological studies show that children with conduct disorder/oppositional defiant disorder alone differ from comparison subjects in their frontal- and parietal-evoked potentials during attention and inhibition tasks (1 , 16 , 17) but not from a pure ADHD group (1 , 16) . The only functional magnetic imaging (fMRI) study of children with conduct disorder comorbid with ADHD found abnormal anterior cingulate activation in relation to comparison subjects during emotion processing (18) , and there is evidence for structural abnormalities in the temporal lobes (19) . No fMRI study to date, however, has investigated the neurofunctional substrate of inhibitory control in patients with conduct disorder or how it differs from that of ADHD patients. Modern functional neuroimaging will be an important aid in the differentiation of clinically similar disorders if it can identify differences in the objectively measurable pathophysiological mechanisms or “biomarkers” that underlie overlapping behavior features.
The aim of this study was to use fMRI to investigate the differences and commonalities in the neurobiology of inhibitory control in a carefully selected pediatric patient group meeting criteria for noncomorbid conduct disorder compared to healthy adolescents and to adolescents with noncomorbid ADHD. For this purpose, we used an individually adjusted stop task that controls for performance differences and measures the neural correlates of successful inhibition and inhibitory failure.
Based on previous evidence from fMRI studies in adolescents with ADHD, we hypothesized that ADHD children in relation to comparison subjects would show reduced activation in lateral prefrontal and cingulate regions during task performance (2 , 6 , 7 , 20) . Based on the relatively scarce neurobiological literature on conduct disorder, we hypothesized that children with noncomorbid conduct disorder would be characterized by dissociated abnormalities in frontal, cingulate, and temporal-parietal brain regions during inhibitory performance (1 , 18 , 19) .
Method
Subjects
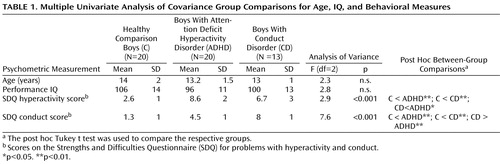
Patients were 33 right-handed male adolescents with a clinical diagnosis of either conduct disorder (N=13) or ADHD (N=20), within the age range from 9 to 16 years ( Table 1 ) and recruited from parent support groups, clinics, and advertisements. A clinical diagnosis of a combined subtype of ADHD without the diagnosis of conduct disorder/oppositional defiant disorder and of conduct disorder without clinical ADHD symptoms (DSM-IV, 21) was established through interviews with a child psychiatrist with the standardized Maudsley diagnostic interview (22) , which contains items on symptoms of ADHD and conduct disorder, together with autism and other pervasive developmental disorders, bipolar disorder, and affective and anxiety disorders. Exclusion criteria were comorbidity with other psychiatric disorders, learning disability, a specific reading disorder, neurological abnormalities, epilepsy, drug or substance abuse, and previous exposure to stimulant medication. All patients with ADHD scored above the threshold on the hyperactivity scale, and all patients with conduct disorder scored above the threshold on the conduct disorder scale of the Strengths and Difficulties Questionnaire (23) ( Table 1 ); all patients with conduct disorder also met criteria for oppositional defiant disorder.
Comparison subjects were 20 right-handed healthy male adolescents in the age range of 10 to 17 with no history of prior diagnosis of ADHD or any other mental or neurological disorder. They scored below the threshold on the Strengths and Difficulties Questionnaire in total score and component scales of hyperactivity, conduct problems, and emotional problems and had no history of taking neurotropic medication or of drug and substance abuse ( Table 1 ). All participants scored above the cutoff on the Raven’s Standard Progressive Matrices Intelligence Questionnaire (i.e., over 75; fifth percentile) (24) . Written informed consent/assent was given for all participants, and the study was approved by the local ethical committee.
One-way analyses of variance (ANOVAs) showed that the groups did not differ significantly in age and IQ ( Table 1 ). As expected, the groups differed significantly in their scores on the hyperactivity and the conduct component scales of the Strengths and Difficulties Questionnaire. Post hoc Tukey’s test revealed that the ADHD patients scored significantly higher than both the comparison subjects and the conduct disorder children on the hyperactivity scale. Conduct disorder children scored significantly higher on the conduct disorder subscale than both comparison subjects and ADHD patients ( Table 1 ).
fMRI Paradigm: Stop Task
Rapid, mixed trial, event-related fMRI design was used with jittered intertrial intervals and randomized presentation to optimize statistical efficiency. The subjects practiced the stop task once before scanning.
The visual tracking stop task requires withholding of a motor response to a go stimulus when it is followed unpredictably by a stop signal (3 , 7 , 25 , 26) . The basic task is a choice reaction time task (left and right pointing arrows: go signals) with a mean intertrial interval of 1.8 seconds. In 20% of the trials, pseudorandomly interspersed, the go signals are followed (about 250 msec later) by arrows pointing upward (stop signals), and the subjects have to inhibit their motor responses. A tracking algorithm changes the time interval between go-signal and stop-signal onsets according to each subject’s inhibitory performance to ensure that the task is equally challenging for each individual and to provide 50% successful and 50% failed inhibition trials (for details, see references 3 , 7 , 25 , 26) .
In the event-related fMRI analysis, brain activation to the 50% successful stop trials is contrasted with that of the 50% failed stop trials (i.e., successful versus failed stop trials) in order to control for attentional effects of the low-frequency appearance of stop trials. Activation to go-response trials is subtracted from activation to failed stop trials to control for brain activation related to motor response execution (i.e., failed stop versus go response trials).
Performance Data Analysis
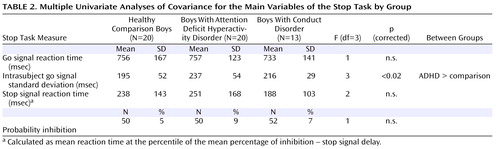
Although there were no significant differences in age, the ADHD and conduct disorder children were, on average, several months younger than the comparison subjects. Consequently, univariate analyses of covariance (ANCOVAs), with age as covariates, were used to compare the main variables of the stop task performance between the three groups: mean reaction time to go trials; stop signal reaction time, the indicator of the speed of the inhibitory process, calculated by subtracting the mean stop signal delay (the average time between go and stop signal, at which the subject managed to inhibit 50% of trials) from the mean reaction time to go trials (i.e., mean reaction time – stop signal delay) and the probability of inhibition to stop trials. P values were adjusted for multiple testing with the false discovery rate (27) .
fMRI Image Acquisition
Gradient-echo echoplanar MRI (echoplanar imaging) data were acquired on a GE Signa 1.5T Horizon LX System (General Electric, Milwaukee) at the Maudsley Hospital, London. Consistent image quality was ensured with a semiautomated quality control procedure. A quadrature birdcage head coil was used for radio frequency transmission and reception. In each of 16 noncontiguous planes parallel to the anterior-posterior commissure, 196 T 2 *-weighted MRI depicting BOLD (blood-oxygen-level-dependent) contrast covering the whole brain were acquired with TE=40 msec, TR=1.8 sec, flip angle=90°, in-plane resolution=3.1 mm, slice thickness=7 mm, and slice skip=0.7 mm.
fMRI Image Analysis
Time series analysis for each individual subject was based on a previously published wavelet-based data resampling method for fMRI data (28 , 29) . With rigid body and affine transformation, the individual maps were registered into Talairach and Tournoux standard space (30) . A generic brain activation map was then produced for each experimental condition, and hypothesis testing was carried out at the cluster level, shown to give excellent cluster-wise type I error control in structural and functional fMRI analysis (29) . Less than one false positive activated cluster was expected at a p value of <0.05 at the voxel level and <0.05 at the cluster level. For the between-group comparisons, three-way ANCOVA with age as a covariate as a factor was conducted with a randomization-based test for voxel or cluster-wise differences, as described in detail by Bullmore et al. (28 , 29) . For these between-group comparisons, less than one false activated cluster was expected at p<0.05 for voxel and p<0.03 for cluster comparisons. Then scalar measures of BOLD response for each participant were extracted in each of the significant clusters of the three-group ANCOVA, and post hoc Tukey’s honestly significant difference t tests (correcting for multiple comparisons) were conducted on these measures to identify two-way comparisons.
For the between-group ANCOVA interaction for the two contrasts, only BOLD responses were considered in all three groups that were positive (i.e., “in phase”) relative to the activation condition of interest.
Correlation Between Brain Activation, Performance, and Symptoms
A scalar measure of BOLD response for each participant was extracted in each of the significant clusters of between-group activation differences. Pearson correlations were then calculated between these and performance measures in healthy comparison subjects. Within patients, brain activation in these clusters was correlated with symptom measures on the Strengths and Difficulties Questionnaire scores for hyperactivity or conduct disorder, respectively.
Results
Task Performance
Univariate ANCOVAs showed that ADHD patients had a greater variability in their response time to the go signals compared to the other groups (F=3, df=3, p<0.02), which, however, did not survive correction for multiple testing ( Table 2 ).
Brain Activation
Motion ANOVA showed no significant between-group differences in the extent of three-dimensional motion during the task performance.
Successful Versus Failed Stop Trials
Within-group activations are shown in Figure 1 and data supplement Table 1 (available at http://ajp.psychiatryonline.org). Comparison subjects activated prefrontal, temporal, and anterior and posterior cingulate cortices. Children with ADHD activated similar brain regions and the vermis of the cerebellum. Children with conduct disorder activated prefrontal and middle temporal lobes and the posterior cingulate, striatum, and cerebellum.
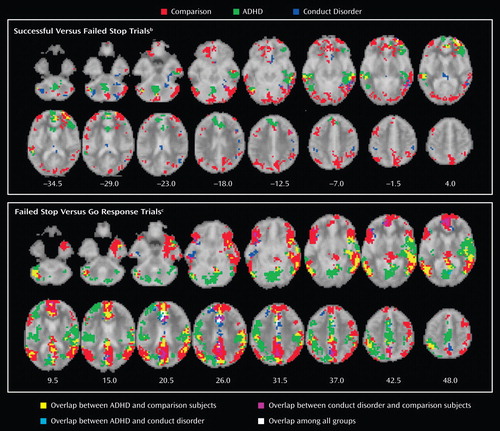
a Those p values were selected to yield less than one false positive cluster per brain map. Talairach z coordinates are indicated for slice distance (in mm) from the intercomissural line. The right side of the picture corresponds to the right side of the brain.
b Contrast of brain activation to the 50% successful stop trials to that of the 50% failed stop trials to control for attentional effects of the stop trials" low frequency of appearance.
c Go response trial brain activation was subtracted from activation to failed stop trials to control for brain activation related to motor response execution.
Group Effects
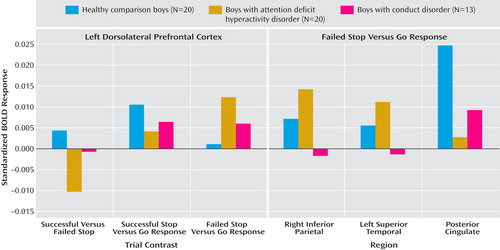
Three-group ANCOVA with covariance for age showed a significant group effect in left dorsolateral prefrontal activation ( Table 3 , Figure 2 ). A post hoc t test for this contrast showed that the BOLD response in this region was significantly reduced in patients with ADHD in relation to comparison subjects (p<0.001) and compared to patients with conduct disorder (p<0.03), who did not differ from comparison subjects. BOLD response estimates show that this group effect was due to a (nonsignificantly) greater BOLD response in comparison subjects for the contrast of successful stop – go but a (nonsignificantly) larger BOLD response in patients for the contrast of failed stop – go (see Figure 3 ). Activation in this area was significantly negatively correlated with stop signal reaction time in healthy comparison subjects (r=–0.5, p<0.02).

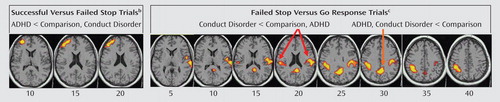
a Talaraich z coordinates are indicated for slice distance (in mm) from the intercommissural line. The right side of the picture corresponds to the right side of the brain.
b Contrast of brain activation to the 50% successful stop trials to that of the 50% failed stop trials to control for attentional effects of the stop trials" low frequency of appearance. The activation cluster in the left middle/inferior frontal lobe was reduced in patients with attention deficit hyperactivity disorder compared to the other two groups.
c Go response trial brain activation was subtracted from activation to failed stop trials to control for brain activation related to motor response execution. The cluster in the posterior cingulate gyrus was decreased in both patient groups in relation to comparison subjects. The cluster in the left inferior parietal lobe and in the right inferior parietal/superior lobe was decreased for patients with conduct disorder compared to the other two groups.
Failed Stop Versus Go Response Trials
Group activations are shown in Figure 1 and data supplement Table 1 . All subjects activated areas in the anterior cingulate, ventrolateral prefrontal, and temporal-parietal regions.
Group Effects
Three-group ANCOVA showed significant group effects in the right posterior cingulate gyrus, reaching into the precuneus and into a left hemispheric cluster comprising superior temporal, precentral, and inferior parietal lobes, reaching deep into the insula and into right inferior parietal lobe ( Table 3 , Figure 2 ). Post hoc t tests for this contrast showed that in relation to comparison subjects, patients with ADHD (p<0.001) and with conduct disorder (p<0.04) showed diminished BOLD response in the posterior cingulate gyrus but did not differ from each other. The patients with conduct disorder showed reduced BOLD response for this contrast in the left parietal-temporal cluster in relation to comparison subjects (p<0.03) and compared to ADHD patients (p<0.001), who did not differ from comparison subjects. They also showed reduced BOLD response in the right parietal lobe in relation to comparison subjects (p<0.05) and to patients with ADHD (p<0.001) (see Figure 3 ). Across all subjects, the left and right parietal activation foci that differed between groups were correlated with each other, suggesting that they form a neural network (r=0.6, df=53, p<0.006).
There were no significant correlations between the magnitude of scalar measures of the BOLD response within clusters of brain activation difference and Strengths and Difficulties Questionnaire scores in either of the two patient groups.
Group Effects for Other Contrasts
To investigate whether reduced BOLD response in patients were also observed in the inverse contrast conditions, we tested for ANCOVA group effects for the contrast of go trials – failed stop trials and for the contrast of failed versus successful stop trials. No significant group effects were observed. Three-group ANCOVA group effect for the contrast of successful stop-go trials showed a BOLD response cluster in the left superior temporal lobe (Talairach coordinates: –43, 7, –29; number of voxels: 203), which in post hoc t tests showed to be increased in BOLD response in ADHD patients in relation to both comparison subjects and conduct disorder patients (p<0.005), who did not differ from comparison subjects. For the contrast of go - stop trials, a large cluster emerged comprising the insula, anterior cingulate, caudate, putamen and thalamus, superior temporal, and premotor cortex (Talairach coordinates: 29, 0, 9; number of voxels: 640). Post hoc t tests showed that both patient groups showed reduced BOLD response in this contrast in relation to comparison subjects (p<0.005) but did not differ from each other.
Discussion
Children with noncomorbid forms of conduct disorder and ADHD show both similarities and differences in their brain activation abnormalities in relation to comparison subjects when performing a motor response inhibition task. During successful inhibition, when contrasted with failed inhibition, ADHD patients showed disorder-specific underactivation in relation to both comparison subjects and conduct disorder patients in the left dorsolateral/inferior prefrontal cortex that correlated with the speed of the inhibitory process in the comparison subjects. During failed inhibition, when contrasted with the go response, both patient groups shared reduced activation in relation to comparison subjects in the posterior cingulate gyrus; the conduct disorder group, in addition, showed disorder-specific temporal-parietal activation abnormalities compared to the other two groups.
For successful versus failed inhibition trials, conduct disorder patients showed no brain activation differences in relation to comparison subjects, whereas ADHD patients showed disorder-specific differences in the left dorsolateral prefrontal cortex. The lack of brain activation differences in patients with conduct disorder could be the neural correlate for the behavioral findings that conduct disorder patients are more similar to comparison subjects than ADHD in their inhibitory capacity (14) . In this study, although it did not reach significance, stop signal reaction time was slower in patients with ADHD than in patients with conduct disorder, and this may have reached significance with larger subject numbers.
The dorsolateral and inferior prefrontal cortices are typically underactivated in patients with ADHD during inhibition tasks (2 , 6 , 31) . In a previous study that used the same task and included 10 ADHD patients who were also included in this study but that included other medication-naive ADHD children who scored higher on disruptive disorders than this group and included comorbidity with conduct disorder (7) , we observed a right-hemispheric and more inferior activation focus during successful inhibition (7) . Other studies, however, have also found left dorsolateral prefrontal cortex underactivation in patients with ADHD during the go/no-go and stop tasks (4 , 5 , 8) , and this area is a key frontal abnormality in ADHD patients in a meta-analysis of fMRI studies (32) . The differences in laterality and the exact location of prefrontal abnormalities in ADHD during inhibition tasks may be due to differences in the behavioral characteristics of the group; patients who are carefully selected to have low disruptive behaviors may differ in their brain abnormalities from patients with the more typical disruptive or comorbid presentation of ADHD (1) .
During failed inhibition compared to go trials, conduct disorder patients showed reduced activation in relation to comparison subjects in the posterior cingulate gyrus, precuneus, and bilateral parietal regions that in the left hemisphere reached into the superior temporal cortex, precentral gyrus, and insula. The posterior cingulate underactivation in relation to comparison subjects was shared with ADHD patients, whereas the temporal-parietal abnormalities were disorder-specific. Parietal-temporal and cingulate brain regions are typically activated during inhibition tasks, in particular during inhibition failures (25 , 26 , 33) . The participants obtain implicit feedback about their inhibition failures because the stop signal appears after they make their executive response. The activation in the posterior cingulate, precuneus, and parietal-temporal regions after errors has been suggested to reflect error detection and subsequently enhanced functions of arousal, attention allocation, and performance monitoring that are necessary to avoid future mistakes (7 , 25 , 26) . The role of temporal-parietal brain regions in attention allocation is supported by findings of activation during oddball tasks (34) . The cingulate and temporal-parietal underactivation in patients with conduct disorder may thus suggest a problem with the recruitment of attention allocation networks rather than inhibition networks. The disorder-specificity of temporal-parietal underactivation in patients with conduct disorder could suggest that performance monitoring networks are more dysfunctional in conduct disorder than in ADHD. This could mean that children with conduct disorder care less about their mistakes than both ADHD and comparison subjects, which would be in line with evidence that conduct disorder/oppositional defiance disorder children are undermotivated and respond less to negative feedback than comparison subjects (35 , 36) . The interpretation of the cingular-parietal-temporal underactivations as a reduced recruitment of attention allocation networks are also in line with EEG studies that found abnormal temporal-parietal activation in children with conduct disorder in relation to comparison subjects during sustained (16) and selective attention tasks (17) . The right temporal dysfunction is interesting with respect to the documented relationship between the temporal lobes and aggression (37) and structural findings of smaller temporal volumes in patients with conduct disorder (19) . Temporal lobe activation was furthermore reduced in conduct disorder patients compared to ADHD patients during successful stop compared to go trials. These findings demonstrate for the first time to our knowledge in fMRI that temporal and parietal brain regions are dysfunctional in conduct disorder and, furthermore, that these dysfunctions are specific to children with conduct disorder in the context of inhibitory control.
The finding of posterior cingulate underfunction in ADHD is in line with several previous findings during the same stop task in a more comorbid sample (7) , during rewarded sustained attention (unpublished study by Rubia et al.), and during a motor delay task (2 , 6) . Furthermore, in two of these studies, the cingulate dysfunctions were correlated with ADHD symptom scores ( 7 , unpublished study by Rubia et al.). The posterior cingulate is connected to the limbic system and visuomotor pathways and is relevant for the dynamic allocation of visual-spatial attention, in particular to visually or motivationally salient events (38) , which would be the perception of errors in this study. Dysfunction in this brain region thus seems to be a consistent and yet relatively neglected finding in ADHD that could be the neural substrate for age-inappropriate attention allocation.
The present findings of functional brain abnormalities in ADHD adolescents with low disruptive behaviors in lateral prefrontal and posterior cingulate regions replicate and extend our previous abnormality findings in more typical patients with ADHD during response inhibition. This study is the first to our knowledge, however, to demonstrate that dysfunction in the posterior cingulate is shared with patients with conduct disorder. A dysfunction in cingulate-mediated attention allocation and performance monitoring networks may thus be common to both disorders and could explain shared problems with visual-spatial attention. Both patient groups also shared underactivation during the go compared to the stop contrast in the anterior cingulate, basal ganglia, thalamus, and premotor regions, suggesting shared abnormalities in motor networks in relation to frequent versus no response execution.
A limitation of the study design is that we did not include a rest condition. The contrast of the task conditions with a resting or lower-level baseline condition could have provided additional information that might have further clarified the main group effect findings (39) . ADHD children, however, are known to differ from comparison subjects in their brain activation during rest (40 , 41) , and a resting condition may therefore not be more disambiguating than a go condition.
To our knowledge, this is the first neuroimaging study on carefully selected relatively “pure” patient groups who differed from each other in conduct and ADHD problems; previous studies investigated patient groups with a greater overlap between conduct disorder and ADHD symptoms or comorbidity (16 , 18 , 19) .
In conclusion, this study shows similarities as well as qualitative dissociations of brain abnormalities in patients with ADHD and conduct disorder during inhibitory control. Both groups showed posterior cingulate abnormalities in response to inhibition failures, presumably reflecting a suboptimal performance monitoring network. However, temporal-parietal abnormalities were specific to patients with conduct disorder when compared to those with ADHD, suggesting a qualitative difference. Furthermore, only ADHD patients showed lateral prefrontal abnormalities during inhibition, suggesting that this deficit is specific to ADHD.
This study is a first step toward delineating the underlying neurobiological differences between the two diagnostic disorders in relation to a commonly affected and behaviorally not distinguishable process, i.e., inhibitory control. The nosological implication is to strengthen the independent recognition of both. A thorough delineation of the differences and commonalities of the underlying pathophysiology of these two behaviorally overlapping disorders will provide a more accurate and objective differentiation of the disorders that will ultimately help to develop disorder-specific treatment.
1. Banaschewski T, Brandeis D, Heinrich H, Albrecht B, Brunner E, Rothenberger A: Questioning inhibitory control as the specific deficit of ADHD—evidence from brain electrical activity. J Neural Transm 2004; 111:841–864Google Scholar
2. Rubia K, Taylor E, Smith AB, Oksannen H, Overmeyer S, Newman S: Neuropsychological analyses of impulsiveness in childhood hyperactivity. Br J Psychiatry 2001; 179:138–143Google Scholar
3. Rubia K, Smith A, Taylor E: Performance of children with attention deficit hyperactivity disorder (ADHD) on a test battery of impulsiveness. Child Neuropsychol 2007; 13:276–304Google Scholar
4. Booth JR, Burman DD, Meyer JR, Lei Z, Trommer BL, Davenport ND, Li W, Parrish TB, Gitelman DR, Mesulam MM: Larger deficits in brain networks for response inhibition than for visual selective attention in attention deficit hyperactivity disorder (ADHD). J Child Psychol Psychiatry 2005; 46:94–111Google Scholar
5. Durston S, Mulder M, Casey BJ, Ziermans T, van Engeland H: Activation in ventral prefrontal cortex is sensitive to genetic vulnerability for attention-deficit hyperactivity disorder. Biol Psychiatry 2006; 60:1062–1070Google Scholar
6. Rubia K, Overmeyer S, Taylor E, Brammer M, Williams SC, Simmons A, Bullmore ET: Hypofrontality in attention deficit hyperactivity disorder during higher-order motor control: a study with functional MRI. Am J Psychiatry 1999; 156:891–896Google Scholar
7. Rubia K, Smith AB, Brammer MJ, Toone B, Taylor E: Abnormal brain activation during inhibition and error detection in medication-naïve adolescents with ADHD. Am J Psychiatry 2005; 162:1067–1075Google Scholar
8. Smith AB, Taylor E, Brammer M, Toone B, Rubia K: Task-specific hypoactivation in prefrontal and temporoparietal brain regions during motor inhibition and task switching in medication-naive children and adolescents with attention deficit hyperactivity disorder. Am J Psychiatry 2006; 163:1044–1051Google Scholar
9. Banaschewski T, Hollis C, Oosterlaan J, Roeyers H, Rubia K, Willcutt E, Taylor E: Towards an understanding of unique and shared pathways in the psychopathophysiology of ADHD. Dev Sci 2005; 8:132–140Google Scholar
10. Swanson JM, Sergeant JA, Taylor E, Sonuga-Barke EJS, Jensen PS, Cantwell DP: Attention-deficit hyperactivity disorder and hyperkinetic disorder. Lancet 1998; 351:429–433Google Scholar
11. Taylor E: The Epidemiology of Childhood Hyperactivity. Oxford, UK, Oxford University Press, 1991Google Scholar
12. Blair RJR: Neurocognitive models of aggression, the antisocial personality disorders, and psychopathy. J Neurol Neurosurg Psychiatry 2001; 71:727–731Google Scholar
13. Herba CM, Tranah T, Rubia K, Yule W: Conduct problems in adolescence: three domains of inhibition and effect of gender. Dev Neuropsychol 2006; 30:659–695Google Scholar
14. Oosterlaan J, Logan GD, Sergeant JA: Response inhibition in AD/HD, CD, comorbid AD/HD+CD, anxious, and control children: a meta-analysis of studies with the stop task. J Child Psychol Psychiatry 1998; 39:411–425Google Scholar
15. Kooijmans R, Scheres A, Oosterlaan J: Response inhibition and measures of psychopathology: a dimensional analysis. Child Neuropsychol 2000; 6:175–184Google Scholar
16. Banaschewski T, Brandeis D, Heinrich H, Albrecht B, Brunner E, Rothenberger A: Association of ADHD and conduct disorder—brain electrical evidence for the existence of a distinct subtype. J Child Psychol Psychiatry 2003; 44:356–376Google Scholar
17. Bauer LO, Hesselbrock VM: Subtypes of family history and conduct disorder: effects on P300 during the Stroop test. Neuropsychopharmacology 1999; 21:51–62Google Scholar
18. Sterzer P, Stadler C, Krebs A, Kleinschmidt A, Poustka F: Abnormal neural responses to emotional visual stimuli in adolescents with conduct disorder. Biol Psychiatry 2005; 57:7–15Google Scholar
19. Kruesi MJ, Casanova MF, Mannheim G, Johnson-Bilder A: Reduced temporal lobe volume in early onset conduct disorder. Psychiatry Res 2004; 132:1–11Google Scholar
20. Pliszka SR, Glahn DC, Semrud-Clikeman M, Franklin C, Perez R III, Xiong J, Liotti M: Neuroimaging of inhibitory control areas in children with attention deficit hyperactivity disorder who were treatment naive or in long-term treatment. Am J Psychiatry 2006; 163:1052–1060Google Scholar
21. American Psychiatric Association: Diagnostic and Statistical Manual of Mental Disorders, 4th ed (DSM-IV). Washington, DC, American Psychiatric Association, 1994Google Scholar
22. Goldberg DP, Murrey RM: Maudsley Handbook of Practical Psychiatry, 4th Ed. Oxford, UK, Oxford University Press, 2002Google Scholar
23. Goodman R: The Strengths and Difficulties Questionnaire: a research note. J Child Psychol Psychiatry 1997; 38:581–586Google Scholar
24. Raven J: Guide to the Standard Progressive Matrices. London, HK Lewis, 1960Google Scholar
25. Rubia K, Smith AB, Brammer MJ, Taylor E: Right inferior prefrontal cortex mediates response inhibition while mesial prefrontal cortex is responsible for error detection. Neuroimage 2003; 20:351–358Google Scholar
26. Rubia K, Smith AB, Taylor E, Brammer M: Linear age-correlated functional development of right inferior fronto-striato-cerebellar networks during response inhibition and anterior cingulate during error-related processes. Hum Brain Mapp 2007; 28:1163–1177Google Scholar
27. Benjamini Y, Hochberg Y: Controlling the false discovery rate—a practical and powerful approach to multiple testing. J Royal Stat Soc Series B Methodol 1995; 57:289–300Google Scholar
28. Bullmore E, Long C, Suckling J, Fadili J, Calvert G, Zelaya F, Carpenter TA, Brammer M: Colored noise and computational inference in neurophysiological (fMRI) time series analysis: resampling methods in time and wavelet domains. Hum Brain Mapp 2001; 12:61–78Google Scholar
29. Bullmore ET, Suckling J, Overmeyer S, Rabe-Hesketh S, Taylor E, Brammer MJ: Global, voxel, and cluster tests, by theory and permutation, for a difference between two groups of structural MR images of the brain. IEEE Trans Med Imaging 1999; 18:32–42Google Scholar
30. Talairach J, Tournoux P: Co-Planar Stereotaxic Atlas of the Brain. New York, Thieme, 1988Google Scholar
31. Rubia K, Overmeyer S, Taylor E, Brammer M, Williams SC, Simmons A, Andrew C, Bullmore ET: Functional frontalisation with age: mapping neurodevelopmental trajectories with fMRI. Neurosci Biobehav Rev 2000; 24:13–19Google Scholar
32. Dickstein SG, Bannon K, Castellanos FX, Milham MP: The neural correlates of attention deficit hyperactivity disorder: an ALE meta-analysis. J Child Psychol Psychiatry 2006; 47:1051–1062Google Scholar
33. Rubia K, Smith AB, Woolley J, Nosarti C, Heyman I, Taylor E, Brammer MJ: Progressive increase of fronto-striatal brain activation from childhood to adulthood during event related tasks of cognitive control. Hum Brain Mapp 2006; 27:973–993Google Scholar
34. Rubia K, Smith AB, Brammer M, Taylor E: Temporal lobe dysfunction in medication-naive boys with attention-deficit/hyperactivity disorder during attention allocation and its relationship to response variability. Biol Psychiatry 2007; 13:276–304Google Scholar
35. Matthys W, van Goozen SHM, Snoek H, van Engeland H: Response perseveration and sensitivity to reward and punishment in boys with oppositional defiant disorder. Eur Child Adolesc Psychiatry 2004; 13:362–364Google Scholar
36. van Goozen SHM, Cohen-Kettenis PT, Snoek H, Matthys W, Swaab-Barneveld H, van Engeland H: Executive functioning in children: a comparison of hospitalised ODD and ODD/ADHD children and normal controls. J Child Psychol Psychiatry 2004; 45:284–292Google Scholar
37. Herzberg JL, Fenwick PB: The aetiology of aggression in temporal-lobe epilepsy. Br J Psychiatry 1988; 153:50–55Google Scholar
38. Mesulam MM, Nobre AC, Kim YH, Parrish TB, Gitelman DR: Heterogeneity of cingulate contributions to spatial attention. Neuroimage 2001; 13:1065–1072Google Scholar
39. Leibenluft E, Rich BA, Vinton DT, Nelson EE, Fromm SJ, Berghorst LH, Joshi P, Robb A, Schachar RJ, Dickstein DP, McClure EB, Pine DS: Neural circuitry engaged during unsuccessful motor inhibition in pediatric bipolar disorder. Am J Psychiatry 2007; 164:52–60Google Scholar
40. Cao QJ, Zang YF, Sun L, Sui MQ, Long XY, Zou QH, Wang YF: Abnormal neural activity in children with attention deficit hyperactivity disorder: a resting-state functional magnetic resonance imaging study. Neuroreport 2006; 17:1033–1036Google Scholar
41. Zang YF, He Y, Zhu CZ, Cao QJ, Sui MQ, Liang M, Tian LX, Jiang TZ, Wang YF: Altered baseline brain activity in children with ADHD revealed by resting-state functional MRI. Brain Dev 2007; 29:83–91Google Scholar