Progressive Brain Volume Loss During Adolescence in Childhood-Onset Schizophrenia
Abstract
OBJECTIVE: Previous reports have documented a striking progressive reduction in cortical gray matter volume during adolescence in patients with childhood-onset schizophrenia. This study examined the rate of loss in cortical gray matter volume in relation to age and clinical status in adolescent patients over a follow-up period of 2–6 years. METHOD: A total of 131 brain magnetic resonance imaging scans were acquired for 60 subjects with childhood-onset schizophrenia (mean age=14.5 years, SD=2.5), and 140 scans were acquired for 64 matched healthy comparison subjects. One or more follow-up scans were acquired at approximately 2-year intervals for 39 subjects with childhood-onset schizophrenia and 43 healthy subjects. Developmental trajectories for total and regional brain volumes were examined in relation to age by using polynomial growth models and data from all available scans. The rate of gray matter reduction in patients with childhood-onset schizophrenia was examined in relation to developmental and clinical measures by using stepwise regression. RESULTS: Rates of brain volume reduction were significantly higher for patients with childhood-onset schizophrenia than for healthy comparison subjects. In childhood-onset schizophrenia, the rate of gray matter reduction was related to premorbid impairment and baseline severity of clinical symptoms but not to gender, ethnicity, or age at onset of the disorder. Unexpectedly, greater clinical improvement was significantly related to a higher rate of gray matter reduction. Longitudinal trajectories suggested that the rate of cortical loss plateaus during adolescence. CONCLUSIONS: Striking loss of cerebral gray matter is seen through adolescence in patients with childhood-onset schizophrenia. The rate of reduction was related to premorbid impairment and baseline symptom severity, but it may also be in part a plastic response to illness.
Structural brain abnormalities are well established for schizophrenia (1, 2), with most imaging studies that include gray matter and white matter segmentation reporting smaller cortical gray matter volumes and larger lateral ventricular volumes (1, 3–8). Volumetric abnormalities include deficits ranging from 1.5% (9) to 20% (10) for total gray matter volume and enlargements ranging from 5% (11) to 48% (12) for lateral ventricular volume, relative to healthy subjects, and these abnormalities have been generally associated with poor premorbid functioning and poor outcome (3, 11, 13–15).
Recent prospective brain magnetic resonance imaging (MRI) studies over a 2–4-year follow-up period in patients with adult-onset schizophrenia have found subtle brain changes, including lateral ventricular enlargement and reduction in hemispheric, frontal, and temporal volumes (8, 14, 16–18).
An ongoing prospective series of studies of brain development in healthy children and children with psychoses has permitted a more detailed investigation of brain development in children with psychoses during adolescence. Progressive loss of cortical gray matter and increase in ventricular volumes were observed in small subsets of 15 and 16 adolescent subjects with childhood-onset schizophrenia (19, 20), and these changes were more striking than those seen in the adult studies across a similar time period (effect size for ventricular enlargement was 0.89 for childhood-onset schizophrenia versus 0.18–0.65 in studies of adult-onset schizophrenia [21]). Most recently, a back-to-front “cortical wave” of loss has been described for a subgroup of 12 subjects with childhood-onset schizophrenia, and this effect was not seen in a comparison group of nonschizophrenic patients matched for IQ and drug treatment status (22). Thus, cortical change appears most striking in the parietal region early in the illness course, with later spread to frontal and temporal cortices.
These studies support the concept of schizophrenia as a progressive neurodevelopmental disorder with both early and late developmental abnormalities (23). The identification of these cortical changes in adolescents with childhood-onset schizophrenia, however, raises several questions. First, since age at onset is not associated with degree of gray matter loss in adult patients (3, 12, 24), the relative loss of gray matter in childhood-onset schizophrenia would be expected to plateau, relative to the cortical maturation of healthy comparison subjects. Second, the relative loss of brain tissue in childhood-onset schizophrenia might reflect a process uniquely salient to adolescence, but it could also be due to other factors such as severity of illness, drug treatment, clinical outcome, or some interactions among these factors.
In the present study, anatomic brain MRI images from 60 patients with childhood-onset schizophrenia were evaluated for progressive gray matter loss. For the 39 patients for whom two or more scans were available, the rate of loss was examined in relation to developmental and clinical characteristics. Our hypothesis was that greater loss of gray matter would be associated with poorer clinical outcome.
Method
Subjects
Childhood-onset schizophrenia
The recruitment of probands with childhood-onset schizophrenia has been described in detail elsewhere (25). Briefly, we sought children and adolescents, age 8–18 years, who met the DSM-III-R or DSM-IV criteria for schizophrenia with onset of psychotic symptoms before their 13th birthday, a premorbid full-scale IQ of at least 70, and no significant medical or neurological disease or other psychiatric disorder that was a major focus of treatment. Ongoing national recruiting resulted in more than 1,400 chart reviews and 250 in-person screenings. The diagnosis of childhood-onset schizophrenia was confirmed by an extensive evaluation that included clinical and structured interviews of the children and their parents with portions of the Schedule for Affective Disorders and Schizophrenia for School-Age Children (26, 27) and in-hospital observation during a 1–3-week medication-free period. Severity of clinical symptoms was assessed by using the Brief Psychiatric Rating Scale (BPRS) (28), Scale for the Assessment of Positive Symptoms (SAPS) (29), Scale for the Assessment of Negative Symptoms (SANS) (30), and BPRS for Children (31). Interrater reliabilities (measured with the interclass correlation coefficient [ICC]) for three different groups of child psychiatrists at three different points in the study ranged from moderate (ICC=0.64 for the BPRS for Children) to high (ICC=0.92 for the SANS and SAPS).
Premorbid development (defined as development up to 1 year before onset of psychosis) was evaluated on the basis of clinical, neuropsychological, and school records and parental recall (for a detailed description of this evaluation, see reference 32). The presence or absence of premorbid abnormalities was rated for social interactions, speech and language, and motor behavior. The sum of scores on 15 items within these categories constituted a total score of premorbid developmental dysfunction (adapted from the rating method of Hollis [33]). Interrater reliability between the two raters was high (kappa=0.9). Family interview information was used to identify any symptoms of the schizophrenia spectrum diagnoses, defined as schizophrenia, schizoaffective disorder, or schizotypal, schizoid, or paranoid personality disorder, in the first-degree relatives of probands.
All subjects participated in an inpatient, double-blind, placebo-controlled study of atypical neuroleptics (haloperidol versus olanzapine or clozapine versus olanzapine), and most (91%) returned for follow-up scans approximately every 2 years across a 2–8-year period. At baseline and at each follow-up visit, subjects were administered the WISC-R (34), WISC-III (35), or WAIS-R (36), as appropriate. At follow-up, WISC-R raw scores for information and comprehension subtests were obtained to compare performance on these scales independent of the subjects’ age. Clinical status was rated at follow-up by using the rating scales listed earlier.
Healthy comparison subjects
MRI scans were obtained for 64 age- and sex-matched healthy subjects who were a part of a larger pool of subjects participating in an ongoing study of normal brain development at NIMH (37). Details concerning the recruitment and assessment of the healthy subjects have been presented elsewhere (38). Since 1990, research teams ensured that the matched comparison subjects were rescanned at approximately 2-year intervals to match the intervals for the subjects with childhood-onset schizophrenia. A total of 140 scans was available for the healthy comparison group, of whom 43 had two or more good-quality scans (Table 1).
The project was approved by the NIMH Institutional Review Board. Written consent was obtained from parents, and assent was obtained from minor subjects.
MRI Image Acquisition
All scans were obtained on the same GE 1.5-T Signa scanner (GE Medical Systems, Milwaukee) by using the same three-dimensional spoiled gradient recalled echo in the steady state imaging protocol (axial slice thickness=1.5 mm, time to echo=5 msec, repetition time=24 msec, flip angle=45º, acquisition matrix=192×256, number of excitations=1, and field of view=24 cm). Foam padding was placed around the subject’s head to minimize scanner noise and help steady the head position. Vitamin E capsules, one in each ear and one taped to the left lateral inferior orbital ridge, were used to standardize head placement. Scans were evaluated clinically by a neuroradiologist and had no gross abnormalities. Researchers evaluating the scans for research measures were blinded to the subjects’ diagnoses. Total and regional gray and white matter volumes were generated by a fully automated system that classifies tissue according to voxel intensity using a probabilistic atlas and provides lobar (frontal, parietal, temporal, and occipital) parcellation of cortical gray matter volumes. Total cerebral volume was defined as the algebraic sum of all gray matter pixels and white matter pixels, excluding the cerebellum and brainstem. More detailed descriptions of the procedure have been given elsewhere (37, 39, 40).
Anatomical boundaries for classification of brain voxels were based on a total of 4,000 points selected by a trained neuroanatomist for gray matter, white matter, CSF, fat, and background, by using reference space and the coordinate system from Talairach space (41) (for example, the left lateral ventricle extends from –36 to 0 on the x axis, from –56 to 29 on the y axis and from –14 to 28 on the z axis in Talairach space). Complete information on anatomical boundaries is available on request and on our web site (http://intramural.nimh.nih.gov/chp/).
Occasionally scans were not available due to a variety of reasons (e.g., refusal from the patient, presence of metal objects in the body) or were discarded because of poor quality (i.e., motion artifact) by the automated processing software.
Statistical Analyses
Demographic characteristics were compared for the childhood-onset schizophrenia group and the healthy comparison group and for subgroups with two or more scans by using t, Mann-Whitney, or chi-square tests, as appropriate.
To evaluate age-related volumetric changes, developmental trajectories were generated by using mixed-model regression. All available scans for each subject were used for these analyses. A total of 131 scans were available for the 60 subjects with childhood-onset schizophrenia, and 140 scans were available for the 64 healthy comparison subjects.
Mixed-model regression has several advantages over more common statistical techniques such as polynomial regression or repeated measures analysis of variance. Specifically, it accounts for unbalanced data measured at irregular time intervals and for within-person correlation, such as multiple measures obtained from the same person. We were thus able to include participants with varying numbers of scans (one to five) and increase the statistical power to examine volume and age relationships.
Briefly, for a given structure, the ith individual’s jth measurement was initially modeled by using the following equation:
sizeij=intercept+di+Am(sex=m)+Af(sex=f)+B1(age–mean age) +B2(age–mean age)2+B3(age–mean age)3+eij,
in which di is a normally distributed random effect that models within-person dependence; the intercept, A, and B are modeled as fixed effects; eij represents the usual normally distributed residual error; Am and Af show how the individual’s sex affects the volume measurements; and B1, B2, and B3 show how volume changes with age. The initial models allowed for gender/diagnostic interactions in the shape of the growth curves. However, these models were not significant improvements over the final model that imposed parallel trajectories for male and female subjects. Due to space considerations these analyses were omitted.
In the final models, the intercept and B terms were allowed to vary by diagnostic group, producing two growth curves with different height and shape characteristics. F tests were used to determine whether cubic, quadratic, linear, or constant growth models best fit the data. After the order of the model was determined (linear, cubic, or quadratic), F tests were used to see if the diagnostic curves differed in shape (i.e., if the coefficient for age terms differed between the groups). Parameter estimates of the fixed effects were used to generate fitted values in the graphs. Outliers were checked visually, and collinearity among explanatory variables was not an issue, as age, sex and diagnosis were not significantly correlated. Additional details regarding the mixed-model regression analysis are given elsewhere (37, 42, 43).
Polynomial regression analyses using the first data point for each subject, mixed-model regression analyses using data only from subjects with two scans, and volumetric slope comparisons using data from scans before and after age 20 were also performed, but these analyses were not found to be informative owing to the insufficient number of cases.
The rate of total gray matter volume change was calculated for the subjects with childhood-onset schizophrenia and the healthy comparison subjects who had at least two MRI scans available before age 21 (39 subjects with childhood-onset schizophrenia and 43 healthy comparison subjects). The total gray matter slope was defined as the follow-up scan value minus the first scan value divided by time elapsed between scans and expressed as milliliters per year (a negative value represented cortical volume reduction). This calculated linear slope was used as an approximation of the nonlinear/cubic developmental trajectory. By using the linear approximation we were able to examine the relationships between volumetric change and corresponding clinical measures in a straightforward, easily accessible manner.
For subjects with childhood-onset schizophrenia who had three or more scans (N=21), we used paired t tests to compare the total and regional gray matter slopes between the first and second scans versus the second and last (usually third) scans.
For the subjects with childhood-onset schizophrenia subjects who had two or more scans (N=39), baseline and follow-up clinical and neuropsychological measures were compared by using paired t tests. Finally, for this subgroup, the rate of gray matter reduction was examined as an outcome variable in relation to developmental and clinical measures by using stepwise regression analysis.
All statistics were performed by using SPSS 11.0.1 (44) or NCSS 2001 (45).
Results
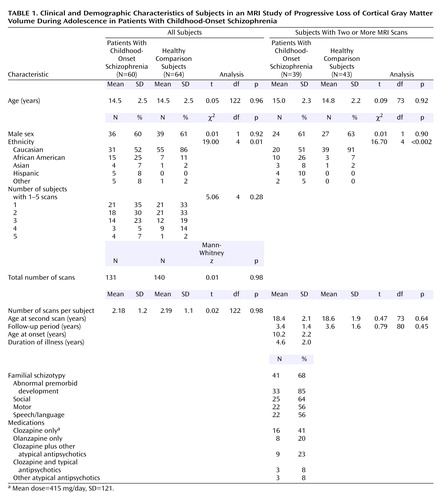
The final study group consisted of 60 subjects with childhood-onset schizophrenia (36 boys, 24 girls) and 64 healthy comparison subjects (39 boys, 25 girls) for whom one or more MRI scans were available (a total of 131 and 140 scans, respectively, for each group). Follow-up scans were available for 39 subjects with childhood-onset schizophrenia (65% of the total childhood-onset schizophrenia group) and 43 comparison subjects (67%). As Table 1 shows, the overall childhood-onset schizophrenia and healthy comparison groups and their subgroups with more than one scan were well matched for gender, age at first and last follow-up scan, number of scans per person, and length of follow-up period. Information on age at onset of illness, duration of illness, abnormal premorbid development, familial schizotypy, and antipsychotic treatment for subjects with childhood-onset schizophrenia who had two or more scans is presented in Table 1. The subjects with childhood-onset schizophrenia who had only one scan were not significantly different from those with two or more scans on any of these measures.
Developmental Trajectories for All Subjects
Age-related changes for total cerebral volume, total and regional gray matter volumes, and ventricular volume were analyzed by using all scans for the subjects with childhood-onset schizophrenia (N=60) and the healthy comparison subjects (N=64).
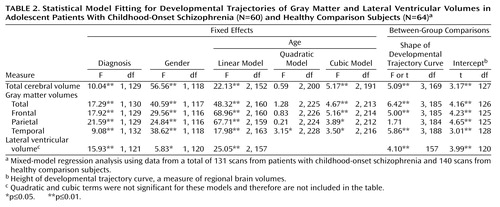
Results of the mixed-model regression analysis included significant cubic terms for total cerebral volume (p≤0.01) and for total (p≤0.01), frontal (p≤0.01), parietal (p≤0.05), and temporal (p≤0.05) gray matter volumes, indicating a nonlinear decline. Developmental trajectories for lateral ventricular volume (Table 2), however, were linear (p≤0.01), indicating a constant rate of increase with no indication of a plateau during this age period. The developmental trajectories for frontal, parietal, temporal, and total gray matter volumes generated from the mixed-model regression analysis for the childhood-onset schizophrenia and healthy comparison groups are presented graphically in Figure 1.
Raw data for total and regional gray matter volumes for subjects with childhood-onset schizophrenia who had three or more scans are presented in Figure 2 to illustrate the nonlinearity of developmental trajectories in childhood-onset schizophrenia. As seen in Figure 2, for most subjects there was a decrease in the rate of gray matter loss (flattening of the curve) with time.
Comparisons of the developmental curves between the groups showed significant differences in shape for total cerebral volume and for total, frontal, and temporal gray matter volumes (p<0.01). For parietal gray matter, the curves for the two groups did not differ in shape (both fitted curves were cubic) but did differ significantly in intercept (height), indicating that the curves for both groups followed statistically comparable courses of nonlinear volumetric reduction. Developmental curves for lateral ventricular volume were linear for both the childhood-onset schizophrenia group and the healthy comparison group. For all the trajectories, the intercepts were significantly different between the groups (Table 2), which reflects smaller total brain volumes and steeper declines in volume in the childhood-onset schizophrenia group (all p values ≤0.01).
In addition, for 21 subjects with childhood-onset schizophrenia who had three MRI scans, we used paired t tests to compare the slopes for gray matter volume (values for the last scan minus the values for the first scan divided by the time elapsed between the scans) from scan 1 to scan 2 with the slopes for gray matter volume from scan 2 to the last scan. The mean ages of the subjects at the three time points were 14.2 years (SD=2.1) at scan 1, 16.5 years (SD=2.2) at scan 2, and 20.4 years (SD=2.1) at the last scan. The difference between the early and later slope was significant for frontal gray matter volume (mean=–6.0 ml/year, SD=5.2, versus mean=–2.5 ml/year, SD=3.2) (t=2.32, df=20, p=0.03) and parietal gray matter volume (mean=–3.3 ml/year, SD=2.8, versus mean=–1.2 ml/year, SD=1.9) (t=2.30, df=20, p=0.03) and approached significance for total gray matter volume (mean=–16.0 ml/year, SD=16.4, versus mean=–5.8 ml/year, SD=10.3) (t=2.07, df=20, p=0.052) and temporal gray matter volume (mean=–2.7 ml/year, SD=4.1, versus mean=–0.5 ml/year, SD=2.2) (t=2.06, df=20, p=0.052).
Developmental Trajectories for Subjects With Two or More Scans
For these analyses we used only scans before age 21 in subgroups of subjects with two or more scans (39 subjects with childhood-onset schizophrenia, 43 healthy comparison subjects), since, as noted earlier, developmental curves diverge from a linear decline around this age.
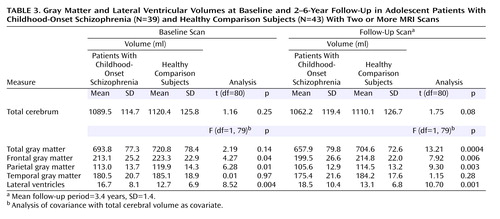
At baseline, the subset of childhood-onset schizophrenia patients with multiple scans had a significantly larger lateral ventricular volume and significantly smaller frontal and parietal gray matter volumes, compared with the healthy subjects (Table 3). At follow-up, total, frontal, and parietal gray matter volumes were significantly smaller for childhood-onset schizophrenia patients, while the difference for temporal gray matter did not reach significance (p=0.28). The percent difference between the follow-up and baseline scans for the subjects with childhood-onset schizophrenia (follow-up volume minus baseline volume divided by baseline volume ×100) was 19.4% for the total gray matter volume and 41.3% for the lateral ventricular volume.
The rate of reduction in total gray matter volume in the childhood-onset schizophrenia group (mean=–10.4 ml/year, SD=12.6) was significantly higher than that in the healthy comparison group (mean=–4.2 ml/year, SD=9.9) (t=2.49, df=80, p=0.01).
Clinical and Neuropsychological Measures
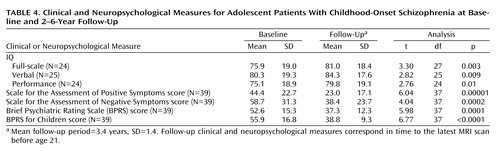
The childhood-onset schizophrenia group showed significant clinical improvement at follow-up, as measured by the SAPS, SANS, BPRS, and BPRS for Children, as well as minor improvement in IQ measures (all p values ≤0.01) (Table 4).
Factors Associated With Gray Matter Reduction
To investigate clinical, demographic, and developmental factors in relation to the rate of reduction of gray matter volume in the childhood-onset schizophrenia group (N=39), two separate stepwise regression analyses were performed: one for demographic and premorbid characteristics and baseline clinical measures and another for treatment and outcome measures. Medication-free baseline severity of clinical symptoms as measured by the BPRS and poor premorbid functioning as measured by the total score for premorbid developmental dysfunction were associated with a faster rate of volume reduction in gray matter (standardized beta coefficient=0.40, R2=0.16, p<0.006; and standardized beta coefficient=0.35, R2=0.12, p<0.02, respectively; Pearson correlations for these measures were r=–0.44, df=37, p<0.005, and r=–0.39, df=37, p=0.01, respectively). No significant relationships were observed between the rate of volume reduction and sex, ethnicity, familial schizotypy, age at onset, duration of illness, baseline full-scale IQ, or any subscale score.
In the second stepwise regression analysis, percent improvement on the BPRS was related to the rate of gray matter volume reduction, i.e., greater improvement was associated with greater gray matter reduction (standardized beta coefficient=0.51, R2=0.27, p<0.001; Pearson r=–0.51, df=37, p=0.001). No treatment measure, such as medication type, dose, or follow-up clinical rating, was significantly associated with the rate of reduction of gray matter volume. There was no significant difference in rate of gray matter reduction between medication groups (F=1.99, df=3, 35, p=0.13) and no significant association between gray matter slopes and medication dose expressed in chlorpromazine equivalents (r=0.25, df=37, p=0.54). Change in full-scale IQ also was not significantly associated with rate of gray matter reduction in childhood-onset schizophrenia subjects (r=–0.37, df=22, p=0.08). Correlations between the slope for reduction of total gray matter volume and baseline clinical ratings on the SAPS, SANS, and BPRS for Children (r=–0.07, df=37, p=0.68; r=–0.35, df=37, p=0.03; r=0.33, df=37, p=0.04, respectively) were not significant after Bonferroni correction. None of the follow-up clinical ratings correlated significantly with the rate of gray matter volume reduction (p=0.17–0.89). However, greater rate of total gray matter reduction was positively associated with higher percentages of improvement in scores on the SANS, BPRS, and BPRS for Children (r=–0.42, df=37, p=0.007; r=–0.51, df=37, p=0.001; r=–0.40, df=37, p=0.01, respectively); these correlations were significant after Bonferroni correction, indicating that greater clinical improvement was accompanied by a higher rate of change in brain volume.
Discussion
This study, which included a larger number of subjects than our previous studies (20, 22), supports our previous findings of progressive gray matter reduction during adolescence in subjects with childhood-onset schizophrenia, compared to healthy comparison subjects. Developmental trajectories for total and regional brain volumes showed relative decreases in subjects with childhood-onset schizophrenia late in adolescence. This finding was partly confirmed by the fact that the slopes for gray matter volume for subjects with childhood-onset schizophrenia who had three or more MRI scans were steeper for earlier than for later scans. However, this observation of a leveling off of gray matter reduction is still preliminary and requires further validation with larger numbers of subjects and a longer follow-up period. These findings may not apply to all patients with early-onset schizophrenia. For example, a recent study (46) did not find progressive brain abnormalities in a group of 16 patients with adolescent-onset schizophrenia, perhaps because the subjects were older (mean age=16.7 years), had a later age at illness onset, and had a shorter follow-up period. If further investigation supports our findings of a leveling off of gray matter reduction in childhood-onset schizophrenia, this confirmation may reconcile our findings with previous findings of relatively small change in prospective brain MRI studies of adult patients with schizophrenia.
The percent difference in total gray matter volume (19.4%) and lateral ventricular volume (41.3%) between the subjects with childhood-onset schizophrenia and the healthy comparison subjects at follow-up in our study is comparable to that reported for adult-onset schizophrenia, particularly in adult-onset schizophrenia patients with poor outcomes, high rates of premorbid deficits, and chronic hospitalization. We did not replicate volumetric differences for the temporal lobe that have been reported in some adult studies (2). The lack of temporal lobe differences in our study may reflect the small number of subjects or may be a characteristic of early-onset psychosis.
While comparisons across studies are problematic, the dramatic rate of brain volume reduction during adolescence in childhood-onset schizophrenia is indicated by the significantly greater effect size in this study, compared to those seen in prospective adult studies (21). We are unable to distinguish whether this difference is due to time-specific developmental changes or symptom severity and/or to the early age at onset of the study subjects.
The inverse association between clinical improvement and brain volume loss, while counterintuitive, has been reported in two other longitudinal studies (8, 14). Although measures of improvement can be confounded with baseline symptom severity, the strong correlation of brain volume loss with percent improvement in symptom measures argues against this interpretation. Moreover, when baseline, follow-up, and improvement measures were entered into a single regression analysis, only clinical improvement measures were significantly associated with rate of gray matter loss.
Drug treatment status was also considered in relation to brain volumetric changes, as some studies have found longer treatment duration and higher antipsychotic doses to be associated with gray matter deficits (4, 18, 47). Other investigators have found no significant association between clozapine treatment and prospective brain change (48; D. Mathalon, personal communication, 2002). Similarly, paradoxical findings have been described in adult patients treated with clozapine, with better treatment responses associated with smaller prefrontal (49) and temporal (50) gray matter volumes. In the present study, however, we did not detect a significant association between the rate of gray matter reduction and medication type or dose.
Speculatively, an association of greater clinical improvement with a faster rate of gray matter decline, if replicated, might be viewed as, in part, a compensatory “pruning” of malfunctioning neural circuits, which is consistent with some neurodevelopmental models of schizophrenia (51).
In this study we also reported a cubic shape of the developmental curve for parietal gray matter volume in normal comparison subjects, which had not been reported previously (38), as we extended the age of the comparison group beyond 18 years. Thus, the results provide more support for the idea that the pattern of gray matter volume reduction in childhood-onset schizophrenia (“back to front cortical wave” [22]) resembles normal brain development during adolescence, but at an exaggerated rate.
Limitations of this study include the relatively small number of subjects, the lack of ethnic or IQ matching for the patient group, and a possible confounding effect of treatment. It must also be noted that the number of subjects who were able to complete an IQ test was smaller than the number of subjects in the study, and the seeming improvement of IQ over time in childhood-onset schizophrenia may not reflect the actual process, as the subjects with the lowest level of functioning were untestable and thus were not represented in this analysis.
Finally, the subjects with childhood-onset schizophrenia in this study may not be representative of the populations of patients with early-onset schizophrenia, as the study subjects had severe, treatment-resistant illnesses. To confirm the apparent plateau for brain changes, studies with a longer follow-up period and additional subjects reaching age 21 years will be required; prospective MRI studies with those characteristics are under way.
 |
 |
 |
 |
Received June 11, 2002; revisions received Jan. 22 and May 27, 2003; accepted May 29, 2003. From the Child Psychiatry Branch, NIMH; and the Biostatistics Branch, National Institute of Neurological Disorders and Stroke, Bethesda, Md. Address reprint requests to Dr. Sporn, Child Psychiatry Branch, NIMH, Bldg. 10, Rm. 3N202, Bethesda, MD 20892; [email protected] (e-mail).

Figure 1. Developmental Pattern of Total and Regional Gray Matter Volumes in Adolescent Patients With Childhood-Onset Schizophrenia and Healthy Comparison Subjectsa
aThe two curves, based on a total of 131 scans for the patients and 140 scans for the healthy comparison subjects, represent estimated age-related slopes for average individuals after accounting for between-person variation by random effect in the mixed regression model. Both longitudinal and cross-sectional data were used. Nonlinear curves for total, parietal, temporal, and frontal gray matter indicate that the rate of volumetric loss approaches zero at approximately age 21.
bSignificant difference in developmental growth trajectory between patients with childhood-onset schizophrenia and healthy comparison subjects (p<0.01, F test).

Figure 2. Raw Total and Regional Gray Matter Volumes in Adolescent Patients With Childhood-Onset Schizophrenia Who Had Three or More MRI Scans Over a 2–6-Year Follow-Up Perioda
aSlopes were based on a total of 75 scans for 21 patients, 57% of whom were male.
bEarly slopes were significantly steeper than later slopes (p=0.03, paired t test).
1. Wright IC, Rabe-Hesketh S, Woodruff PWR, David AS, Murray RM, Bullmore ET: Meta-analysis of regional brain volumes in schizophrenia. Am J Psychiatry 2000; 157:16–25Link, Google Scholar
2. Shenton ME, Dickey CC, Frumin M, McCarley RW: A review of MRI findings in schizophrenia. Schizophr Res 2001; 49:1–52Crossref, Medline, Google Scholar
3. Zipursky RB, Lambe EK, Kapur S, Mikulis DJ: Cerebral gray matter volume deficits in first episode psychosis. Arch Gen Psychiatry 1998; 55:540–546Crossref, Medline, Google Scholar
4. Sullivan EV, Lim KO, Mathalon D, Marsh L, Beal DM, Harris D, Hoff AL, Faustman WO, Pfefferbaum A: A profile of cortical gray matter volume deficits characteristic of schizophrenia. Cereb Cortex 1998; 8:117–124Crossref, Medline, Google Scholar
5. Cannon TD, van Erp TG, Huttunen M, Lonnqvist J, Salonen O, Valanne L, Poutanen VP, Standertskjold-Nordenstam CG, Gur RE, Yan M: Regional gray matter, white matter, and cerebrospinal fluid distributions in schizophrenic patients, their siblings, and controls. Arch Gen Psychiatry 1998; 55:1084–1091Crossref, Medline, Google Scholar
6. Staal WG, Hulshoff Pol HE, Schnack HG, van Haren NEM, Seifert N, Kahn RS: Structural brain abnormalities in chronic schizophrenia at the extremes of the outcome spectrum. Am J Psychiatry 2001; 158:1140–1142Link, Google Scholar
7. Sharma T, Lancaster E, Lee D, Lewis S, Sigmundsson T, Takei N, Gurling H, Barta P, Pearlson G, Murray R: Brain changes in schizophrenia: volumetric MRI study of families multiply affected with schizophrenia—the Maudsley Family Study 5. Br J Psychiatry 1998; 173:132–138Crossref, Medline, Google Scholar
8. Gur RE, Cowell P, Turetsky BI, Gallacher F, Cannon T, Bilker W, Gur RC: A follow-up magnetic resonance imaging study of schizophrenia: relationship of neuroanatomical changes to clinical and neurobehavioral measures. Arch Gen Psychiatry 1998; 55:145–152Crossref, Medline, Google Scholar
9. Meisenzahl EM, Frodl T, Greiner J, Leinsinger G, Maag KP, Heiss D, Hahn K, Hegerl U, Moller HJ: Corpus callosum size in schizophrenia—a magnetic resonance imaging analysis. Eur Arch Psychiatry Clin Neurosci 1999; 249:305–312Crossref, Medline, Google Scholar
10. Lim KO, Rosenbloom MJ, Faustman WO, Sullivan EV, Pfefferbaum A: Cortical gray matter deficit in patients with bipolar disorder. Schizophr Res 1999; 40:219–227Crossref, Medline, Google Scholar
11. Fannon D, Tennakoon L, Sumich A, O’Ceallaigh S, Doku V, Chitnis X, Lowe J, Soni W, Sharma T: Third ventricle enlargement and developmental delay in first-episode psychosis: preliminary findings. Br J Psychiatry 2000; 177:354–359Crossref, Medline, Google Scholar
12. Lim KO, Harris D, Beal M, Hoff AL, Minn K, Csernansky JG, Faustman WO, Marsh L, Sullivan EV, Pfefferbaum A: Gray matter deficits in young onset schizophrenia are independent of age of onset. Biol Psychiatry 1996; 40:4–13Crossref, Medline, Google Scholar
13. Flaum M, O’Leary DS, Swayze VW II, Miller DD, Arndt S, Andreasen NC: Symptom dimensions and brain morphology in schizophrenia and related psychotic disorders. J Psychiatr Res 1995; 29:261–276Crossref, Medline, Google Scholar
14. DeLisi LE, Sakuma M, Ge S, Kushner M: Association of brain structural change with the heterogeneous course of schizophrenia from early childhood through five years subsequent to a first hospitalization. Psychiatry Res 1998; 84:75–88Crossref, Medline, Google Scholar
15. McNeil TF, Cantor-Graae E, Weinberger DR: Relationship of obstetric complications and differences in size of brain structures in monozygotic twin pairs discordant for schizophrenia. Am J Psychiatry 2000; 157:203–212Link, Google Scholar
16. Mathalon DH, Sullivan EV, Lim KO, Pfefferbaum A: Progressive brain volume changes and the clinical course of schizophrenia in men: a longitudinal magnetic resonance imaging study. Arch Gen Psychiatry 2001; 58:148–157Crossref, Medline, Google Scholar
17. Lieberman J, Chakos M, Wu H, Alvir J, Hoffman E, Robinson D, Bilder R: Longitudinal study of brain morphology in first episode schizophrenia. Biol Psychiatry 2001; 49:487–499Crossref, Medline, Google Scholar
18. Cahn W, Pol HE, Lems EB, Van Haren NE, Schnack HG, Van Der Linden JA, Schothorst PF, Van Engeland H, Kahn RS: Brain volume changes in first-episode schizophrenia: a 1-year follow-up study. Arch Gen Psychiatry 2002; 59:1002–1010Crossref, Medline, Google Scholar
19. Rapoport JL, Giedd J, Kumra S, Jacobsen L, Smith A, Lee P, Nelson J, Hamburger S: Childhood-onset schizophrenia: progressive ventricular change during adolescence. Arch Gen Psychiatry 1997; 54:897–903Crossref, Medline, Google Scholar
20. Rapoport JL, Giedd JN, Blumenthal J, Hamburger S, Jeffries N, Fernandez T, Nicolson R, Bedwell J, Lenane M, Zijdenbos A, Paus T, Evans A: Progressive cortical change during adolescence in childhood-onset schizophrenia: a longitudinal magnetic resonance imaging study. Arch Gen Psychiatry 1999; 56:649–654Crossref, Medline, Google Scholar
21. Gogate N, Giedd J, Janson C, Rapoport JL: Brain imaging in normal and abnormal brain development: new perspectives for child psychiatry. Clin Neurosci Res 2001; 1:1283–1290Crossref, Google Scholar
22. Thompson PM, Vidal C, Giedd JN, Gochman P, Blumenthal J, Nicolson R, Toga AW, Rapoport JL: Mapping adolescent brain change reveals dynamic wave of accelerated gray matter loss in very early-onset schizophrenia. Proc Natl Acad Sci USA 2001; 98:11650–11655Crossref, Medline, Google Scholar
23. Woods BT: Is schizophrenia a progressive neurodevelopmental disorder? toward a unitary pathogenetic mechanism. Am J Psychiatry 1998; 155:1661–1670Link, Google Scholar
24. Marsh L, Harris D, Lim KO, Beal M, Hoff AL, Minn K, Csernansky JG, DeMent S, Faustman WO, Sullivan EV, Pfefferbaum A: Structural magnetic resonance imaging abnormalities in men with severe chronic schizophrenia and an early age at clinical onset. Arch Gen Psychiatry 1997; 54:1104–1112Crossref, Medline, Google Scholar
25. Kumra S, Wiggs E, Bedwell J, Smith AK, Arling E, Albus K, Hamburger SD, McKenna K, Jacobsen LK, Rapoport JL, Asarnow RF: Neuropsychological deficits in pediatric patients with childhood-onset schizophrenia and psychotic disorder not otherwise specified. Schizophr Res 2000; 42:135–144Crossref, Medline, Google Scholar
26. Kaufman J, Birmaher B, Brent D, Rao U, Flynn C, Moreci P, Williamson D, Ryan N: Schedule for Affective Disorders and Schizophrenia for School-Age Children—Present and Lifetime Version (K-SADS-PL): initial reliability and validity data. J Am Acad Child Adolesc Psychiatry 1997; 36:980–988Crossref, Medline, Google Scholar
27. Ambrosini PJ: Historical development and present status of the Schedule for Affective Disorders and Schizophrenia for School-Age Children (K-SADS). J Am Acad Child Adolesc Psychiatry 2000; 39:49–58Crossref, Medline, Google Scholar
28. Guy W (ed): ECDEU Assessment Manual for Psychopharmacology: Publication ADM 76–338. Washington, DC, US Department of Health, Education, and Welfare, 1976, pp 158–169Google Scholar
29. Andreasen NC: Scale for the Assessment of Positive Symptoms (SAPS). Iowa City, University of Iowa, 1984Google Scholar
30. Andreasen NC: Scale for the Assessment of Negative Symptoms (SANS). Iowa City, University of Iowa, 1983Google Scholar
31. Overall JE, Gorham DR: The Brief Psychiatric Rating Scale. Psychol Rep 1962; 10:799–812Crossref, Google Scholar
32. Nicolson R, Lenane M, Singaracharlu S, Malaspina D, Giedd JN, Hamburger SD, Gochman P, Bedwell J, Thaker GK, Fernandez T, Wudarsky M, Hommer DW, Rapoport JL: Premorbid speech and language impairments in childhood-onset schizophrenia: association with risk factors. Am J Psychiatry 2000; 157:794–800Link, Google Scholar
33. Hollis C: Child and adolescent (juvenile onset) schizophrenia: a case control study of premorbid developmental impairments. Br J Psychiatry 1995; 166:489–495Crossref, Medline, Google Scholar
34. Wechsler D: Manual for the Wechsler Intelligence Scale for Children—Revised. New York, Psychological Corp, 1974Google Scholar
35. Wechsler D: Wechsler Intelligence Scale for Children—Third Edition Manual. New York, Psychological Corp, 1991Google Scholar
36. Wechsler D: Wechsler Adult Intelligence Scale—Revised. New York, Psychological Corp, 1981Google Scholar
37. Giedd JN, Blumenthal J, Jeffries NO, Castellanos FX, Liu H, Zijdenbos A, Paus T, Evans AC, Rapoport JL: Brain development during childhood and adolescence: a longitudinal MRI study. Nat Neurosci 1999; 2:861–863Crossref, Medline, Google Scholar
38. Giedd JN, Snell JW, Lange N, Rajapakse JC, Casey BJ, Kozuch PL, Vaituzis AC, Vauss YC, Hamburger SD, Kaysen D, Rapoport JL: Quantitative magnetic resonance imaging of human brain development: ages 4–18. Cereb Cortex 1996; 6:551–560Crossref, Medline, Google Scholar
39. Collins DL, Zijdenbos AP, Kollokian V, Sled JG, Kabani NJ, Holmes CJ, Evans AC: Design and construction of a realistic digital brain phantom. IEEE Trans Med Imaging 1998; 17:463–468Crossref, Medline, Google Scholar
40. Zijdenbos AP, Dawant BM, Margolin RA: Automatic detection of intracranial contours in MR images. Comput Med Imaging Graph 1994; 18:11–23Crossref, Medline, Google Scholar
41. Talairach J, Tournoux P: Co-Planar Stereotaxic Atlas of the Human Brain: Three-Dimensional Proportional System. New York, Thieme Medical, 1988Google Scholar
42. Diggle PJ, Liang KY, Zeger SL: Analysis of Longitudinal Data. Oxford, UK, Oxford University Press, 1994Google Scholar
43. Verbeke G, Lesaffre E, Brant LJ: The detection of residual serial correlation in linear mixed models. Stat Med 1998; 17:1391–1402Crossref, Medline, Google Scholar
44. SPSS 11.0 for Windows Brief Guide. Englewood Cliffs, NJ, Prentice-Hall, 2001Google Scholar
45. Hintze J: Number Cruncher Statistical Software 2001. Kaysville, Utah, NCSS, 2001 (http://www.ncss.com/information.html)Google Scholar
46. James AC, Javaloyes A, James S, Smith DM: Evidence for non-progressive changes in adolescent-onset schizophrenia: follow-up magnetic resonance imaging study. Br J Psychiatry 2002; 180:339–344Crossref, Medline, Google Scholar
47. Wyatt RJ: Neuroleptics and the natural course of schizophrenia. Schizophr Bull 1991; 17:325–351Crossref, Medline, Google Scholar
48. Fannon D, Chitnis X, Doku V, Tennakoon L, Ó’Ceallaigh S, Soni W, Sumich A, Lowe J, Santamaria M, Sharma T: Features of structural brain abnormality detected in first-episode psychosis. Am J Psychiatry 2000; 157:1829–1834Link, Google Scholar
49. Friedman L, Knutson L, Shurell M, Meltzer HY: Prefrontal sulcal prominence is inversely related to response to clozapine in schizophrenia. Biol Psychiatry 1991; 29:865–877Crossref, Medline, Google Scholar
50. Lauriello J, Mathalon DH, Rosenbloom M, Sullivan EV, Faustman WO, Ringo DL, Lim KO, Pfefferbaum A: Association between regional brain volumes and clozapine response in schizophrenia. Biol Psychiatry 1998; 43:879–886Crossref, Medline, Google Scholar
51. Feinberg I: Neurodevelopmental model of schizophrenia. Biol Psychiatry 1992; 32:212–213Crossref, Medline, Google Scholar