Determination of Genotype Combinations That Can Predict the Outcome of the Treatment of Alcohol Dependence Using the 5-HT3 Antagonist Ondansetron
Abstract
Objective
The authors previously reported that the 5′-HTTLPR-LL and rs1042173-TT (SLC6A4-LL/TT) genotypes in the serotonin transporter gene predicted a significant reduction in the severity of alcohol consumption among alcoholics receiving the 5-HT3 antagonist ondansetron. In this study, they explored additional markers of ondansetron treatment response in alcoholics by examining polymorphisms in the HTR3A and HTR3B genes, which regulate directly the function and binding of 5-HT3 receptors to ondansetron.
Method
The authors genotyped one rare and 18 common single-nucleotide polymorphisms in HTR3A and HTR3B in the same sample that they genotyped for SLC6A4-LL/TT in the previous randomized, double-blind, 11-week clinical trial. Participants were 283 European Americans who received oral ondansetron (4 µg/kg of body weight twice daily) or placebo along with weekly cognitive-behavioral therapy. Associations of individual and combined genotypes with treatment response on drinking outcomes were analyzed.
Results
Individuals carrying one or more of genotypes rs1150226-AG and rs1176713-GG in HTR3A and rs17614942-AC in HTR3B showed a significant overall mean difference between ondansetron and placebo in drinks per drinking day (−2.50; effect size=0.867), percentage of heavy drinking days (−20.58%; effect size=0.780), and percentage of days abstinent (18.18%; effect size=0.683). Combining these HTR3A/HTR3B and SLC6A4-LL/TT genotypes increased the target cohort from approaching 20% (identified in the previous study) to 34%.
Conclusions
The authors present initial evidence suggesting that a combined five-marker genotype panel can be used to predict the outcome of treatment of alcohol dependence with ondansetron. Additional, larger pharmacogenetic studies would help to validate these results.
Alcoholism is a heterogeneous, complex disorder with multiple subtypes or endophenotypes (1). Perhaps because of this heterogeneity, the therapeutic effect sizes of the approved medications for the treatment of alcohol dependence have been relatively small (2). A personalized approach based on the patient’s genetic makeup is increasingly being investigated for delivering optimum treatment to suitable patients. Previously, in a randomized double-blind clinical trial of alcohol-dependent individuals of European descent, we showed that treatment of severe drinking with ondansetron, a specific serotonin-3 (5-HT3) antagonist, was significantly more efficacious in a subpopulation carrying the serotonin-transporter-linked polymorphic region LL (5′-HTTLPR-LL) and rs1042173-TT (SLC6A4-LL/TT) genotype combination in the serotonin transporter (5-HTT) gene, SLC6A4 (3). Briefly, in that study, we found that SLC6A4-LL/TT carriers treated with ondansetron had 2.63 fewer standard drinks per drinking day and a percentage of days abstinent 16.99% higher than noncarriers of the SLC6A4-LL/TT genotypes. In contrast, when patients were not subgrouped according to their 5′-HTTLPR and rs1042173 genotypes, there was no statistically significant difference between the ondansetron and placebo groups.
Although the SLC6A4-LL/TT genotypes predicted ondansetron treatment response, ondansetron cannot bind directly to 5-HTT molecules because it is an antagonist at the 5-HT3A receptor subunit (4–7). Determination of the 5-HTT genotypes that we selected as being predictive of ondansetron treatment response in our previous study (3) was therefore indirect and based on previous in vitro and in vivo experimental evidence indicating that SLC6A4-LL/TT is associated with markedly reduced 5-HTT expression levels in alcohol-dependent individuals (8–11). The postsynaptic 5-HT3 receptors are formed by 5-HT3A homopentamers or 5-HT3A and 5-HT3B heteropentamer (5-HT3AB) complexes that evince even faster ion transport and conduction. The 5-HT3B subunits do not bind with serotonin or ondansetron but are important for stabilizing the receptor complex at the cell surface (12, 13). The 5-HT3 A and B subunits are encoded by the HTR3A and HTR3B genes located adjacently on chromosome 11, separated only by an intergenic region of 28 kb. Hodge et al. (14), using a transgenic mouse model lacking the gene for the 5-HT3A subunit, showed that the reduction of alcohol consumption produced by 5-HT3 antagonism is dependent on the presence of 5-HT3A-containing receptors. Recently, a genetic association study conducted by Enoch et al. (15) that examined African American men with a lifetime diagnosis of alcohol, cocaine, or heroin dependence showed an association between these disorders and the particular genotypes of HTR3A, HTR3B, and the 5′-HTTLPR. These findings were supported by earlier work from the same group that showed an association between certain HTR3B genotypes and alcohol dependence with antisocial behaviors (16).
Taken together, these risk association studies implicate a collective effect of 5-HT3 and 5′-HTTLPR genotypes on susceptibility for alcoholism. In the present study, we extended our previously tested hypothesis to include functional variants in the SLC6A4, HTR3A, and HTR3B genes that would interact with each other to mediate ondansetron treatment response. This new extended hypothesis was tested in the same sample that we examined in our previously published phase 2 pharmacogenetic trial with 283 alcoholics of European descent (3). If such predictors were found in the HTR3A and HTR3B genes, they would help identify a larger population of alcoholics who would respond to ondansetron.
Method
Participants
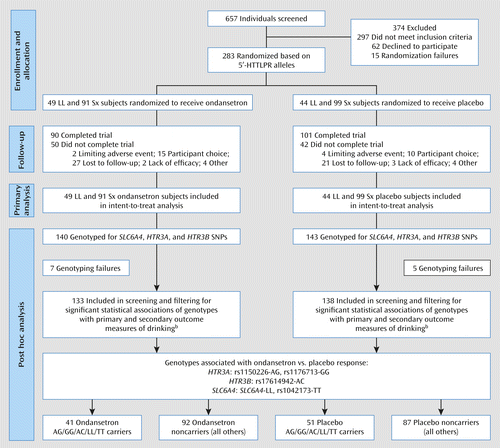
The study population analyzed here is identical to the sample used in our previous study testing the genetic effects of the SLC6A4 5′-HTTLPR-LL and rs1042173-TT genotypes on ondansetron’s efficacy (3). Briefly, all 283 participants were alcohol-dependent individuals with no comorbid axis I diagnoses who scored >8 on the Alcohol Use Disorders Identification Test (17) and were enrolled in an 11-week randomized double-blind clinical trial in which they received either oral ondansetron (4 µg/kg of body weight twice daily) or placebo along with weekly cognitive-behavioral therapy (18).
Study Design
We performed an a priori stratification based on participants’ 5′-HTTLPR genotype, with additional genotyping of the single-nucleotide polymorphism (SNP) rs1042173 in the 3′-untranslated region (3′-UTR) of SLC6A4. Candidate genotyping for polymorphisms in HTR3A and HTR3B were performed retrospectively and were not used as stratification factors (see Figures 1 and 2). We assessed the effect of genotype on three different measures of alcohol consumption: drinks per drinking day, percentage of heavy drinking days, and percentage of days abstinent. Information on daily alcohol consumption was collected for the 90 days prior to enrollment and during the study period using the timeline follow-back method (19). We employed a mixed-effects statistical model to examine genetic associations with drinking patterns throughout the 3-month treatment period, rather than at a single time point.
a SNP=single-nucleotide polymorphism. The primary outcome measure was drinks per drinking day; the secondary outcome measures were percentage of heavy drinking days and percentage of days abstinent.
a 5′-HTTLPR=serotonin-transporter-linked polymorphic region; SNP=single-nucleotide polymorphism.
b The primary outcome measure was drinks per drinking day; the secondary outcome measures were percentage of heavy drinking days and percentage of days abstinent.
Genotyping
Genomic DNA was extracted from the blood of each subject at baseline with a Gentra Puregene kit (QIAGEN, Inc., Valencia, Calif.). For SLC6A4 polymorphisms, genotyping data for 5′-HTTLPR L/S and rs1042173 polymorphisms were obtained from our previous pharmacogenetic trial (3, 20). For HTR3A and HTR3B polymorphisms, we genotyped 10 SNPs in HTR3A and nine SNPs in HTR3B using a commercially available TaqMan premade genotyping assay (Applied Biosystems, Foster City, Calif.) on an ABI 7900 platform. Average densities of their distribution on the two genes were about one SNP every 2 kb in HTR3A and every 5 kb in HTR3B. Candidate SNPs were selected based on their location on the gene, having a minor allele frequency >5%, and previously reported findings by other researchers.
Because we did not detect a significant association of ondansetron treatment response with rs25531 genotypes alone or in combination with 5′-HTTLPR genotypes in our previous study, we did not examine 5′-HTTLPR triallelic effects in the present study.
Genotyping procedures for ancestral informative marker SNPs to assess population stratification using a 24-ancestral marker panel have been described previously (3, 20). Biological and primer/probe sequence information for all of the above-mentioned SLC6A4, HTR3A, and HTR3B polymorphisms is presented in Table S1 in the data supplement that accompanies the online edition of this article.
Statistical Analysis
Departure from Hardy-Weinberg equilibrium was assessed using Haploview, version 4.0 (21). The quality of the clinical data was assessed as described previously (3). Our primary outcome variable was drinks per drinking day. Percentage of heavy drinking days and percentage of days abstinent were secondary outcome measures. A heavy drinking day is defined as consuming ≥5 drinks for men or ≥4 drinks for women.
To study the effect of treatment and genotypes on our outcome variables, we used mixed-effects linear regression models, which can accommodate data missing at random. The models included random intercept and slope (for temporal trend) and were adjusted for participants’ average drinking levels prior to the study, age, gender, and proportions of genetic ancestry as covariates. Proportions of genetic ancestry were calculated using the Structure program (http://pritch.bsd.uchicago.edu/software/structure2_2.html) as described previously (3).
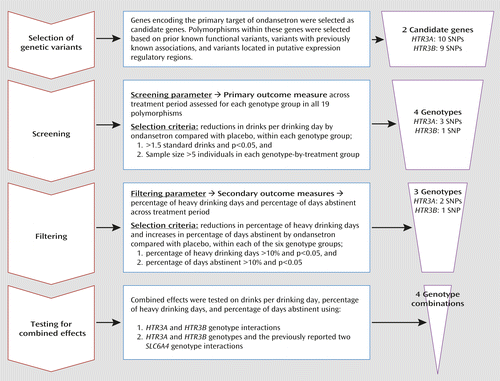
To minimize type I error, we used two filtering steps. First, we examined the drinking data for all 19 HTR3A and HTR3B SNPs (see Table S1 in the online data supplement) and restricted further analysis to those for which there was a difference of more than 1.5 drinks per drinking day between the ondansetron and placebo groups and a p level <0.05 (Figure 1). The cutoff of 1.5 drinks per drinking day was chosen because in our primary analysis, we detected a reduction of about 1.5 standard drinks per drinking day in ondansetron-treated alcoholics who possessed the 5′-HTTLPR-LL genotype, which was the randomization factor (3). Thus, we set this cutoff with the empirical goal of discovering other genetic markers that would be at least as predictive of a response to ondansetron treatment. For all 19 HTR3A and HTR3B SNPs, we tested statistical models that included two-way interaction terms between genotypes of a given SNP. Genotype associations with drinking outcome measures for each SNP were tested using dominant (homozygous major allele genotype plus heterozygous genotype versus homozygous minor allele genotype), recessive (homozygous minor allele genotype plus heterozygous genotype versus homozygous major allele genotype), or heterozygous (heterozygous genotype versus homozygous major allele genotype plus homozygous minor allele genotype) genetic models. The differences in means between genotype-by-treatment combinations for all genotypes are presented in Table S2 in the online data supplement. Second, in addition to the above-mentioned screening process, to further minimize type I error due to multiple testing, we calculated false discovery rate q values (22) for all genotype-by-treatment association analyses that survived the screening process, as shown in Table S2.
Subsequent to the screening process, the selected SNPs were subjected to a filtering process based on their associations with the two secondary outcome measures, percentage of heavy drinking days and percentage of days abstinent. Figure 1 summarizes the SNP selection process used in the study. Only the SNPs that survived filtering were analyzed for their interactive effects on the outcome measures. All interactions were tested at two levels: 1) the effect of treatment on each of the three outcome measures in those who possessed one, two, or all of the HTR3A and HTR3B genotypes, regardless of their previously identified 5′-HTTLPR and rs1042173 genotypes, and 2) the combined effect of the HTR3A and HTR3B genotypes together with the previously identified SLC6A4-LL/TT genotypes. The sample sizes included in the combined genotypes-by-treatment groups are listed in Figure 2. Statistical power analyses (23) were performed as described previously (3).
Validation of detected genotype combinations using the generalized multifactor dimensionality reduction (GMDR) method.
As described above and illustrated in Figure 1, our statistical approach in identifying interactive effects of different genotype combinations was based on pooling individually significant variants and analyzing their combined effects on the drinking measures. This approach, however, could potentially fail to identify individual variants that have significant epistatic effects but have no significant main genetic effects on the phenotypes of interest. To address this concern and validate our results from the primary statistical analysis, we performed an independent SNP-by-SNP interaction analysis using the GMDR method (24), one of the commonly used approaches for detecting genetic epistatic effects (25, 26). The GMDR method allowed us to test for the best interaction models consisting of two to five variants by performing an exhaustive search using all 21 variants genotyped in this study. As the response variable for GMDR analyses, we used predicted values for the three different drinking outcome measures during the entire treatment period. These predictive values were generated by using the same mixed-effects linear regression models that we described above for detecting significant interactive effects of different genotype combinations on the three outcome measures, which included random intercept and slope (for temporal trend) adjusted for age, gender, ethnicity defined by ancestral informative markers, center, and corresponding baseline drinking outcome measures.
Results
Demographic Characteristics
The demographic characteristics of the sample are the same as in our previous publication (3). Briefly, the present study included all 283 participants who identified themselves as being of European descent. Within this European American cohort, 122 Caucasian and 18 Hispanic individuals received ondansetron and 118 Caucasian and 25 Hispanic individuals received placebo. As discussed previously (3), potential population stratification was assessed with the 24-SNP ancestral informative marker panel using the Structure program. Results from the Structure program revealed no population admixture between those who identified themselves as Hispanic and Caucasian or between participants in the ondansetron and placebo groups. Therefore, all 283 participants were included in the final analyses, and the individual ancestral scores were used as covariates in place of self-reported ancestry.
Overall genotyping failure rates for all 21 polymorphisms examined were less than 3%. For genotyping quality control, we performed Hardy-Weinberg equilibrium tests on all 21 polymorphisms in HTR3A, HTR3B, and SLC6A4, and none of the variants showed significant deviations in either the ondansetron or the placebo group (see Table S1 in the data supplement). Thus, all 21 polymorphisms were included in the analyses detailed below. Furthermore, there were no statistically significant differences in genotype frequencies between the ondansetron and placebo groups for all genotypes included in the analyses (see Table S2 in the data supplement).
Association of Drinking Outcome Measures With HTR3A and HTR3B Polymorphisms at the Individual Level
The drinks per drinking day estimates for all genotype groups examined in this study are listed in Table S2 in the data supplement. As shown in that table, genotypes rs17614942-AC in HTR3B and rs1150226-AG, rs1176713-GG, and rs1176719-AA in HTR3A were significantly associated with reductions of more than 1.5 drinks per drinking day in response to ondansetron treatment (p<0.05). Of the four HTR3A and HTR3B SNPs that survived the screening process, rs1176719-AA did not show a statistically significant association with percentage of heavy drinking days (reduction in percentage of heavy drinking days, 15.35%; 95% confidence interval [CI]=−37.55, 6.86; p=0.175); furthermore, the association of rs1176719-AA with percentage of days abstinent neither was statistically significant nor reached the 10% threshold (improvement in percentage of days abstinent, 3.48%; 95% CI=−2.98, 9.94; p=0.291). Hence, rs1176719 was excluded (Figure 1) from further analyses performed to test the interactive effects. The rs1176713 genotype GG showed only a trend with percentage of heavy drinking days and was not significantly associated with percentage of days abstinent; yet, the magnitudes of percentage of heavy drinking days and percentage of days abstinent (Table 1) were similar to those of rs1150226-AG and rs17614942-AC. We therefore included the following genotypes in the subsequent multilocus interaction analyses: SLC6A4-LL/TT, HTR3B-rs17614942-AC, and HTR3A-rs1150226-AG and -rs1176713-GG. The false discovery rate q values for associations of drinks per drinking day with the HTR3B-rs17614942-AC and HTR3A-rs1150226-AG and -rs1176713-GG genotypes ranged from 0.156 to 0.311 (see Table S2 in the data supplement).
| Outcome Measure and Estimated Mean Difference | |||||||||||||||
|---|---|---|---|---|---|---|---|---|---|---|---|---|---|---|---|
| Genotype | Population Carrying the Genotype Combination | Drinks per Drinking Day | Percentage of Heavy Drinking Days | Percentage of Days Abstinent | |||||||||||
| Gene | SNP | Reference | Associated | Ondansetron Group | Placebo Group | % in Total Cohort | EMD (%) | 95% CI | p | EMD (%) | 95% CI | p | EMD (%) | 95% CI | p |
| HTR3B | rs17614942 | AA/CC | AC | 17/135 | 19/139 | 13 | –2.73 | –4.59, –0.87 | 0.004 | –20.45 | –37.58, –3.32 | 0.019 | 17.95 | 0.95, 34.95 | 0.039 |
| HTR3A | rs1150226 | AA/GG | AG | 20/135 | 24/139 | 16 | –1.81 | –3.51, –0.12 | 0.036 | –20.65 | –36.17, –5.12 | 0.009 | 19.75 | 4.30, 35.19 | 0.012 |
| rs1176713 | AA/AG | GG | 6/134 | 9/139 | 5 | –3.87 | –6.95, –0.78 | 0.014 | –23.98 | –51.83, 3.87 | 0.091 | 18.20 | –9.31, 45.70 | 0.195 | |
Combined Interactive Effects of Significantly Associated HTR3A, HTR3B, and Previously Reported SLC6A4-LL/TT Genotypes on Drinking
We identified three HTR3A/HTR3B (HTR3) genotypes (HTR3B-rs176149-AC, HTR3A-rs1150226-AG, and HTR3A-rs1176713-GG) in the above single-locus analyses in addition to the SLC6A4-LL/TT genotype combination in our previous study; all of these polymorphisms were associated with lowering alcohol consumption from heavy to nonheavy levels, reducing it by at least two standard drinks on a given drinking day. Yet, if these five polymorphisms are to be utilized as a marker panel for screening individual DNA samples, it is imperative to know their predictability when they are present alone or in combination with each other. To examine combined interactive effects, we adopted an analytical strategy similar to the collapsing method, which is used widely in rare-variant analyses in genetic association studies (27–31). The collapsing method investigates for the presence or absence of several rare alleles in a region of interest and then treats them as a single common variant; in our analysis, we investigated for the presence or absence of the HTR3B-rs176149-AC, HTR3A-rs1150226-AG, HTR3A-rs1176713-GG, and SLC6A4-LL/TT genotypes and combined them in two ways. First, we assessed the combined effects of HTR3 genotypes identified in this study, regardless of the presence or absence of SLC6A4-LL/TT genotypes. Second, we assessed the combined effects of HTR3 and SLC6A4-LL/TT genotypes in both the present study and the previous study.
1. Combined effects of HTR3A and HTR3B polymorphisms on drinking outcome measures, regardless of presence or absence of SLC6A4-LL/TT genotypes.
Combination 1 indicates the effects of carrying only one of the three HTR3 genotypes on ondansetron treatment response. Included subgroups are “rs1150226-AG and no rs176149-AC or rs1176713-GG,” “rs1176713-GG and no rs1150226-AG or rs176149-AC,” and “rs176149-AC and no rs1150226-AG or rs1176713-GG.” All subgroups were present in less than 5% of the total cohort, and overall, combination 1 represents 11% of the total study population.
Combination 2 indicates the effects of carrying any two of the three HTR3 genotypes on ondansetron treatment response. Included subgroups are “rs1150226-AG and rs176149-AC and no rs1176713-GG” and “rs176149-AC and rs1176713-GG and no rs1150226-AG.” All but one participant in combination 2 belonged to the subgroup “rs1150226-AG and rs176149-AC and no rs1176713-GG.” This can be partly explained by the low linkage disequilibrium (LD) between rs1176713 and the other two SNPs and the high LD between rs17614942 and rs1150226. (The r2 values for linkage are presented in the LD plot in Figure 3.)
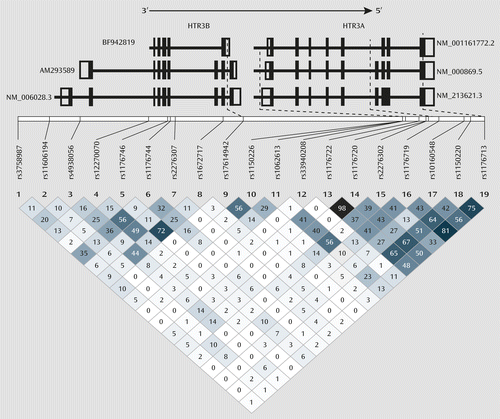
a SNPs=single-nucleotide polymorphisms. The numerals in the squares of the linkage disequilibrium plot are r2 values; the dotted lines point toward the location of significantly associated SNPs in reference to various splice variants of HTR3A and HTR3B primary mRNA. The numbers next to each splice variant indicate their accession numbers.
Combination 3 indicates the effects of possessing one or any combination of two or all three HTR3 genotypes. However, rs1176713-GG was found in only two of the rs17614942-AC carriers and was not detected in any rs1150226-AG carrier. This lack of individuals possessing all three HTR3 genotypes in our sample resulted in combination 3 being more like a pooled group of combinations 1 and 2 (23% of the total study population) rather than a new group consisting of individuals possessing one, two, or all three HTR3 genotypes. The included subgroups in combination 3 are “rs1150226-AG and rs17614942-AC and no rs1176713-GG” (48%), “AG and no AC or rs1176713-GG” (22%), “rs1176713-GG and no rs1150226-AG or rs17614942-AC” (21%), “rs17614942-AC and no rs1150226-AG or rs1176713-GG” (6%), and “rs17614942-AC and rs1176713-GG and no rs1150226-AG” (3%). As shown in Table 2 and parts A, B, and C of Figure 4, combination 3 was significantly associated with all three outcome measures: drinks per drinking day, percentage of heavy drinking days, and percentage of days abstinent. The effect sizes for associations of these three measures with ondansetron treatment outcome in combination 3 were 0.867, 0.780, and 0.683, respectively.
| Outcome Measure and Estimated Mean Difference | |||||||||||||
|---|---|---|---|---|---|---|---|---|---|---|---|---|---|
| Population Carrying the Genotype Combination | Drinks per Drinking Day | Percentage of Heavy Drinking Days | Percentage of Days Abstinent | ||||||||||
| Combination | Genotype Combination | Ondansetron Group | Placebo Group | % in Total Cohort | EMD (%) | 95% CI | p | EMD (%) | 95% CI | p | EMD (%) | 95% CI | p |
| 1 | Possessing only one of the three identified HTR3 genotypes (HTR3A-rs1150226-AG alone or HTR3B-rs17614942-AC alone or HTR3A-rs1176713-GG alone) | 15/133 | 16/138 | 11 | –2.35 | –4.41, –0.29 | 0.025 | –19.05 | –37.73, –0.36 | 0.046 | 16.12 | –2.49, 34.74 | 0.090 |
| 2 | Possessing a combination of any two of the three identified HTR3 genotypes (HTR3A-rs1150226-AG and HTR3B-rs17614942-AC or HTR3A-rs1176713-GG and HTR3B-rs17614942-AC) | 14/133 | 18/138 | 12 | –2.65 | –4.65, –0.66 | 0.009 | –22.43 | –40.77, –4.09 | 0.017 | 20.23 | 2.06, 38.40 | 0.029 |
| 3 | Possessing any one, two, or all three of the identified HTR3 genotypes (HTR3A-rs1150226-AG and/or HTR3A-rs1176713-GG and/or HTR3B-rs17614942-AC) | 29/133 | 34/138 | 23 | –2.50 | –3.92, –1.08 | 0.0006 | –20.58 | –33.53, –7.62 | 0.002 | 18.18 | 5.26, 31.10 | 0.006 |
| 4 | Possessing any one, two, three, or all four of the identified HTR3 and SLC6A4 genotypes (SLC6A4-LL/TT and/or HTR3A-rs1150226-AG and/or HTR3A-rs1176713-GG and/or HTR3B-rs17614942-AC) | 41/133 | 51/138 | 34 | –1.71 | –2.88, –0.55 | 0.004 | –11.13 | –21.94, –0.31 | 0.044 | 11.57 | 0.81, 22.33 | 0.035 |
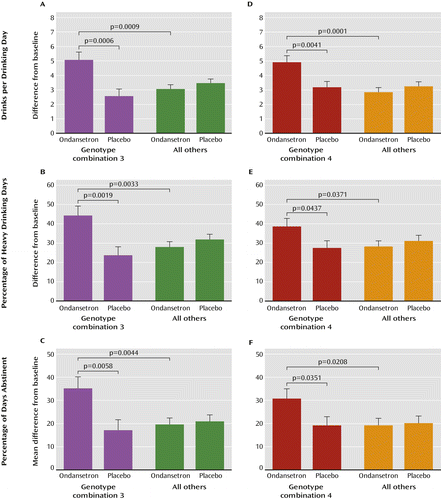
a Graphs in the left-hand column are for participants in the ondansetron or placebo group carrying any one or a combination of the HTR3A-rs1150226-AG, HTR3A-rs1176713-GG, and/or HTR3B-rs17614942-AC genotypes (genotype combination 3) who showed the best treatment response and for those not carrying these genotypes (“all others”). Graphs in the right-hand column are for participants in the ondansetron or placebo group carrying any one or a combination of the SLC6A4-LL/TT, HTR3A-rs1150226-AG, HTR3A-rs1176713-GG, and/or HTR3B-rs17614942-AC genotypes (genotype combination 4) and for those not possessing any of these genotypes (“all others”).
2. Combined effects of HTR3A,HTR3B, and previously reported SLC6A4-LL/TT on drinking outcome measures.
For our previously reported 5-HTT gene SLC6A4-LL/TT genotype combination, ondansetron was associated with a reduction of 2.08 drinks per drinking day (95% CI=−3.75, −0.41; p=0.015) relative to SLC6A4-LL/TT carriers who received placebo regardless of their genotypes at the three HTR3 SNPs; there were no statistically significant differences for percentage of heavy drinking days or percentage of days abstinent between SLC6A4-LL/TT carriers in the ondansetron and placebo groups. However, among participants in the ondansetron group, SLC6A4-LL/TT carriers, compared with noncarriers, were significantly more likely to have more abstinent days (12.68%; 95% CI=0.48, 24.89; p=0.042). Next, to study the combined effects of the HTR3 and SLC6A4-LL/TT genotypes on the three outcome variables, we pooled all subjects carrying the above-mentioned combination 3 and/or SLC6A4-LL/TT genotypes (combination 4) and compared them with the noncarriers of combination 4.
Combination 4 indicates the effects of possessing the following genotype subgroups: “LL/TT and no HTR3 genotypes” (32%), “any two HTR3 genotypes and no LL/TT” (26%), “any one HTR3 genotype and no LL/TT” (25%), “LL/TT combined with two HTR3 genotypes” (8.5%), and “LL/TT combined with only one HTR3 genotype” (8.5%). As shown in Table 2, the reductions in drinks per drinking day in combination 4 were close to two standard drinks for participants in the ondansetron group compared with those in the placebo group (p=0.004) (Figure 4D). In addition, carriers of combination 4 who were treated with ondansetron also experienced significant improvements in percentage of heavy drinking days (Figure 4E) and percentage of days abstinent (Figure 4F). The effect sizes for associations of drinks per drinking day, percentage of heavy drinking days, and percentage of days abstinent with ondansetron treatment outcome in combination 4 carriers were 0.593, 0.416, and 0.428, respectively.
Notably, in all of the above combinations, the ondansetron group not carrying the targeted genotype group (i.e., groups designated as “all others” in Figure 4), compared with their placebo counterparts, showed a trend toward worse outcomes on our three measures of alcohol consumption.
The combination 4 group included four infrequent (<5% of the total study population) subgroups carrying SLC6A4-LL/TT and one or two of the HTR3 genotypes. Associations of these infrequent genotype groups with the primary outcome measure (drinks per drinking day) are listed in Table S3 in the data supplement. As seen in that table, reductions in drinks per drinking day in these groups of individuals with markers for both HTR3 and SLC6A4 were around four standard drinks, which was greater than the reductions detected for combinations 1–4 in Table 2. The greatest reduction in drinks per drinking day was seen in the combination of SLC6A4-LL/TT and rs1176713-GG (combination 1; see Table S3).
Independent Determination of SNP-by-SNP Interactive Effects Using the GMDR Method
To validate the significant interactive effects of various genotype combinations detected by the statistical approach described earlier, we conducted an independent SNP-by-SNP interaction analysis on all SNPs of the three genes using the GMDR method. As shown in Table 3, the detected significant five-variant genotype combination for the three outcome measures, determined by the primary statistical approach above, also appeared to be significant based on the parameters of test accuracy, cross-validation consistency, and permutated p value used commonly in the evaluation of GMDR results (24, 32, 33). This provides an independent determination of the best genotype combinations that can be used to predict treatment outcomes for the three alcohol dependence measures.
| Outcome Measure and Interaction Model | Test Accuracy | Cross-Validation Consistency | Permutated pb |
|---|---|---|---|
| Drinks per drinking day | |||
| HTR3A: rs1176713–SLC6A4: 5′-HTTLPR | 0.674 | 10/10 | 0.0001 |
| HTR3A: rs1176713–SLC6A4: 5′-HTTLPR, rs1042173 | 0.595 | 10/10 | 0.039 |
| HTR3A: rs1150226, rs1176713–HTR3B: rs17614942–SLC6A4: 5′-HTTLPR, rs1042173 | 0.483 | 10/10 | 0.576 |
| Percentage of heavy drinking days | |||
| HTR3A: rs1176713–SLC6A4: 5′-HTTLPR | 0.612 | 7/10 | 0.003 |
| HTR3A: rs1176713–SLC6A4: 5′-HTTLPR, rs1042173 | 0.594 | 10/10 | 0.031 |
| HTR3A: rs1150226, rs1176713–HTR3B: rs17614942–SLC6A4: 5′-HTTLPR, rs1042173 | 0.565 | 10/10 | 0.094 |
| Percentage of days abstinent | |||
| HTR3A: rs1176713–SLC6A4: 5′-HTTLPR | 0.593 | 8/10 | 0.033 |
| HTR3A: rs1176713–SLC6A4: 5′-HTTLPR, rs1042173 | 0.628 | 10/10 | 0.003 |
| HTR3A: rs1150226, rs1176713–HTR3B: rs17614942–SLC6A4: 5′-HTTLPR, rs1042173 | 0.598 | 10/10 | 0.029 |
Adverse Events
As reported previously (3), except for fatigue (p=0.019), no other adverse events (including QT interval prolongations) occurred more frequently in the ondansetron group than in the placebo group; nor did they occur more frequently among carriers of the above-mentioned genotype combinations than among noncarriers (data not shown). There were no life-threatening events, and the five most commonly reported adverse events were insomnia (20.5% and 22.3% in the ondansetron and placebo groups, respectively), headache (20.9% and 19.4%), appetite disturbance (18.0% and 20.1%), fatigue (18.0% and 11.7%), and diarrhea (13.1% and 15.2%).
Discussion
We identified three genotypes in the HTR3A and HTR3B (collectively designated as HTR3) genes that were significantly associated with efficacy of ondansetron treatment for alcohol dependence in individuals with European ancestry. We showed that possession of at least one of the HTR3A-rs1150226-AG, HTR3A-rs1176713-GG, and HTR3B-rs17614942-AC genotypes, along with the previously identified SLC6A4-LL/TT genotypes (i.e., combination 4), was predictive of ondansetron treatment response; approximately 34% of the cohort carried these genotypes.
A unique strength of our findings was that the five-genotype combination 4 (Table 2) was associated not only with a reduction in the amount of severe drinking (drinks per drinking day) but also with two other measures of treatment response—the frequency of heavy drinking (percentage of heavy drinking days) and of abstinence (percentage of days abstinent). Additional to these widely used outcome measures, we also performed an exploratory analysis for the genotype associations with an extreme dichotomous responder versus nonresponder endpoint efficacy variable, namely, percentage of subjects with no heavy drinking days, which may be used by regulatory agencies as an important outcome measure for larger phase 3 trials (34). When only one heavy drinking day during the final 4 weeks was allowed, we detected at least a twofold increase in percentage of subjects with no heavy drinking days among participants in the ondansetron group carrying one or more of the combination 4 genotypes compared with participants in the placebo group or noncarriers in the ondansetron group. Notably, however, the carriers of combination 3 who constituted a subset of combination 4 (approximately 25% of the cohort) had more than a fivefold increase in percentage of subjects with no heavy drinking days when the ondansetron and placebo groups were compared, and they might define a group of “super-responders.”
Furthermore, the greatest reductions in drinks per drinking day were seen in small subpopulations possessing both SLC6A4-LL/TT genotypes and any one or more of the HTR3 genotypes. This finding supports our hypothesis that the combined effects of genetic variants for the presynaptic 5-HTT and postsynaptic 5-HT3 would predict a greater response than genetic variations within each individual gene, as they represent the state of both synaptic availability of serotonin and its postsynaptic receptor levels. Another factor supporting this hypothesis is the greater effect of SLC6A4 plus HTR3 than the combined effect of the HTR3A and HTR3B genotypes. However, results for the combined effect of SLC6A4 and HTR3 should be interpreted cautiously, as they were limited by the small sample size within each placebo and ondansetron treatment-by-genotype group (see Table S3 in the online data supplement), thereby reducing the statistical power to draw definitive conclusions. Nevertheless, these initial statistical trends generally supporting a molecular basis for the use of ondansetron as a treatment for a particular cohort of alcohol-dependent individuals warrant further corroboration using studies with larger sample sizes.
The second-best response for drinks per drinking day was seen in the pooled group of individuals carrying any one or a combination of the three HTR3 genotypes, regardless of LL/TT carrier status (combination 3 in Table 2). From a biological perspective, this is quite explainable, since 5-HT3AB receptors are the primary target of ondansetron, which in fact led us to select HTR3A and HTR3B as candidate genes for the present study. Even though ondansetron’s therapeutic effect on the selected SLC6A4 genotypes may appear to be smaller than that on the target HTR3 genotypes, presumably because the biological effect of the 5-HTT on ondansetron’s pharmacodynamics is an indirect one, their interaction is most intriguing in showing a more robust response across different outcome measures of alcohol consumption.
Notably, the significant associations that we detected with SNPs rs1150226 and rs17614942 were through their heterozygous genotypes; that is, the heterozygotes showed significantly greater response to ondansetron compared with both homozygous genotype carriers. Although it is argued that such a comparison utilizing the heterozygous genetic model may not reflect underlying biological mechanism(s), a dominant heterozygous effect over both homozygotes, which is also referred to as molecular heterosis, is an increasingly recognized phenomenon in many human gene-disease association studies that include addictions (35–39). Another possible explanation for detecting heterozygous associations could be the small sample sizes of the homozygous minor allele genotype groups, rather than the effects of molecular heterosis.
An additional caveat is that the preclinical studies of the functionality of rs1150226 and rs1176713 of HTR3A and rs17614942 of HTR3B have not been reported in the literature, and therefore the exact molecular mechanism for their interactive effects remains to be determined. However, given their location within the genes, it is possible that all three of these polymorphisms may alter mRNA expression levels. The rs1150226 is located in the promoter region of HTR3A within 1 kb of putative binding sites for several transcription factors that have been shown to be modulated by ethanol (40, 41). Furthermore, genetic association analyses have shown an association of rs1150226 with alcoholism comorbid with antisocial personality disorder (16), altered temporal lobe activity (42), and clozapine treatment outcome for schizophrenia (43). Both rs1176713, which is a synonymous SNP located on exon 8 (Leu459Leu) of HTR3A, and rs17614942, located in intron 8 of HTR3B, could alter expression levels of functional 5-HT3AB subunits through altered splicing of primary mRNA to form nonfunctional secondary mRNA. Interestingly, rs17614942 is located in different regions in different mRNA isoforms (Figure 3). In primary mRNA isoforms AM293589 and NM.006028.3 (http://www.ncbi.nlm.nih.gov/IEB/Research/Acembly/av.cgi?c=geneid&org=9606&l=9177), the two longer HTR3B mRNA transcripts that are found to be present in the brain, rs17614942 is located in intron 8. In rodents, intron 8 consists of a splice acceptor site that results in the long isoform (44); even though this site is not known to be present in humans, it underlines the importance of the intron 8 region in the formation of various mRNA splice variants. In the shorter primary mRNA isoform BF942819 (http://www.ncbi.nlm.nih.gov/IEB/Research/Acembly/av.cgi?c=geneid&org=9606&l=9177), which has not yet been reported to be present in the brain, rs17614942 is located in the 3′-UTR, which can also lead to changes in functional 5-HT3B subunit expression level through different molecular mechanisms, such as altered mRNA polyadenylation, miRNA binding, and decay. In vivo experiments would be required to characterize accurately the functional effects of the variants in combination 4, both individually and collectively. We therefore propose our theorization as a framework on which to launch further molecular investigations (3).
Another caveat regarding our findings is that the sample size was relatively small for performing statistical comparisons for all different genotype combinations constituted by the five variants included in combination 4. It is therefore not possible to dissect fully the relative contribution of each individual genotype with treatment response. However, an analysis that tested for all 16 different combinations of the five variants was well beyond the scope of this phase 2 clinical trial and would require a multicenter clinical trial that enrolled several thousand treatment-seeking alcohol-dependent individuals.
Another consideration was that we used a descriptive filtering process to control for type I error, by minimizing the number of inferential contrasts, to understand the relationship between ondansetron treatment response and genotype. Thus, an additional replication study is needed in a much larger sample to validate our results. Furthermore, because the frequency of the identified alleles may vary in different ethnic populations, additional studies are needed to test the applicability of our findings to other ethnic populations. Nevertheless, our findings were bolstered by the fact that the combination 4 variants also were included in the detected significant genetic epistatic models by GMDR independent epistatic analyses, which were performed to validate the findings from the primary analysis.
Interestingly, a previous association study conducted by Enoch et al. (15) suggested that rs1176744 polymorphisms in HTR3B and SLC6A4 (LALA) were associated with the development of alcohol dependence and, speculatively, ondansetron treatment response. Confirming these findings, an independent association analysis conducted by our team (45) also showed a highly significant association between alcohol dependence and a genotype combination comprising HTR3A-rs10160548, HTR3B-rs1176744 and -rs3782025, SLC6A4-rs1042173, and 5′-HTTLPR polymorphisms.
In conclusion, we have shown that polymorphisms in the SLC6A4, HTR3A, and HTR3B genes are predictors of reduced drinking in response to ondansetron. Based on these findings, we hypothesize that the combination 4 genotypes can be used to screen for individuals who would respond to ondansetron. Furthermore, the effect sizes of combination 4 across different measures of alcohol consumption appear to be medium to high. Clinical trials randomized on the basis of combination 4 genotypes are thus needed to test the replicability of our findings.
1 : Genetics of alcoholism using intermediate phenotypes. Alcohol Clin Exp Res 2003; 27:169–176Crossref, Medline, Google Scholar
2 : Update on neuropharmacological treatments for alcoholism: scientific basis and clinical findings. Biochem Pharmacol 2008; 75:34–56Crossref, Medline, Google Scholar
3 : Pharmacogenetic approach at the serotonin transporter gene as a method of reducing the severity of alcohol drinking. Am J Psychiatry 2011; 168:265–275Link, Google Scholar
4 : Serotonin-3 receptors in the actions of alcohol, alcohol reinforcement, and alcoholism. Alcohol Clin Exp Res 2004; 28:257–267Crossref, Medline, Google Scholar
5 : Characterization of the novel human serotonin receptor subunits 5-HT3C, 5-HT3D, and 5-HT3E. Mol Pharmacol 2007; 72:8–17Crossref, Medline, Google Scholar
6 : Activity of alpha7-selective agonists at nicotinic and serotonin 5HT3 receptors expressed in Xenopus oocytes. Bioorg Med Chem Lett 2004; 14:1849–1853Crossref, Medline, Google Scholar
7 : Assembly and cell surface expression of homomeric and heteromeric 5-HT3 receptors: the role of oligomerization and chaperone proteins. Mol Cell Neurosci 2002; 21:38–50Crossref, Medline, Google Scholar
8 : Can serotonin transporter genotype predict serotonergic function, chronicity, and severity of drinking? Prog Neuropsychopharmacol Biol Psychiatry 2008; 32:209–216Crossref, Medline, Google Scholar
9 : Serotonin transporter gene variation is associated with alcohol sensitivity in rhesus macaques exposed to early-life stress. Alcohol Clin Exp Res 2003; 27:812–817Crossref, Medline, Google Scholar
10 : Serotonin transporter gene regulatory region polymorphism (5-HTTLPR), [3H]paroxetine binding in healthy control subjects and alcohol-dependent patients and their relationships to impulsivity. Psychiatry Res 2000; 96:51–61Crossref, Medline, Google Scholar
11 : A relationship between serotonin transporter genotype and in vivo protein expression and alcohol neurotoxicity. Biol Psychiatry 2000; 47:643–649Crossref, Medline, Google Scholar
12 : The pharmacological and functional characteristics of the serotonin 5-HT(3A) receptor are specifically modified by a 5-HT(3B) receptor subunit. J Biol Chem 1999; 274:30799–30810Crossref, Medline, Google Scholar
13 : High-frequency HTR3B variant associated with major depression dramatically augments the signaling of the human 5-HT3AB receptor. Proc Natl Acad Sci USA 2008; 105:722–727Crossref, Medline, Google Scholar
14 : 5-HT(3A) receptor subunit is required for 5-HT3 antagonist-induced reductions in alcohol drinking. Neuropsychopharmacology 2004; 29:1807–1813Crossref, Medline, Google Scholar
15 : Functional genetic variants that increase synaptic serotonin and 5-HT3 receptor sensitivity predict alcohol and drug dependence. Mol Psychiatry 2011; 16:1139–1146Crossref, Medline, Google Scholar
16 : HTR3B is associated with alcoholism with antisocial behavior and alpha EEG power: an intermediate phenotype for alcoholism and co-morbid behaviors. Alcohol 2009; 43:73–84Crossref, Medline, Google Scholar
17 : The Alcohol Use Disorders Identification Test (AUDIT): validation of a screening instrument for use in medical settings. J Stud Alcohol 1995; 56:423–432Crossref, Medline, Google Scholar
18 : Cognitive-Behavioral Coping Skills Therapy Manual: A Clinical Research Guide for Therapists Treating Individuals With Alcohol Abuse and Dependence (NIH Publication No 92-1895). Washington, DC, US Department of Health and Human Services, 1992Google Scholar
19 : Timeline follow-back: a technique for assessing self-reported alcohol consumption, in Measuring Alcohol Consumption: Psychosocial and Biochemical Methods. Edited by Litten RZAllen JP. Totowa, NJ, Humana Press, 1992, pp 41–72Crossref, Google Scholar
20 : Characterization of a functional polymorphism in the 3′ UTR of SLC6A4 and its association with drinking intensity. Alcohol Clin Exp Res 2009; 33:332–339Crossref, Medline, Google Scholar
21 : Haploview: analysis and visualization of LD and haplotype maps. Bioinformatics 2005; 21:263–265Crossref, Medline, Google Scholar
22 : Controlling the false discovery rate in behavior genetics research. Behav Brain Res 2001; 125:279–284Crossref, Medline, Google Scholar
23 : Statistical Power Analysis for the Behavioral Sciences, 2nd ed. Hillsdale, NJ, Lawrence Erlbaum Associates, 1988Google Scholar
24 : A generalized combinatorial approach for detecting gene-by-gene and gene-by-environment interactions with application to nicotine dependence. Am J Hum Genet 2007; 80:1125–1137Crossref, Medline, Google Scholar
25 : Detecting gene-gene interactions that underlie human diseases. Nat Rev Genet 2009; 10:392–404Crossref, Medline, Google Scholar
26 : Epistasis and its implications for personal genetics. Am J Hum Genet 2009; 85:309–320Crossref, Medline, Google Scholar
27 : Statistical analysis of rare sequence variants: an overview of collapsing methods. Genet Epidemiol 2011; 35(suppl 1):S12–S17Crossref, Medline, Google Scholar
28 : Methods for detecting associations with rare variants for common diseases: application to analysis of sequence data. Am J Hum Genet 2008; 83:311–321Crossref, Medline, Google Scholar
29 : Rare variant association analysis methods for complex traits. Annu Rev Genet 2010; 44:293–308Crossref, Medline, Google Scholar
30 : Statistical analysis strategies for association studies involving rare variants. Nat Rev Genet 2010; 11:773–785Crossref, Medline, Google Scholar
31 : A groupwise association test for rare mutations using a weighted sum statistic. PLoS Genet 2009; 5:e1000384Crossref, Medline, Google Scholar
32 : Gene-gene interactions among CHRNA4, CHRNB2, BDNF, and NTRK2 in nicotine dependence. Biol Psychiatry 2008; 64:951–957Crossref, Medline, Google Scholar
33 : Association and interaction analyses of GABBR1 and GABBR2 with nicotine dependence in European- and African-American populations. PLoS ONE 2009; 4:e7055Crossref, Medline, Google Scholar
34 : Percentage of subjects with no heavy drinking days: evaluation as an efficacy endpoint for alcohol clinical trials. Alcohol Clin Exp Res 2010; 34:2022–2034Crossref, Medline, Google Scholar
35 : Brain-derived neurotrophic factor Val66Met and psychiatric disorders: meta-analysis of case-control studies confirm association to substance-related disorders, eating disorders, and schizophrenia. Biol Psychiatry 2007; 61:911–922Crossref, Medline, Google Scholar
36 : A 5-HT2C receptor promoter polymorphism (HTR2C-759C/T) is associated with obesity in women, and with resistance to weight loss in heterozygotes. Am J Med Genet B Neuropsychiatr Genet 2004; 126B:124–127Crossref, Medline, Google Scholar
37 : Gender-specific molecular heterosis of dopamine D2 receptor gene (DRD2) for smoking in schizophrenia. Am J Med Genet 2002; 114:593–597Crossref, Medline, Google Scholar
38 : Dopamine D3 receptor gene polymorphism and violent behavior: relation to impulsiveness and ADHD-related psychopathology. J Neural Transm 2003; 110:561–572Crossref, Medline, Google Scholar
39 : Catechol O-methyl transferase and dopamine D2 receptor gene polymorphisms: evidence of positive heterosis and gene-gene interaction on working memory functioning. Eur J Hum Genet 2008; 16:1075–1082Crossref, Medline, Google Scholar
40 : Ethanol-mediated regulation of transcription factors in immunocompetent cells. Front Biosci 2002; 7:a80–a89Crossref, Medline, Google Scholar
41 : Ethanol exhibits specificity in its effects on differentiation of hematopoietic progenitors. Cell Immunol 2009; 255:1–7Crossref, Medline, Google Scholar
42 : Physiogenomic analysis of localized fMRI brain activity in schizophrenia. Ann Biomed Eng 2008; 36:877–888Crossref, Medline, Google Scholar
43 : Influence of serotonin 3A and 3B receptor genes on clozapine treatment response in schizophrenia. Pharmacogenet Genomics 2010; 20:274–276Medline, Google Scholar
44 : Exon-intron organization of the human 5-HT3A receptor gene. Neuropharmacology 2000; 39:308–315Crossref, Medline, Google Scholar
45 : Association, interaction, and replication analysis of genes encoding serotonin transporter and 5-HT3 receptor subunits A and B in alcohol dependence. Hum Genet (in press)Google Scholar