Association of Mu-Opioid Receptor Variants and Response to Citalopram Treatment in Major Depressive Disorder
Abstract
Objective
Because previous preclinical and clinical studies have implicated the endogenous opioid system in major depression and in the neurochemical action of antidepressants, the authors examined how DNA variation in the μ-opioid receptor gene may influence population variation in response to citalopram treatment.
Method
A total of 1,953 individuals from the Sequenced Treatment Alternatives to Relieve Depression (STAR*D) study were treated with citalopram and genotyped for 53 single nucleotide polymorphisms (SNPs) in a 100-kb region of the OPRM1 gene. The sample consisted of Non-Hispanic Caucasians, Hispanic Caucasians, and African Americans. Population stratification was corrected using 119 ancestry informative markers and principal components analysis. Markers were tested for association with phenotypes for general and specific citalopram response as well as remission.
Results
Association between one SNP and specific citalopram response was observed. After Bonferroni correction, the strongest finding was the association between the rs540825 SNP and specific response. The rs540825 polymorphism is a nonsynonymous SNP in the final exon of the μ-opioid receptor-1X isoform of the OPRM1 gene, resulting in a histidine to glutamine change in the intracellular domain of the receptor. When Hispanic and Non-Hispanic Caucasians were analyzed separately, similar results in the population-corrected analyses were detected.
Conclusions
These results suggest that rates of response to antidepressants and consequent remission from major depressive disorder are influenced by variation in the μ-opioid receptor gene as a result of either an effect on placebo response or true pharmacologic response.
Antidepressant response rates in the Sequenced Treatment Alternatives to Relieve Depression (STAR*D) study averaged <50% for treatment with citalopram (level 1 treatment condition), with only approximately 30% of subjects remitting from major depressive disorder (1). Interindividual differences, such as genetic distinction, may contribute to this variation in response to antidepressant treatment, and two genes have already been identified in two studies (2, 3). In the present study, we add to the findings of these investigations and show that the μ-opioid receptor gene is associated with antidepressant response and remission from major depressive disorder
Mu-opioid receptors are G protein-coupled transmembrane receptors, with affinity for endogenous opioid peptide neurotransmitters and natural and synthetic opiates (e.g., morphine, heroin). The human μ-opioid receptor is encoded by the OPRM1 gene, which is located on chromosome 6q24-q25. Alternative splicing of OPRM1 and the resulting protein isoforms are well documented in mouse, rat, and human studies (4–6), and new isoforms have been reported (7). There are differences between mice and humans in terms of splice variants and predicted protein isoforms. However, some conservation in the 3′ region of the OPRM1 gene is present (8). Measurable differences in receptor binding (affinity and selectivity) exist between the variants and pharmacologic agents (9). Significant sequence variation also exists in this gene, and the frequencies of many variants differ among ethnic groups (10).
Most investigators examining genetic associations with human phenotypes have focused on a single OPRM1 DNA variant consisting of a single nucleotide polymorphism (SNP) in the extracellular region of the protein. This SNP, rs1799971, is an A to G substitution at nucleotide position 118, resulting in an asparagine to aspartic amino acid substitution (N40D). The reported functional effect of aspartic acid on the OPRM1 protein is a threefold greater binding to beta-endorphin (11), a 1.5- to 2.5-fold reduction in mRNA, and one-tenth the protein level when compared with the aspartic acid allele (12).
Specific DNA variation in the OPRM1 gene has yet to be associated with major depression. However, the availability of the μ-opioid receptor (i.e., its binding potential) has been measured in women with major depressive disorder and nondepressed female comparison subjects. At baseline, the binding potential of the μ-opioid receptor is significantly lower in women with major depressive disorder relative to nondepressed women (13). Similar differences exist for response to antidepressant treatment in the female population. Women with major depressive disorder who did not respond to antidepressant treatment exhibited lower binding potential for the μ-opioid receptor when compared with depressed women who responded to medication, potentially decreasing the potential for an endogenous opioid-mediated placebo response. Chronic administration of antidepressants in animal models results in decreased protein levels of the μ-opioid receptor and increased transcript levels in the hippocampus (14) as well as regional differences in coupling between the μ-opioid receptor and G proteins (15).
Several investigators used the STAR*D sample to study candidate gene variation in association with citalopram response, the results of which have already been reviewed (16, 17). The most significant reported association with citalopram response is for a SNP in the serotonin 5-HT2A receptor gene (HTR2A) (2). An interaction between this SNP and a variant in the kainic acid-type glutamate receptor KA1 gene (GRIK4) confers higher risk of nonresponse to citalopram (3). Our study design is similar to these aforementioned studies. However, our definition of phenotype, inclusion of more than one ethnic group, and control of population stratification are key differences and make direct comparison difficult.
The present study examines the association between DNA variants in the OPRM1 gene and citalopram treatment response and remission in the STAR*D sample. In addition, in vitro analyses were performed to demonstrate the presence and function of certain isoforms of the OPRM1 gene. We hypothesized that individuals with reduced capacity to respond to citalopram may have a defect in the endogenous opiate system, preventing full alleviation of symptoms in response to antidepressant medication. This would suggest that changes in endogenous opioid neurotransmission may be associated with both depression and response to antidepressant medication.
Method
The DNA samples of 1,953 individuals with major depressive disorder were collected from level 1 of the STAR*D clinical trial, as described previously (18). Ethnic classifications were made based on self-report information. For all analyses, we only assessed individuals of Hispanic Caucasian, Non-Hispanic Caucasian, and African American ancestry because these three groups consisted of the largest sample numbers. For our primary analyses, we combined these ancestral groups. For the secondary analyses, we stratified subjects by ancestry. Assessment of depressive symptoms was made using the Quick Inventory of Depressive Symptomatology–Self Report (19). The only STAR*D treatment condition considered was level 1, consisting of citalopram treatment. Phenotypes analyzed for association with the OPRM1 genetic variants were the three response phenotypes detailed below, which have been described previously (18, 20). All subjects were required to have been enrolled in the STAR*D trial for at least 42 days to ensure sufficient exposure to citalopram and to reduce phenotypic heterogeneity. Subjects excluded were those for whom phenotypic follow-up data were not available (N=16) and those who were not in one of the three ancestry categories analyzed (N=123).
1. Remission phenotype was defined as having a Quick Inventory of Depressive Symptomatology–Self Report score ≤5 at the end of acute treatment. This was the comparison of those subjects who achieved remission versus those who did not respond to treatment.
2. Response (general) phenotype was defined as having a 50% reduction in the Quick Inventory of Depressive Symptomatology–Self Report score from baseline to the last visit. This was the comparison of those subjects who responded to treatment versus those who did not respond (these nonresponders were the same group assessed in the remission analysis).
3. Specific response phenotype was defined as subjects who responded to treatment and exhibited a maintained response for at least two visits and no subsequent visit with nonresponse. This was the comparison of specific responders versus nonresponders.
DNA samples and clinical data access were approved by the STAR*D Ancillary Studies Committee, and clinical data were obtained from the Data Coordinating Center of STAR*D. Approval to carry out the present analyses was obtained by the Committee on Human Research at the University of California, San Francisco.
Genotyping
A total of 53 SNPs in the OPRM1 gene were genotyped using TaqMan (N=11) and SNPlex (N=42) (Applied Biosystems, Foster City, Calif.). TaqMan and SNPlex assays were designed according to the manufacturer's recommendations (see the data supplement accompanying the online version of this article). Three SNPs were run on both TaqMan and SNPlex platforms for quality control.
Allele frequencies, SNP effects, and positions are presented in Table 1 of the online data supplement. Figure 1 in the online data supplement shows the distribution of the SNPs genotyped in the OPRM1 gene. SNPs with <90% call rates were excluded from analyses. This included five SNPs (rs17174638, rs17174829, rs1799972, rs3798678, and rs645027) that did not pass quality control measures, resulting in a final association study of 48 SNPs.
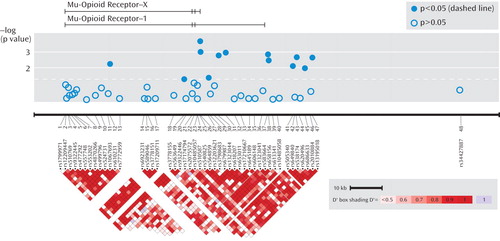
aThe top image depicts the μ-opioid receptor-X and -1 transcripts. The relative positions of the SNPs are shown horizontally by physical position. A single, distant SNP was placed near the final exon of the μ-opioid receptor-1O transcript. The bottom graph illustrates pairwise linkage disequilibrium measures for SNPs <50 kb apart, with greater shades of red indicating increasing D′. Phenotype shown is specific response.
 |
SNP Selection
SNPs were chosen according to the following conditions: coverage of the 100-kb region encompassing the μ-opioid receptor-1, μ-opioid receptor-1X, and μ-opioid receptor-1A transcripts. HapMap data were used to choose markers with minor allele frequencies >0.05 and pairwise r2 values ≥0.95 in the Yoruban HapMap samples as a way to maximize the coverage of the region. An additional SNP was chosen to tag the region surrounding the distant, final μ-opioid receptor-1O exon.
The chosen SNPs capture common variation remarkably well. We found 117 SNPs with a minor allele frequency >5% in a 98.8-kb interval (chromosome 6:154,402,262–154,500,643) in the Centre d'Etude du Polymorphisme Humain Utah HapMap phase II and III databases. Only 36 of the 53 SNPs genotyped were needed to capture all 117 alleles at r2 values ≥0.8. Since we analyzed a population consisting of different ethnic groups and admixture, we erred on the side of redundancy in the coverage of the region of interest.
Statistical Analyses
We had 80% power to detect a gene-only effect of an odds ratio of approximately 1.3, given our sample size from the STAR*D trial, an alpha of 0.05, and a minor allele frequency of 0.25 (see the online data supplement).
We used unconditional logistic regression analysis to examine associations of the SNPs with each of the three phenotypic comparisons. These comparisons were 1) subjects who achieved remission versus those who did not respond to treatment, 2) subjects who responded to treatment versus those who did not respond, and 3) specific responders versus nonresponders. Each polymorphism was modeled individually as a gene-dosage effect in the regression models. This coding scheme was chosen because of its robustness to departure from the true additive genetic model (21). Regression analyses were performed either unadjusted or adjusted for potential clinical/demographic confounding effects, including sex, age, education (years of school completed), months in the current major depressive episode, substance abuse (as a result of previous association study findings), and years since the first major depressive episode. We found that adjustment for potential clinical/demographic confounders did not influence the results, and thus the values reported in this study are unadjusted, except those for substance abuse. We estimated odds ratios and 95% confidence intervals (CIs) for the additive genetic model. Haplotype analyses for all phenotypes were used to determine haplotype frequencies for two main haplotypic blocks that showed SNP-level association, and a global score test (implemented using haplo.stats) was used to evaluate statistical significance.
To reduce the potential for ancestry as a confounding variable, analyses were carried out using the principal components analysis method with a set of ancestry informative markers (22), as described below. For these analyses, 119 SNPs were used as ancestry informative markers, and all samples utilized were from subjects self-identified as Hispanic Caucasian, Non-Hispanic Caucasian, or African American. Other ancestry categories were not considered because of the small numbers of those samples (see the online data supplement). Principal components were created with S-PLUS, Version 8.0.1, software (Insightful Corp., Seattle), using the "princomp" function. The first 10 principal components were taken to represent population stratification and used as covariates in the association analysis. The principal components derived from ancestry informative marker data accounted for 29% of variation (see Table 10 in the online data supplement).
We used SNP spectral decomposition (23) to determine an estimate of the number of noncollinear tests actually being performed. As a result, we corrected for 23.4 independent SNPs, resulting in a Bonferroni-corrected p value of 0.0007 for three phenotypes. To determine whether the effect of a SNP was consistent across ethnic groups, race (Non-Hispanic Caucasian, Hispanic Caucasian, and African American) was also considered as an interaction term in separate models. Statistically significant p values (p<0.05) from these models indicated a differential effect of the SNP among the ethnic groups. These analyses were followed up by stratifying for race in the association analyses, testing Hispanic Caucasian, Non-Hispanic Caucasian, and African American subjects separately. Statistical analyses were performed using SAS, Version 8.2 (SAS Institute, Cary, N.C.), or S-PLUS, Version 6.2.1, software.
Results
Association With Variants in the OPRM1 Gene and Citalopram Response
As seen in Figure 1, association was tested for phenotypes (remission, response, and specific response) for 48 SNPs in the OPRM1 gene region in 1,631 STAR*D subjects.
Table 1 shows statistically significant principal components analysis-corrected association findings (all p values ≤0.005) for variants in the OPRM1 gene and response and remission phenotypes. The two most significant findings were for SNPs rs540825 and rs562859, when analyzed for association with specific response, with respective p values of 0.0002 and 0.0009. Specific response as a phenotype seemed to be more homogeneous because similar results were detected between this phenotype and the general response phenotype. However, even with smaller numbers, the specific response phenotype consistently resulted in more significant findings and larger effects for the same SNPs. SNPs rs540825 and rs562859 are located in the alternative exon defining the μ-opioid receptor-1X isoform; are predicted to lead to nonsynonymous and synonymous coding changes, respectively; and are separated by 128 base pairs. Linkage disequilibrium between these two SNPs was moderate (r2=0.51) (Figure 1 [also see the online data supplement]). A SNP in strong linkage disequilibrium with rs540825 (rs583664 [26.7 kb, 3′ region]) showed association (specific response: p=0.001). Similarly, two SNPs in linkage disequilibrium with rs562859 (rs1323044, rs658156) showed association (p values for specific response were 0.001 and 0.003, respectively). Results for all SNPs tested for association with response, specific response, and remission are presented in the online data supplement. No associations were observed for haplotype analyses.
Table 2 shows association of the rs540825 polymorphism with specific response in all models analyzed. This involved testing whether race influenced results (race as an interaction model), followed by a model for analyzing each ancestral group separately and, finally, using the full ancestry-corrected principal components analysis model. No effect was detected in African Americans (odds ratio=1.00) or Hispanic Caucasians (odds ratio=0.98). In Non-Hispanic Caucasians, a statistically significant effect was detected (odds ratio=1.51, p=0.001), which contributed to the results in the principal components analysis model (odds ratio=1.57, p=0.0002). These findings demonstrate potential ancestry-specific results for the rs540825 SNP and highlight the importance of adjusting for ancestry in genetic association studies.
 |
When the self-identified ancestry groups were analyzed separately, the most significant finding was for the rs540825 polymorphism for specific response in non-Hispanic Caucasians, followed by rs583664 for the same ethnic group and phenotypic elements (see Table 6 in the online data supplement). Two associated SNPs were located in the alternatively spliced exon of the μ-opioid receptor-1X isoform, suggesting that this isoform is associated with antidepressant response. However, we were not able to determine the exact location of the signal.
The correlation coefficients for rs540825 and other SNPs shown in Table 1 are presented in the online data supplement. These data show that although there was some correlation between rs540825 and other significant SNPs, there were SNPs tested that had nominally significant p values (e.g., rs562859 for specific response: p=0.0009) and were in moderate linkage disequilibrium (r2=0.51) with rs540825.
We assessed the level of correlation among the p values for each SNP across response phenotypes, since it was not expected that independent association tests would have correlated results. Not surprisingly, we found that the p values were highly correlated at the SNP level. For example, p values for the three analyses were correlated (e.g., remission and specific response analyses: r=0.96). The phenotypes were indeed correlated because the remission and specific responder groups were nested subsets of the responder group. Furthermore, the nonresponders were the same group for the general response and remission analyses.
Since concomitant medication use was not controlled in the STAR*D trial, it is possible that subjects were taking opioid receptor agonists or antagonists, which may have interfered with the genotype-driven effect that we were observing and thus reduced our power to detect association. Therefore, we assessed the role of self-reported concomitant narcotic usage at any point during level 1 of the STAR*D trial. We found that self-reported narcotic use was associated with an increased likelihood of nonresponse to treatment when subjects who did self-report concomitant narcotic use were compared with those who did not. Although this was the case, self-reported narcotic usage (N=112) versus no reported narcotic use (N=1,406) was not associated with any of the SNPs associated with antidepressant response in this analysis. This was the case whether or not 10 principle components were used in the analysis to correct for population stratification.
The analysis using the principal components model with all the ethnic groups examined together provided a larger sample with more power to detect smaller effects with the 48 SNPs. When we tested self-identified race as an interaction term in the model, it was significant for some SNPs (see Table 8 in the online data supplement), most notably rs540825, indicating that the effect of that SNP was different among the three ethnic groups. Specifically, this SNP showed little evidence of association in African Americans relative to Hispanic Caucasians and Non-Hispanic Caucasians. This may have been the result of reduced ability to detect an effect in the smaller ethnic subsample, although the high p values and near unitary odds ratios in the context of a significant interaction term suggest that this may not be the case. Alternatively, the observation may reflect a true population-specific effect. To facilitate interpretation of association results and significant race interaction terms for all SNPs listed in Table 1, the p values for race interaction term, principal components analysis, and race-stratified analysis are listed in Table 9 of the online data supplement. Inspection of the analyses stratified by race for associated SNPs suggests that while the p values were not significant across all subgroups, odds ratios tended to go in the same direction, implying limited power in the smaller subgroups. In most cases, the signal detected in the principal components analysis test was driven by the non-Hispanic Caucasian sample. However, the Hispanic sample usually had similar odds ratios but larger p values, owing to a smaller sample size for this group. The associations did not generally hold up in the African American sample, suggesting either too small of a sample size or a population-specific effect.
Given that the most associated SNP predicted an amino acid substitution in the carboxyl-terminal cytoplasmic domain of the μ-opioid receptor-1X transcript, a region of the receptor that is known to be important to both opioid receptor signaling and regulation (24), we carried out a careful functional comparison of relevant cloned human μ-opioid receptor variants in a well-established human cell culture model that does not express endogenous opioid receptors (25). Fluorescence microscopy indicated that all of the receptor variants, including both alleles of rs540825, are delivered to the plasma membrane following expression in this cell model (see Figure 4 in the online data supplement). This was verified quantitatively by fluorescence flow cytometry, which also established that our cell clones expressed each of the variants at closely similar levels. We also observed that μ-opioid receptor-1X variants were functional in intact cells and demonstrated that each responded to an opioid peptide with a similar dose dependence, as determined using biochemical assay of adenylyl cyclase inhibition in intact cells, indicating that they were capable of mediating G protein-dependent signaling with similar potency and efficacy as μ-opioid receptor-1 variants. In addition, we examined ligand-induced endocytosis of receptors, an important component of μ-opioid receptor regulation that is promoted by receptor interaction with arrestins (24), and found that both alleles were similar in this respect as well (see Figure 5 in the online data supplement). Presence of the μ-opioid receptor-1X isoform in human brain samples was also detected (see Figure 3 in the online data supplement). These results establish the presence and functionality of the μ-opioid receptor-1X isoform and did not detect any significant SNP effect on receptor function.
Discussion
This study demonstrates the influence of genetic variation in the OPRM1 gene on antidepressant response and remission from major depressive disorder during citalopram treatment. The most statistically significant finding was for a single SNP for the specific response phenotype, which met a correction threshold for the number of markers tested. This SNP, rs540825, was predicted to lead to the exchange of a glutamine residue for a histidine residue in the carboxyl terminal region of the alternatively spliced μ-opioid receptor-1X transcript. Given the correlation between markers in the region, we cannot rule out variation in the final exon of the μ-opioid receptor-1 transcript or in the regions flanking these exons. All of the SNPs in Table 1 reside within a 44-kb region encompassing the final exons of the μ-opioid receptor-1 and -1X splice variants. Interestingly, we did not detect significant findings for the most commonly studied OPRM1 SNP, the nonsynonymous rs1799971, for any of the analyzed phenotypes. For the most associated SNP in the ancestry-corrected principal components analysis model, rs540825, we were not able to detect an effect in either the African American or Hispanic Caucasian subjects, but there was evidence of association in the Non-Hispanic Caucasian subjects. This may have been the result of lack of power resulting from the smaller sample size of these ethnic groups in our study sample. However, the race interaction term was significant, indicating a difference between the ancestral groups.
Association with the OPRM1 gene was nominal in our genome-wide association of citalopram response, using the same sample. Although the rs540825 SNP was not directly genotyped on the arrays used, several SNPs in modest linkage disequilibrium with rs540825 showed p values ranging from 0.02 to 0.06 for response and remission phenotypes (26). This highlights the potential utility of targeted genotyping at higher density in genes of interest or potentially for whole-genome sequencing. In the context of studying an entire genome of 2.8 billion base pairs, the findings in our study would not meet genome-wide significance for association (i.e., p<1.76×10⁻¹¹), but such an extremely conservative statistical view has not been generally adopted in association studies such as this.
Association studies are plagued with conflicting results for various reasons, the main one being phenotypic heterogeneity. This may come about as a result of differential syndromal definitions, varying instrumentation used for assessment, and ethnic classification between studies. Our efforts to decrease this common problem in our study consisted of treatment in one condition only (citalopram), a rigorous phenotype of response to citalopram, and correction for population stratification. The results were strengthened by identification of responders who were more likely to be true drug responders; that is, specific responders.
In vitro experiments comparing the nonsynonymous-associated SNP rs540825 showed that both the A and T alleles encode functional opioid receptors but failed to reveal any significant difference between alleles in receptor signaling or regulation. However we cannot exclude functional distinctions between alleles that might occur in physiologically relevant neurons but not in the heterologous cell model examined, since HEK-293 cells do not fully recapitulate the cellular environment of neural tissue. This possibility may merit investigation in future studies. Although rs540825 is an appealing candidate for functional studies, it is also possible that it is in linkage disequilibrium with a nontyped variant that may be functionally relevant.
The odds ratios observed for the rs540825 variant ranged from 1.4 to 1.6 for general response, remission, and specific response. We can compare these odds ratios with those seen in other candidate gene studies using the STAR*D sample, namely for the HTR2A finding (2). For the HTR2A SNP, we found an odds ratio of 1.52 for remission and 1.43 for response (27). We analyzed our data for interaction between the previously reported HTR2A SNP (rs7997012) and our OPRM1 SNPs. No significant interaction was observed.
In an attempt to analyze our data in the manner of previous reports, we removed from analysis individuals who, on the Quick Inventory of Depressive Symptomatology–Self Report, had a 41%–49% reduction in scores from baseline to the last visit or a final score between 6 and 9 for our response and remission phenotypes, respectively. This removed subjects whose response phenotypes may have been equivocal. The odds ratios remained constant, and, as such, provide further support for our findings.
We detected several SNPs to have statistically significant race interaction terms (see Table 8 in the online data supplement). Moreover, many of these SNPs showed association with the analyzed phenotypes when tested using principal components analysis-corrected models. Therefore, it is important to note that the association was potentially driven by a subset of the tested sample. These results are reported in Table 9 of the online data supplement, in which all SNPs listed in Table 1 of this article are further detailed for race interaction term as well as p values for principal components and race-stratified analyses. These results are further dissected in Tables 2–4 of the online data supplement, which report all of the p values for principal components analysis-corrected models as well as the findings when each ethnicity was tested separately. These data allow for a more complete understanding of the association values, specifically the subsample that was potentially driving the signal detected in the principal components analysis-corrected model.
Our p value threshold was determined using SNP spectral decomposition, which estimates the number of collinear tests actually being performed. Thus, our initial analyses for 48 SNPs decreased to 23.4 tests and resulted in a Bonferroni-corrected p value of 0.0007. This was a conservative correction for the three phenotypes as a result of the nested nature of these phenotypes; namely, that the specific response and remission groups were subsamples of the responder group.
This genetic association with the specific response phenotype might suggest a likely association with the pharmacologic action of citalopram. However, an alternative possibility is that this association actually represents an association with placebo response or the nonspecific response that can occur even with an active antidepressant medication. This possibility should be addressed in studies of OPRM1 variation in placebo-controlled trials. Previous studies showing that placebo-induced analgesia is associated with activation of the endogenous opioid system might suggest the latter interpretation (28). Although our study did not include subjects taking placebo, we observed that the strongest association findings were in the specific response phenotype, which was based on attempts to clinically differentiate placebo responders from drug responders.
The STAR*D trial was a large clinical trial designed to assess the clinical utility and effectiveness of antidepressant response with different treatment alternatives for major depressive disorder. Although it has proven useful for obtaining large numbers of subjects with the same clinical disorder and treated with the same medication (in level 1), it was not well designed to control for all possible confounding factors in genetic studies.
In addition to the lack of a placebo, there are several limitations to our study design, which have been discussed previously (20). First, there was a lack of information about other medications the participants were taking aside from citalopram. It is possible that responders were augmenting with an unknown medication and artificially inflating the response rate, thus masking the true effects of citalopram response, or that nonresponders were taking concomitant medications and experiencing drug-drug interactions, leading to presumed intolerance to citalopram. It is also possible that subjects were taking μ-opioid receptor agonists or antagonists, which may have interfered with the genotype-driven effect that we observed. We were able to assess concomitant narcotic usage and provide evidence that the SNPs associated with antidepressant response were not confounded by concomitant narcotic usage. Although this does not rule out other possible concomitant medications influencing the response rates, it does reflect the drugs most likely to play a role with the μ-opioid receptor (i.e., narcotics). Second, there was incomplete data on adherence to citalopram treatment in level 1 of the STAR*D study. Adherence was only estimated by the treating clinician for participants who exited the study at level 1 (N=208) and was not measured in those participants who entered follow-up evaluation or the next level of the trial. Thus, we cannot be sure that the nonresponders took their medication as diligently as the responders, thereby artificially inflating the response rate for the responders.
Third, DNA samples were not a requirement. DNA collection began well into the STAR*D trial, but not all participants agreed to provide blood samples. The key differences between the study participants who did and did not provide blood samples have been previously described (18) and include ethnicity, marital status, age, education level, primary versus specialty care, recurrent major depressive disorder, and number and length of major depressive episodes. Although these differences exist, the role they play in contributing to differential response rates is unclear. However, it is notable that we may not be able to generalize our findings to the entire STAR*D study population.
Fourth, medication dosage in the STAR*D study population was designed to model what would typically be prescribed in a clinician's office, and thus there was not a fixed dosage for all study participants. However, the variability in dosage did not have an effect on response rates, since the responders and nonresponders were receiving 30.42 mg and 29.88 mg of citalopram, respectively, at their final visit.
Another limitation is that drug intolerance was a potential confound for our response phenotypes. We found that 97% of responders were tolerant to citalopram, while only 80% of nonresponders were tolerant to the drug (p<0.0001). Similar findings were observed for the specific response and remission phenotypes. It is possible, then, that the observed genetic associations were actually with a tolerance phenotype, which itself may have determined the response phenotype. However, we do not believe this is the case, since none of the SNPs were associated with a tolerance phenotype.
Although the STAR*D study was designed to assess clinical effectiveness of medications, we cannot suggest that our data contain useful information for driving clinical decision making as of yet because of our lack of replication, assessment of only one antidepressant (citalopram), and modest size of association. These data do provide insights into mechanisms of antidepressant response and pave new roads for investigations of pharmacotherapy.
In summary, we reported significant findings for association between variants in the OPRM1 region and antidepressant response and remission from major depressive disorder. The most significantly associated SNP was in an exon of an alternatively spliced isoform of OPRM1, which we showed to be present and functional at the plasma membrane. These data suggest that response to citalopram therapy is influenced by the OPRM1 gene and endogenous opioidergic neurotransmission may be involved in major depressive disorder and its response to antidepressant pharmacotherapy.
1 : Evaluation of outcomes with citalopram for depression using measurement-based care in STAR*D: implications for clinical practice. Am J Psychiatry 2006; 163:28–40 Link, Google Scholar
2 : Variation in the gene encoding the serotonin 2A receptor is associated with outcome of antidepressant treatment. Am J Hum Genet 2006; 78:804–814 Crossref, Medline, Google Scholar
3 : Association of GRIK4 with outcome of antidepressant treatment in the STAR*D cohort. Am J Psychiatry 2007; 164:1181–1188 Link, Google Scholar
4 : Identification and characterization of two new human mu opioid receptor splice variants, hMOR-1O and hMOR-1X. Biochem Biophys Res Commun 2003; 301:1057–1061 Crossref, Medline, Google Scholar
5 : Identification and characterization of three new alternatively spliced mu-opioid receptor isoforms. Mol Pharmacol 1999; 56:396–403 Crossref, Medline, Google Scholar
6 : Diversity and complexity of the mu opioid receptor gene: alternative pre-mRNA splicing and promoters. DNA Cell Biol 2005; 24:736–750 Crossref, Medline, Google Scholar
7 : Identification of three mouse mu-opioid receptor (MOR) gene (Oprm1) splice variants containing a newly identified alternatively spliced exon. Gene 2007; 388:135–147 Crossref, Medline, Google Scholar
8 : Characterization of the 3′ untranslated region of the human mu-opioid receptor (MOR-1) mRNA. Gene 2005; 364:139–145 Crossref, Medline, Google Scholar
9 : Identification and characterization of six new alternatively spliced variants of the human mu opioid receptor gene, Oprm. Neuroscience 2005; 133:209–220 Crossref, Medline, Google Scholar
10 : Sequence variability and candidate gene analysis in complex disease: association of mu opioid receptor gene variation with substance dependence. Hum Mol Genet 2000; 9:2895–2908 Crossref, Medline, Google Scholar
11 : Single-nucleotide polymorphism in the human mu opioid receptor gene alters beta-endorphin binding and activity: possible implications for opiate addiction. Proc Natl Acad Sci U S A 1998; 95:9608–9613 Crossref, Medline, Google Scholar
12 : Allelic expression imbalance of human mu opioid receptor (OPRM1) caused by variant A118G. J Biol Chem 2005; 280:32618–32624 Crossref, Medline, Google Scholar
13 : Dysregulation of endogenous opioid emotion regulation circuitry in major depression in women. Arch Gen Psychiatry 2006; 63:1199–1208 Crossref, Medline, Google Scholar
14 : Effects of chronic desipramine treatment on alpha2-adrenoceptors and mu-opioid receptors in the guinea pig cortex and hippocampus. Eur J Pharmacol 2008; 579:116–125 Crossref, Medline, Google Scholar
15 : Chronic antidepressant treatment causes a selective reduction of mu-opioid receptor binding and functional coupling to G proteins in the amygdala of fawn-hooded rats. J Pharmacol Exp Ther 2004; 310:1020–1026 Crossref, Medline, Google Scholar
16 : Pharmacogenetics of major depression: insights from level 1 of the Sequenced Treatment Alternatives to Relieve Depression (STAR*D) trial. Mol Diagn Ther 2008; 12:321–330 Crossref, Medline, Google Scholar
17 : Pharmacogenomics with antidepressants in the STAR*D study. Pharmacogenomics 2008; 9:935–946 Crossref, Medline, Google Scholar
18 : Analysis of association between the serotonin transporter and antidepressant response in a large clinical sample. Biol Psychiatry 2007; 61:734–742 Crossref, Medline, Google Scholar
19 : An evaluation of the Quick Inventory of Depressive Symptomatology and the Hamilton Rating Scale for Depression: a Sequenced Treatment Alternatives to Relieve Depression trial report. Biol Psychiatry 2006; 59:493–501 Crossref, Medline, Google Scholar
20 : Pharmacokinetic genes do not influence response or tolerance to citalopram in the STAR*D sample. PLoS One 2008; 3:e1872 Crossref, Medline, Google Scholar
21 : Trend tests for case-control studies of genetic markers: power, sample size and robustness. Hum Hered 2002; 53:146–152 Crossref, Medline, Google Scholar
22 : Principal components analysis corrects for stratification in genome-wide association studies. Nat Genet 2006; 38:904–909 Crossref, Medline, Google Scholar
23 : A simple correction for multiple testing for single-nucleotide polymorphisms in linkage disequilibrium with each other. Am J Hum Genet 2004; 74:765–769 Crossref, Medline, Google Scholar
24 : Functional coupling, desensitization and internalization of virally expressed mu opioid receptors in cultured dorsal root ganglion neurons from mu opioid receptor knockout mice. Neuroscience 2004; 123:111–121 Crossref, Medline, Google Scholar
25 : Morphine activates opioid receptors without causing their rapid internalization. J Biol Chem 1996; 271:19021–19024 Crossref, Medline, Google Scholar
26 : A genomewide association study of citalopram response in major depressive disorder. Biol Psychiatry 2010; 67:133–138 Crossref, Medline, Google Scholar
27 : Resequencing of serotonin-related genes and association of tagging SNPs to citalopram response. Pharmacogenet Genomics 2009; 19:1–10 Crossref, Medline, Google Scholar
28 : Placebo effects mediated by endogenous opioid activity on mu-opioid receptors. J Neurosci 2005; 25:7754–7762 Crossref, Medline, Google Scholar