White Matter Abnormalities in Patients With Obsessive-Compulsive Disorder and Their First-Degree Relatives
Abstract
Objective: Obsessive-compulsive disorder (OCD) is a common, heritable neuropsychiatric disorder, hypothetically underpinned by dysconnectivity of large-scale brain systems. The extent of white matter abnormalities in OCD is unknown, and the genetic basis of this disorder is poorly understood. The authors used diffusion tensor imaging, a magnetic resonance imaging technique, for examining white matter abnormalities in brain structure through quantification of water diffusion, to confirm whether white matter abnormalities exist in OCD. They also explored whether such abnormalities occur in healthy first-degree relatives of patients, indicating they may be endophenotypes representing increased genetic risk for OCD. Method: The authors used diffusion tensor imaging to measure fractional anisotropy of white matter in 30 patients with OCD, 30 unaffected first-degree relatives, and 30 matched healthy comparison subjects. Regions of significantly abnormal fractional anisotropy in patients in relation to healthy comparison subjects were identified by permutation tests. The authors assessed whether these abnormalities were also evident in the first-degree relatives. A secondary region-of-interest analysis was undertaken to assess the extent of replication between our data and previous relevant literature. Results: Patients with OCD demonstrated significantly reduced fractional anisotropy in a large region of right inferior parietal white matter and significantly increased fractional anisotropy in a right medial frontal region. Relatives also exhibited significant abnormalities of fractional anisotropy in these regions. Conclusions: These findings indicate that OCD is associated with white matter abnormalities in parietal and frontal regions. Similar abnormalities in unaffected first-degree relatives suggest these may be white matter endophenotypes for OCD.
Obsessive-compulsive disorder (OCD) is a chronically debilitating neuropsychiatric disorder with 2%–3% population prevalence (1) . It comprises two symptom dimensions: obsessions , intrusive, recurrent thoughts often concerned with contamination and checking; and compulsions , repetitive behaviors performed in relation to obsessions, e.g., persistent hand washing. Symptoms are associated with considerable anxiety and socio-occupational dysfunction. There is evidence for the heritability of OCD from twin studies (2) , and OCD is approximately five times more frequent in first-degree relatives of patients compared with unrelated comparison subjects (3 , 4) . However, the genetic basis of OCD is complex, polygenic, and not well understood in terms of specific genes.
Hence, suggestions for further research have included relative-proband paired experimental designs, aiming to elucidate similarities between OCD patients and their unaffected first-degree relatives (asymptomatic individuals with an increased genetic risk of OCD) (5) . The rationale for this strategy involves endophenotypes (intermediate phenotypes) (6) . These are heritable, quantitative traits associated with genetic risk for a disorder, i.e., they have abnormal values compared to the general population both in probands and their relatives. They are biologically tractable and hypothetically more proximal to genetic effects than clinical phenotypes and so may facilitate identification of specific genes predisposing to a disorder. For example, both OCD patients and their first-degree relatives show similar cognitive impairments on some executive tasks (7) . Cognitive abnormalities in response inhibition in OCD patients and their first-degree relatives are also associated with familial gray matter differences occurring in both patients and relatives (8) . Thus, there is evidence for cognitive and gray matter endophenotypes in OCD, but white matter endophenotypes have not been investigated. Neuroimaging measurements have particular potential as endophenotypes since healthy twin studies show that brain structure is highly heritable (9) .
Theoretical models of OCD, based on neuroimaging and primate studies defining frontal-striatal neural circuits (10) , suggest that pathophysiology lies within orbitofrontal-striatal circuits (5 , 11) . Structural magnetic resonance imaging (MRI) studies have mainly employed conventional case-control region-of-interest protocols to test this hypothesis. Despite study-to-study variation in anatomical landmarks used to define regions and the small group sizes typically employed, several studies have reported reduced orbitofrontal volume in OCD patients (12 – 14) . Although striatal volumetric changes are less consistent (15) , several studies have shown structural abnormalities (16 , 17) . Studies employing whole-brain mapping techniques, e.g., voxel-based morphometry (18 – 21) , provide support for this orbitofrontal-striatal model but, together with neuropsychological and functional neuroimaging findings, also indicate that OCD pathology involves regions outside these classically implicated circuits (22) . For example, parietal regions, including the angular and supramarginal gyri, have been reported as structurally abnormal in OCD (8 , 18 , 20) and functionally abnormal in positron emission tomography (PET) studies (23 – 25) , single photon emission computed tomography (SPECT) studies (26) , and functional MRI studies (27) .
Diffusion tensor imaging permits investigation of brain tissue microstructure, through quantification of water diffusion (28) . Water diffusion depends upon properties of the medium in which it occurs, so diffusion measurements in biological tissues are related to tissue architecture, e.g., cell walls, membranes, and particularly myelin (with its tightly packed concentric structure) restrict diffusion. Isotropy describes equal diffusivity in all directions, e.g., in CSF, where no cellular structures limit diffusion. Diffusion within gray matter is close to isotropic because structures reducing diffusivity occur with roughly equal prevalence in all directions. Conversely, in structures with a highly regularized directional organization, e.g., white matter tracts, diffusion is more anisotropic; the predominant direction is parallel to fiber direction, and diffusion is reduced perpendicularly.
Diffusion can be characterized by a second-order tensor: isotropic diffusion is represented by a spherical tensor, anisotropic diffusion by an ellipsoid (29) . Fractional anisotropy describes the nonsphericity of the tensor (30) . High fractional anisotropy indicates a nonspherical tensor with preferential orientation in a particular direction, such as within white matter tracts. Reduced fractional anisotropy, indicating more isotropic diffusion, has been found to be characteristic of damaged or disorganized white matter (31) .
Diffusion tensor imaging studies of OCD are few to date. Szeszko et al. (32) reported reduced fractional anisotropy in the cingulate, bilateral parietal, and left occipital areas. Cannistraro et al. (33) found increased fractional anisotropy in the left cingulate bundle and internal capsule and reduced fractional anisotropy in the right cingulate bundle. Findings from these studies warrant replication owing to small group sizes (N=8–15) and the risk of false positive error in the context of the multiple comparisons entailed by whole-brain computational morphometry.
We performed diffusion tensor imaging in OCD patients, their unaffected first-degree relatives, and unrelated healthy comparison subjects to investigate two key hypotheses: primarily to confirm whether white matter abnormalities occur in patients and secondarily to assess whether such abnormalities also exist in first-degree relatives, indicating they are markers of increased genetic risk for OCD. We hypothesized that there would be white matter abnormalities in patients, especially in previously identified areas, e.g., white matter adjacent to the anterior cingulate or parietal cortex, and, given the heritability of OCD and brain structure, these abnormalities would likely also be present in healthy first-degree relatives.
Method
Participants
The study group comprised 30 OCD patients, 30 unaffected first-degree relatives, and 30 comparison subjects, including 29 proband-relative pairs. The patients were recruited by a consultant psychiatrist (N.F.) from an outpatient service and fulfilled DSM-IV criteria for a diagnosis of OCD (American Psychiatric Association, 1994). A clinical screening process was employed to minimize comorbidity and symptom heterogeneity in patients, since varying symptom profiles in subgroups of OCD patients may have different underlying neural correlates (27 , 34) . Patients with washing or checking symptoms, without hoarding or motor tics, were selected by clinical interview with the Yale-Brown Obsessive Compulsive Scale symptom checklist (35) , a well-validated screening instrument.
The patients gave consent for a first-degree relative to be contacted (preferably a similarly aged sibling, alternatively a child or parent: 20 relatives were siblings, eight were parents, and two were children). The comparison subjects were recruited by local community advertisements. After a complete description of the study, written informed consent was obtained from all participants. The study was approved by the Local Research Ethics Committee (Addenbrooke’s Hospital, Cambridge, U.K.).
During a clinical interview, the participants were assessed with the Mini-International Neuropsychiatric Interview (36) , a well-validated instrument to screen for axis I psychiatric disorders, the Montgomery-Åsberg Depression Rating Scale (MADRS) (37) , an established measure of mood status, and the Yale-Brown Obsessive Compulsive Scale (35) , an OCD symptom severity scale. Additionally, the subjects completed the Obsessive-Compulsive Inventory (Revised) (38) , a validated self-report measure assessing OCD symptoms. Verbal IQ estimates were obtained with the National Adult Reading Test (39) .
The participants were excluded if they had a history of serious head injury, substance abuse, or epilepsy or contraindications to MRI. Additionally, all participants were free from DSM-IV axis I disorders (including major depressive disorder and Tourette’s syndrome), with the exception of OCD itself in probands and two probands having an additional diagnosis of panic disorder. The patients were medicated as follows: seven were unmedicated, 21 were prescribed selective serotonin reuptake inhibitors, one clomipramine, and one quetiapine. Relatives and healthy volunteers were not taking psychotropic medication.
Demographic and clinical data were analyzed for group differences using one-way analysis of variance (ANOVA) and post hoc least significant difference tests. Gender and handedness ratios for each group were analyzed with chi-square and Fisher’s exact tests, respectively. Conventional MRI data from this group were reported previously for 93 individuals (31 per group) (8) . Here we report data from 90 of these individuals; diffusion tensor imaging data from three participants were not analyzed owing to scanning difficulties.
MRI Acquisition
MRI was conducted with a 1.5 T GE Signa system (General Electric, Milwaukee) at the MRIS Unit, Addenbrooke’s Hospital, Cambridge, U.K. Diffusion-weighted imaging data were acquired (25 directions) with the following parameters: slice thickness=4 mm, TR=12 seconds, TE=93 msec, matrix size=128×128, field of view=30×24 cm, B value 1000 seconds/mm 2 . One volume without diffusion-weighting (b=0) was also acquired. To provide a high-resolution anatomical reference for normalization, axial three-dimensional T 1 -weighted images were obtained with a spoiled gradient recall sequence with the following parameters: slice thickness=2 mm, TR=33 msec, TE=3 msec, field of view=24 cm, flip angle=40°, matrix size=256×256 (total scan time ∼40 minutes).
MRI Data Analysis
Diffusion tensor images were preprocessed with previously published methods, as follows. Brain tissue was extracted from the scans with the brain extraction tool in FSL (http://www. fmrib.ox.ac.uk/fsl) (40) . The diffusion tensor at each voxel was calculated using the FMRIB diffusion toolbox in FSL. The resulting fractional anisotropy images were transformed into Montreal Neurological Institute standard space with Statistical Parametric Mapping 5 (http://www.fil.ion.ucl.ac.uk.spm) (Wellcome Department of Imaging Neuroscience, London) by means of the following steps: the b=0 images were coregistered with the structural T 1 image for that individual, the same coregistration parameters were applied to the fractional anisotropy maps (in the same space as the b=0 images), each individual’s T 1 image was then normalized to the SPM T 1 template (in Montreal Neurological Institute standard space), and the same normalization parameters were then applied to the coregistered fractional anistropy images. Finally, fractional anisotropy images were smoothed with an 8-mm full-width at half-maximum Gaussian kernel. A white matter mask was used to restrict the search volume for analysis to mitigate multiple comparisons corrections. This white matter mask was defined by binarising the Statistical Parametric Mapping a priori white matter template to a binary mask, i.e., thresholding each voxel at 50% white matter to define white matter regions for analysis.
Case-control between-group tests were performed on diffusion tensor images of fractional anisotropy with permutation tests implemented in camBA software (Cambridge Brain Analysis v1.3.2); (http://www-bmu.psychiatry.cam.ac.uk/software). To assess our primary hypothesis of white matter abnormalities in OCD patients in relation to healthy comparison subjects, differences between patients and comparison subjects were estimated by fitting an analysis of variance (ANOVA) model at each voxel in standard space within the white matter mask. The null hypothesis of no difference in fractional anisotropy between patients and comparison subjects (N=30 per group) was tested with permutation at the level of three-dimensional, spatially contiguous voxel clusters, as described in detail elsewhere (41 , 42) . For each between-group comparison, we used probability thresholds for cluster-level testing (p<0.017), adjusted such that the average number of false positive tests was <1. Peak coordinates of clusters are reported in Montreal Neurological Institute Standard space.
To explore these fractional anisotropy abnormalities in patients and to assess our secondary hypothesis that unaffected first-degree relatives would also demonstrate significant abnormalities in these regions, we extracted the regional mean fractional anisotropy within each cluster of significant case-control difference for each individual. These data were analyzed with one-way ANOVA and post hoc least significant difference tests in SPSS for Windows V11 (SPSS, Chicago). We also tested whether symptom severity scores (Yale-Brown Obsessive Compulsive Scale, Obsessive Compulsive Inventory [Revised], MADRS) and age were correlated with fractional anisotropy and used one-way ANOVA to assess whether total gray matter, white matter, and CSF differed between groups.
Finally, a region-of-interest technique was used to explore our findings in the context of a previous whole-brain diffusion tensor imaging study of OCD that provided anatomical coordinates for abnormal fractional anisotropy regions (32) . SPM5 software was used to define spherical regions of interest (radius 15 mm) around previously reported peak coordinates (data supplement Table 1 , available at http://ajp.psychiatryonline.org) and to assess whether each of these regions defined a set of voxels (also lying within white matter, as defined by the white matter mask) in which fractional anisotropy was significantly abnormal between patients and comparison subjects in the present study. Tests for a regional difference in mean fractional anisotropy at each of the regions of interest defined by the prior literature were tested for significance with False Discovery Rate (FDR)=5%.
Although not the main focus of this study, it is interesting to consider on a whole-brain basis how first-degree relatives might differ from patients and unrelated comparison subjects to further explore state- and trait-based white matter changes in OCD. These additional analyses are reported in the data supplement.
Results
Demographic Data
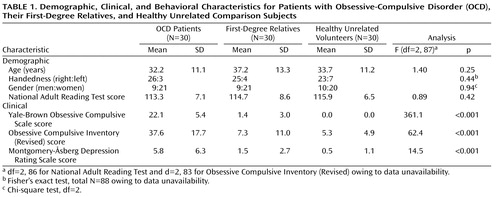
The three groups were well-matched for age, verbal IQ, gender, and handedness ( Table 1 ). As expected, there was a significant main effect of group for both measures of obsessive-compulsive symptom severity (Yale-Brown Obsessive-Compulsive Disorder Scale, Obsessive Compulsive Inventory [Revised]). Post hoc least significant difference tests confirmed that patients scored higher on both measures than either comparison subjects (Yale-Brown Obsessive-Compulsive Disorder Scale: df=58, p<0.001, Obsessive Compulsive Inventory [Revised]: df=55, p<0.001) or relatives (Yale-Brown Obsessive-Compulsive Disorder Scale: df=58, p<0.001, Obsessive Compulsive Inventory [Revised]: df=54, p<0.001); relatives did not differ from comparison subjects (Yale-Brown Obsessive-Compulsive Disorder Scale: df=58, p=0.12, Obsessive Compulsive Inventory [Revised]: df=57, p=0.53). Although mean symptom scores on the MADRS were well below the level required for a diagnosis of depression in all three groups, patients had higher scores than relatives and healthy volunteers according to least significant difference tests—patients versus comparison subjects (df=58, p<0.001), patients versus relatives (df=58, p<0.001).
Diffusion Tensor Imaging of OCD Patients
Analysis of white matter anisotropy revealed a right parietal region of reduced fractional anisotropy in patients in relation to comparison subjects (Montreal Neurological Institute coordinates: 32, –36, 30; cluster size=574 voxels) and a right medial frontal region of increased fractional anisotropy in patients (Montreal Neurological Institute coordinates: 22, 20, 44; cluster size=117 voxels) ( Figure 1 ).

a R indicates the right side of the brain, numbers denote z value for each axial slice, white areas on brain slices illustrate regions of white matter as defined by the white matter mask.
b p<0.017 for clusters (set automatically to ensure <1 false positive cluster per map).
Diffusion Tensor Imaging of First-Degree Relatives
One-way ANOVA showed a significant group effect on fractional anisotropy in both regions, with patients and relatives both demonstrating significantly reduced fractional anisotropy in relation to comparison subjects in the right parietal area and significantly increased fractional anisotropy in the right frontal area ( Figure 2 ). Although relatives tended to show fractional anisotropy values intermediate between comparison subjects and patients, they were more similar to patients ( Table 2 ) and fractional anisotropy values for the two clusters were not significantly different between patients and relatives.
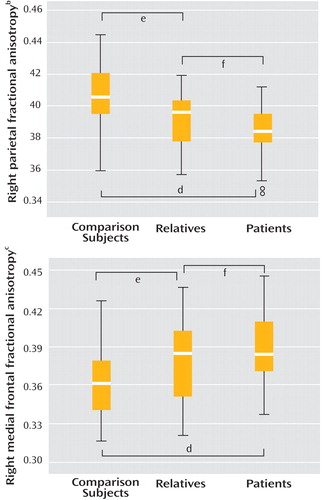
a Thick bar indicates median; box and whiskers represent interquartile range and range, respectively.
b One-way analysis of variance (ANOVA) main effect of group (F=11.4, df=2, 87, p<0.001).
c One-way ANOVA main effect of group (F=8.09, df=2, 87, p=0.001).
d Post hoc least significant difference comparison subjects versus OCD patients (p<0.001).
e Post hoc least significant difference comparison subjects versus first-degree relatives of OCD patients (p<0.01).
f Post hoc least significant difference OCD patients versus first-degree relatives (p>0.05).

Mean regional fractional anisotropy in the medial frontal and parietal cortex was significantly correlated between regions for the patients (r=0.36, N=30, p<0.05) but not the relatives or comparison subjects (p>0.05), suggesting there may be a pathophysiologic relationship between white matter changes in these two regions in OCD patients. There was no significant correlation between abnormal fractional anisotropy findings and symptom severity scores (Yale-Brown Obsessive-Compulsive Scale, Obsessive Compulsive Inventory [Revised], MADRS) in patients or relatives (p>0.05). It is unlikely that age could account for abnormal fractional anisotropy findings since there was no evidence of any correlation between age and fractional anisotropy (parietal: r=–0.04, N=90, p=0.75; frontal: r=–0.03, N=90, p=0.79).
Diffusion Tensor Imaging Data and Region-of-Interest Analysis
Using a region-of-interest approach to examine the extent of replication between our study and previous work (32) , we identified an area in our data with significantly reduced fractional anisotropy in patients in relation to comparison subjects (Montreal Neurological Institute coordinates: 30, –44, 32; t=4.32, FDR-corrected p<0.02) lying close to a peak coordinate identified previously (Talairach coordinates: 37, –52, 35) in the right parietal lobe (32) . Assessment of the same region of interest in relatives versus comparison subjects also revealed reduced fractional anisotropy in relatives (Montreal Neurological Institute coordinates: 32, –34, 30; t=3.37); however, this did not withstand correction for multiple comparisons (FDR-corrected p=0.14). Analysis of our data in relation to the other previously identified regions, e.g., the anterior cingulate (data supplement Table 1), did not provide evidence for significant case-control (or relative-control) differences.
Discussion
The key hypotheses of this study were substantiated: first, abnormal white matter anisotropy was identified in OCD patients in right parietal and medial frontal areas, providing evidence for white matter abnormalities in OCD; second, these white matter abnormalities were also evident in healthy first-degree relatives of patients, suggesting they are endophenotypes, representing genetic risk for OCD. Using a region-of-interest strategy, we also compared our findings with previous literature, demonstrating that reduced fractional anisotropy in the right parietal white matter in OCD represents a replication and an important extension of previous findings (32) .
Parietal Abnormalities in OCD
Traditionally, OCD is theoretically associated with abnormalities in orbitofronto-striatal circuits (11) . However, recent evidence from computational morphometry studies of whole-brain MRI data not requiring a priori specification of regions of interest has suggested there are structural abnormalities within other, widely distributed large-scale systems, including parietal and medial frontal regions (8 , 21) . Additionally, formal meta-analysis of functional MRI studies of OCD indicates abnormalities in large-scale networks, again including parietal and medial frontal regions (22) . Our findings of white matter abnormalities located close to regions previously identified as structurally and functionally abnormal in OCD are intriguing and support the existence of systems-level pathology in this disorder.
Our replication of a previous finding of reduced fractional anisotropy in right parietal white matter in a larger group is also noteworthy, providing further support from diffusion tensor imaging that regions outside the orbitofrontal-striatal model are abnormal in OCD. There is considerable evidence from neuroimaging studies for parietal dysfunction in OCD (22) . For example, positron emission tomography studies of OCD have reported that, in addition to occipital frontal cortex abnormalities, reduced glucose metabolism was evident in bilateral parietal lobes (23) , that regional cerebral blood flow (rCBF) at the right temporal-parietal junction and at the left supramarginal gyrus was negatively correlated with symptom intensity (24) , and that rCBF was abnormal in several regions outside the orbitofrontal-striatal circuit, including the angular gyrus (25) . Single photon emission computed tomography and functional magnetic resonance imaging studies also indicate parietal abnormalities and abnormal activation in OCD (26 , 27) . Additionally, whole-brain structural MRI studies have reported parietal gray matter abnormalities in OCD (18 , 20) ; parietal abnormalities are also evident in healthy first-degree relatives of OCD patients and associated with cognitive deficits in response inhibition (8) . An event-related potential study recently revealed enhanced amplitude of the P600 at the right temporal-parietal area and prolonged latencies at the right parietal region in OCD patients in relation to healthy comparison subjects (43) . Finally, a recent magnetic resonance spectroscopy study (44) described concentration changes of choline-containing compounds in parietal white matter but not elsewhere in the brains of OCD patients. These were correlated with OCD symptom severity and suggest phospholipid abnormalities of myelinated axons in this region (44) .
In short, there is considerable evidence for dysfunction within large-scale neural systems, including parietal areas in OCD, in addition to frontal-striatal regions more traditionally associated with the disorder. Evidence from diffusion tensor imaging studies showing parietal white matter abnormalities is compatible with these data and supportive of dysconnectivity within these systems. Additionally, cognitive studies indicate that OCD patients are impaired on visuospatial tasks that are thought to particularly involve the parietal cortex (45 , 46) .
Frontal White Matter
We did not replicate previous findings of reduced fractional anisotropy in the anterior cingulate (32 , 33) . However, we did identify a right medial frontal region of increased fractional anisotropy in OCD patients and relatives, situated more supero-laterally to previous findings. Possible explanations for this lack of replication may involve study design and methodological limitations, e.g., some studies were based on small samples (eight to 15 patients), including medicated patients with comorbidities. Furthermore, some studies have been reported at significance levels not fully accounting for multiple comparisons. With the massive univariate testing entailed by whole-brain imaging analysis, it is conceivable that some findings may be attributable to false positives (type I error). Additionally, limitations inherent in voxel-based techniques may account for variation between studies. The finding of increased right medial frontal fractional anisotropy in patients and relatives could be interpreted in terms of increases in myelination or increased numbers of fibers in this region (31) , potentially caused by differences during brain structure development in individuals at increased risk of OCD.
White Matter in First-Degree Relatives
The abnormal fractional anisotropy findings in OCD patients were also evident in their unaffected first-degree relatives. The endophenotype hypothesis, conceptualized over 30 years ago, defines endophenotypes as “measurable components, unseen by the unaided eye on the pathway between disease (phenotype) and distal genotype” (6) . Interest in endophenotypes has experienced recent revival, because, despite the heritability of most psychiatric disorders, years of intense efforts to discover specific causative genes have generally delivered disappointing results. Identification of endophenotypes may facilitate understanding of predisposing genes for OCD. A key criterion for identification of endophenotypes, which we have observed, is their presence in both patients and their clinically unaffected relatives at a higher rate than in the general population.
Previous studies have provided evidence for endophenotypes of OCD, including both objective cognitive measures (7) and patterns of gray matter structural abnormalities (8) . These brain structural patterns included gray matter in regions outside of the classical orbitofrontal-striatal circuit, including parietal and medial frontal regions, compatible with our findings that white matter in these regions is also abnormal. Together with this study, evidence is accumulating that there are several endophenotypes for OCD, each of which may be differentially contributed to by particular genes involved in OCD. Future work is required to further test this hypothesis and identify genes underpinning these markers of genetic risk. It is also interesting to consider the differences in fractional anisotropy that may occur between patients and first-degree relatives since these could indicate differences between state- and trait-based findings. For example, in the data supplement, we identify anisotropy differences between patients and relatives that could represent markers of disease-state and differences between relatives and unrelated comparison subjects that could represent additional trait-based findings in healthy individuals with an increased genetic risk of OCD.
Methodological Considerations
To our knowledge, this is the largest diffusion tensor imaging study of OCD to date and the first to analyze data from unaffected first-degree relatives. The study used well-matched groups and careful screening to minimize subject comorbidity and replicated some previous findings. Most patients in this study were medicated, which could affect brain structure; however, the finding that (unmedicated) relatives also displayed similar brain abnormalities helps discount this argument. Study limitations are perhaps most importantly related to methodological aspects of voxel-based analysis. For example, potential confounds may occur because of white matter tract misalignment in nonhomologous brains (47) and the use of different smoothing kernel sizes (48) . Future methodological work on diffusion tensor imaging analysis may help to resolve these issues.
Conclusions
Using diffusion tensor imaging, we identified abnormalities in OCD patients in right parietal and medial frontal white matter. For the first time, we also report that these white matter differences are evident in healthy first-degree relatives of OCD patients, suggesting that they are white matter endophenotypes representing markers of increased genetic risk for OCD.
1. Karno M, Golding JM, Sorenson SB, Burnam MA: The epidemiology of obsessive-compulsive disorder in five US communities. Arch Gen Psychiatry 1988; 45:1094–1099Google Scholar
2. Carey G, Gottesman II: Twin and family studies of anxiety, phobic and obsessive disorders, in Anxiety, New Research, and Changing Concepts. Edited by Klein D, Radkin J. New York, Raven Press, 1981, p 117–136Google Scholar
3. Nestadt G, Samuels J, Riddle M, Bienvenu OJ III, Liang KY, LaBuda M, Walkup J, Grados M, Hoehn-Saric R: A family study of obsessive-compulsive disorder. Arch Gen Psychiatry 2000; 57:358–363Google Scholar
4. Pauls DL, Alsobrook JP II, Goodman W, Rasmussen S, Leckman JF: A family study of obsessive-compulsive disorder. Am J Psychiatry 1995; 152:76–84Google Scholar
5. Chamberlain SR, Blackwell AD, Fineberg NA, Robbins TW, Sahakian BJ: The neuropsychology of obsessive compulsive disorder: the importance of failures in cognitive and behavioural inhibition as candidate endophenotypic markers. Neurosci Biobehav Rev 2005; 29:399–419Google Scholar
6. Gottesman II, Gould TD: The endophenotype concept in psychiatry: etymology and strategic intentions. Am J Psychiatry 2003; 160:636–645Google Scholar
7. Chamberlain SR, Fineberg NA, Menzies LA, Blackwell AD, Bullmore ET, Robbins TW, Sahakian BJ: Impaired cognitive flexibility and motor inhibition in unaffected first-degree relatives of patients with obsessive-compulsive disorder. Am J Psychiatry 2007; 164:335–338Google Scholar
8. Menzies L, Achard S, Chamberlain SR, Fineberg N, Chen CH, del Campo N, Sahakian BJ, Robbins TW, Bullmore E: Neurocognitive endophenotypes of obsessive-compulsive disorder. Brain 2007; 130(part 12):3223–3336Google Scholar
9. Wright IC, Sham P, Murray RM, Weinberger DR, Bullmore ET: Genetic contributions to regional variability in human brain structure: methods and preliminary results. Neuroimage 2002; 17:256–271Google Scholar
10. Alexander GE, DeLong MR, Strick PL: Parallel organization of functionally segregated circuits linking basal ganglia and cortex. Annu Rev Neurosci 1986; 9:357–381Google Scholar
11. Graybiel AM, Rauch SL: Toward a neurobiology of obsessive-compulsive disorder. Neuron 2000; 28:343–347Google Scholar
12. Szeszko PR, Robinson D, Alvir JM, Bilder RM, Lencz T, Ashtari M, Wu H, Bogerts B: Orbital frontal and amygdala volume reductions in obsessive-compulsive disorder. Arch Gen Psychiatry 1999; 56:913–919Google Scholar
13. Kang DH, Kim JJ, Choi JS, Kim YI, Kim CW, Youn T, Han MH, Chang KH, Kwon JS: Volumetric investigation of the frontal-subcortical circuitry in patients with obsessive-compulsive disorder. J Neuropsychiatry Clin Neurosci 2004; 16:342–349Google Scholar
14. Atmaca M, Yildirim H, Ozdemir H, Tezcan E, Poyraz AK: Volumetric MRI study of key brain regions implicated in obsessive-compulsive disorder. Prog Neuropsychopharmacol Biol Psychiatry 2007; 31:46–52Google Scholar
15. Aylward EH, Harris GJ, Hoehn-Saric R, Barta PE, Machlin SR, Pearlson GD: Normal caudate nucleus in obsessive-compulsive disorder assessed by quantitative neuroimaging. Arch Gen Psychiatry 1996; 53:577–584Google Scholar
16. Robinson D, Wu H, Munne RA, Ashtari M, Alvir JM, Lerner G, Koreen A, Cole K, Bogerts B: Reduced caudate nucleus volume in obsessive-compulsive disorder. Arch Gen Psychiatry 1995; 52:393–398Google Scholar
17. Rosenberg DR, Keshavan MS, O’Hearn KM, Dick EL, Bagwell WW, Seymour AB, Montrose DM, Pierri JN, Birmaher B: Frontostriatal measurement in treatment-naive children with obsessive-compulsive disorder. Arch Gen Psychiatry 1997; 54:824–830Google Scholar
18. Kim JJ, Lee MC, Kim J, Kim IY, Kim SI, Han MH, Chang KH, Kwon JS: Grey matter abnormalities in obsessive-compulsive disorder: statistical parametric mapping of segmented magnetic resonance images. Br J Psychiatry 2001; 179:330–334Google Scholar
19. Pujol J, Soriano-Mas C, Alonso P, Cardoner N, Menchon JM, Deus J, Vallejo J: Mapping structural brain alterations in obsessive-compulsive disorder. Arch Gen Psychiatry 2004; 61:720–730Google Scholar
20. Valente AA Jr, Miguel EC, Castro CC, Amaro E Jr, Duran FL, Buchpiguel CA, Chitnis X, McGuire PK, Busatto GF: Regional gray matter abnormalities in obsessive-compulsive disorder: a voxel-based morphometry study. Biol Psychiatry 2005; 58:479–487Google Scholar
21. Soriano-Mas C, Pujol J, Alonso P, Cardoner N, Menchon JM, Harrison BJ, Deus J, Vallejo J, Gaser C: Identifying patients with obsessive-compulsive disorder using whole-brain anatomy. Neuroimage 2007; 35:1028–1037Google Scholar
22. Menzies L, Chamberlain SR, Laird AR, Thelen SM, Sahakian BJ, Bullmore ET: Integrating the evidence from neuroimaging and neuropsychological studies of obsessive-compulsive disorder: the orbitofronto-striatal model revisited. Neurosci Biobehav Rev 2008; 32:525–549Google Scholar
23. Nordahl TE, Benkelfat C, Semple WE, Gross M, King AC, Cohen RM: Cerebral glucose metabolic rates in obsessive compulsive disorder. Neuropsychopharmacology 1989; 2:23–28Google Scholar
24. McGuire PK, Bench CJ, Frith CD, Marks IM, Frackowiak RS, Dolan RJ: Functional anatomy of obsessive-compulsive phenomena. Br J Psychiatry 1994; 164:459–468Google Scholar
25. Rauch SL, Jenike MA, Alpert NM, Baer L, Breiter HC, Savage CR, Fischman AJ: Regional cerebral blood flow measured during symptom provocation in obsessive-compulsive disorder using oxygen 15-labeled carbon dioxide and positron emission tomography. Arch Gen Psychiatry 1994; 51:62–70Google Scholar
26. Lucey JV, Costa DC, Blanes T, Busatto GF, Pilowsky LS, Takei N, Marks IM, Ell PJ, Kerwin RW: Regional cerebral blood flow in obsessive-compulsive disordered patients at rest: differential correlates with obsessive-compulsive and anxious-avoidant dimensions. Br J Psychiatry 1995; 167:629–634Google Scholar
27. Mataix-Cols D, Wooderson S, Lawrence N, Brammer MJ, Speckens A, Phillips ML: Distinct neural correlates of washing, checking, and hoarding symptom dimensions in obsessive-compulsive disorder. Arch Gen Psychiatry 2004; 61:564–576Google Scholar
28. Le Bihan D, Mangin JF, Poupon C, Clark CA, Pappata S, Molko N, Chabriat H: Diffusion tensor imaging: concepts and applications. J Magn Reson Imaging 2001; 13:534–546Google Scholar
29. Basser PJ, Mattiello J, Le Bihan D: Estimation of the effective self-diffusion tensor from the NMR spin echo. J Magn Reson B 1994; 103:247–254Google Scholar
30. Basser PJ, Pierpaoli C: Microstructural and physiological features of tissues elucidated by quantitative-diffusion-tensor MRI. J Magn Reson B 1996; 111:209–219Google Scholar
31. Beaulieu C: The basis of anisotropic water diffusion in the nervous system—a technical review. NMR Biomed 2002; 15:435–455Google Scholar
32. Szeszko PR, Ardekani BA, Ashtari M, Malhotra AK, Robinson DG, Bilder RM, Lim KO: White matter abnormalities in obsessive-compulsive disorder: a diffusion tensor imaging study. Arch Gen Psychiatry 2005; 62:782–790Google Scholar
33. Cannistraro PA, Makris N, Howard JD, Wedig MM, Hodge SM, Wilhelm S, Kennedy DN, Rauch SL: A diffusion tensor imaging study of white matter in obsessive-compulsive disorder. Depress Anxiety 2007; 24:440–446Google Scholar
34. Lawrence NS, An SK, Mataix-Cols D, Ruths F, Speckens A, Phillips ML: Neural responses to facial expressions of disgust but not fear are modulated by washing symptoms in OCD. Biol Psychiatry 2007; 61:1072–1080Google Scholar
35. Goodman WK, Price LH, Rasmussen SA, Mazure C, Fleischmann RL, Hill CL, Heninger GR, Charney DS: The Yale-Brown Obsessive Compulsive Scale, I: development, use, and reliability. Arch Gen Psychiatry 1989; 46:1006–1011Google Scholar
36. Sheehan DV, Lecrubier Y, Sheehan KH, Amorim P, Janavs J, Weiller E, Hergueta T, Baker R, Dunbar GC: The Mini-International Neuropsychiatric Interview (MINI): the development and validation of a structured diagnostic psychiatric interview for DSM-IV and ICD-10. J Clin Psychiatry 1998; 59(suppl 20):22–33Google Scholar
37. Montgomery SA, Asberg M: A new depression scale designed to be sensitive to change. Br J Psychiatry 1979; 134:382–389Google Scholar
38. Foa EB, Huppert JD, Leiberg S, Langner R, Kichic R, Hajcak G, Salkovskis PM: The Obsessive-Compulsive Inventory: development and validation of a short version. Psychol Assess 2002; 14:485–496Google Scholar
39. Nelson HE: National Adult Reading Test (NART) Manual. Windor, UK, 1982Google Scholar
40. Smith SM, Jenkinson M, Woolrich MW, Beckmann CF, Behrens TE, Johansen-Berg H, Bannister PR, De Luca M, Drobnjak I, Flitney DE, Niazy RK, Saunders J, Vickers J, Zhang Y, De Stefano N, Brady JM, Matthews PM: Advances in functional and structural MR image analysis and implementation as FSL. Neuroimage 2004; 23(suppl 1):S208–S219Google Scholar
41. Bullmore ET, Suckling J, Overmeyer S, Rabe-Hesketh S, Taylor E, Brammer MJ: Global, voxel, and cluster tests, by theory and permutation, for a difference between two groups of structural MR images of the brain. IEEE Trans Med Imaging 1999; 18:32–42Google Scholar
42. Suckling J, Davis MH, Ooi C, Wink AM, Fadili J, Salvador R, Welchew D, Sendur L, Maxim V, Bullmore ET: Permutation testing of orthogonal factorial effects in a language-processing experiment using fMRI. Hum Brain Mapp 2006; 27:425–433Google Scholar
43. Papageorgiou CC, Rabavilas AD: Abnormal P600 in obsessive-compulsive disorder: a comparison with healthy controls. Psychiatry Res 2003; 119:133–143Google Scholar
44. Kitamura H, Shioiri T, Kimura T, Ohkubo M, Nakada T, Someya T: Parietal white matter abnormalities in obsessive-compulsive disorder: a magnetic resonance spectroscopy study at 3-Tesla. Acta Psychiatr Scand 2006; 114:101–108Google Scholar
45. Okasha A, Rafaat M, Mahallawy N, El Nahas G, El Dawla AS, Sayed M, El Kholi S: Cognitive dysfunction in obsessive-compulsive disorder. Acta Psychiatr Scand 2000; 101:281–285Google Scholar
46. Chamberlain SR, Fineberg NA, Blackwell AD, Clark L, Robbins TW, Sahakian BJ: A neuropsychological comparison of obsessive-compulsive disorder and trichotillomania. Neuropsychologia 2007; 45:654–662Google Scholar
47. Smith SM, Jenkinson M, Johansen-Berg H, Rueckert D, Nichols TE, Mackay CE, Watkins KE, Ciccarelli O, Cader MZ, Matthews PM, Behrens TE: Tract-based spatial statistics: voxelwise analysis of multi-subject diffusion data. Neuroimage 2006; 31:1487–1505Google Scholar
48. Jones DK, Symms MR, Cercignani M, Howard RJ: The effect of filter size on VBM analyses of DT-MRI data. Neuroimage 2005; 26:546–554Google Scholar