Delusional Thoughts and Regional Frontal/Temporal Cortex Metabolism in Alzheimer’s Disease
Abstract
OBJECTIVE: Delusional thoughts are common in patients with Alzheimer’s disease and contribute prominently to morbidity. The pathophysiologic underpinnings for delusions in Alzheimer’s disease are not well understood. In this study the authors examined the relationship between delusional thoughts and regional cortical metabolism in patients with Alzheimer’s disease. METHOD: Twenty-five patients with probable Alzheimer’s disease were included. None was taking psychotropic medication. Severity of delusions and other neuropsychiatric symptoms was assessed by using a semistructured interview and the Neurobehavioral Rating Scale just before the imaging procedure. [18F]Fluorodeoxyglucose positron emission tomography was used to measure resting cerebral glucose metabolic rates in the cortical lobes and in anatomically defined subregions of the frontal and temporal cortexes. RESULTS: A linear regression model, controlling for the effects of cognitive deficits, revealed a significant relationship between severity of delusional thought and the metabolic rates in three frontal regions: the right superior dorsolateral frontal cortex (Brodmann’s area 8), the right inferior frontal pole (Brodmann’s area 10), and the right lateral orbitofrontal region (Brodmann’s area 47). Bivariate partial correlation analysis indicated that severity of delusions was associated with hypometabolism in additional prefrontal and anterior cingulate regions. Robust relationships with metabolism in regions of the temporal cortex were not apparent. CONCLUSIONS: Dysmetabolism in specific regions of the right prefrontal cortex may be associated with delusional thought in Alzheimer’s disease. Delusions appear to reflect the pathophysiologic state of particular cortical regions. Activity across distributed neuronal networks and the specific content of delusional thoughts may modulate these relationships.
Delusional thoughts are common in patients with Alzheimer’s disease and are associated with considerable morbidity. Studies indicate that delusions are present in approximately 30%–40% of patients with Alzheimer’s disease (1–4), fluctuate over time but often persist (5–7), and are associated with aggressive behaviors (8, 9) and more rapid cognitive decline (1). Delusions and other noncognitive symptoms in Alzheimer’s disease contribute prominently to caregiver distress (10) and decisions to place the patient in a nursing home (11, 12). Criteria for the syndrome of psychosis in Alzheimer’s disease have been proposed (13), as the psychotic signs appear to represent a specific syndrome with longitudinal stability.
Emerging evidence indicates that psychosis and many other psychiatric and behavioral symptoms, in addition to the deficits in memory and other cognitive abilities, are fundamental expressions of the neurodegenerative illness. However, the specific etiologic factors and pathophysiologic mechanisms that are involved remain unclear. Neuropathological studies have revealed associations between delusional thoughts during the course of Alzheimer’s disease and density of neurofibrillary tangles, neuronal cell loss, or neurochemical abnormalities in specific cortical and subcortical regions at autopsy (14–17). In addition, neuroimaging assessments of regional cortical atrophy, ventricular enlargement, or white matter lesions using computed tomography or magnetic resonance imaging (MRI) suggest that focal structural abnormalities may be associated with the presence of psychosis in Alzheimer’s disease (18–21). More recently, neuroimaging techniques such as positron emission tomography (PET) and single photon emission computed tomography (SPECT) have been used to explore regional abnormalities of brain function associated with delusions in Alzheimer’s disease. A few studies have revealed associations between delusional thoughts in Alzheimer’s disease and function in a variety of brain regions: the temporal cortex (22, 23), frontal regions (24–26), and other areas (25, 27). Different methods among the studies probably account for the variable findings. The presence of delusions was often determined by retrospective caregiver observations over broad time spans, patients were characterized as either delusional or nondelusional, and functional activity was generally measured in relatively large cortical regions.
We used observer-rated scores of the intensity or severity of delusional thoughts and [18F]fluorodeoxyglucose (FDG) PET imaging on the same day to measure the relationship between delusions and cortical metabolism in patients with Alzheimer’s disease. Because previous studies of Alzheimer’s disease, as well as results from other psychotic disorders, such as schizophrenia (28), suggested relationships with functional activity in the frontal and temporal cortexes, we focused on these brain regions.
Method
Patients
The study included 25 patients with Alzheimer’s disease. The majority (N=18) were outpatients recruited from the West Los Angeles Department of Veterans Affairs (VA) Healthcare Center Memory Disorders Clinic or from the University of California, Los Angeles, Alzheimer’s Disease Center Clinic; seven participants were recruited from the Geropsychiatry Inpatient Unit at the West Los Angeles VA Healthcare Center. There were 24 men and one woman, reflecting the high proportion of veteran participants. Their mean age was 69.5 years (SD=6.7), and their mean education level was 13.7 years (SD=2.6). The mean duration of dementia was 4.2 years (SD=1.9), and the mean Mini-Mental Status Examination (MMSE) score was 16.5 (SD=6.0, range=6–28).
Each patient had completed a thorough clinical evaluation of neurologic, psychiatric, and cognitive symptoms and signs, as well as a laboratory evaluation that included blood assays, urinalysis, chest X-ray, electrocardiogram, and MRI. Other assessments, such as electroencephalogram, cerebrospinal fluid examination, and standardized neuropsychological examination, were performed if clinically indicated. The final diagnosis was established by a clinical research investigator. The participants in this study met the clinical criteria for probable Alzheimer’s disease established by the National Institute of Neurological and Communicative Disorders and Stroke and the Alzheimer’s Disease and Related Disorders Association (29). Patients were excluded if there was a history of head trauma with loss of consciousness, history or neuroimaging evidence of stroke, seizure disorder, history of psychotic disorder before Alzheimer’s disease, substance use disorder, or systemic illness or other neurologic illness that could account for cognitive deficits. In each case, the MRI was normal, showed diffuse atrophy, or demonstrated only thin periventricular hyperintensity or a few scattered deep white matter hyperintensities. Patients also were excluded if there was severe aphasia that prohibited expression of meaningful thoughts. Noncognitive psychiatric symptoms were not considered in the enrollment decision. No participant had been treated with a cholinesterase inhibitor (tacrine, donepezil, rivastigmine, galantamine). The participants had not taken any psychotropic medication during the 3 weeks before the research assessment and PET imaging. The study procedures and risks were discussed with each participant and his or her family representative. Written informed consent was obtained according to institutional review board guidelines after the procedures had been fully explained.
Structured Clinical Assessment
Each participant underwent a clinical assessment immediately before the PET imaging procedure. The assessments included the MMSE (30), the Hamilton Depression Rating Scale (31), and the Neurobehavioral Rating Scale (3, 32). The Neurobehavioral Rating Scale is a 28-item instrument that measures the severity of a broad range of neuropsychiatric symptoms and behavioral disturbances, on the basis of a semistructured interview with the patient. A caregiver report of recent symptoms was used in the interview to help probe for active patient symptoms, which were then rated. Each item of the Neurobehavioral Rating Scale is scored from 0 (not present) to 6 (extremely severe). The delusion score for each patient was defined as the score on the delusion item (item 20) of the Neurobehavioral Rating Scale. Specific anchor points for each of the seven levels for this item were used to help assign an individual’s score. The Neurobehavioral Rating Scale has demonstrated satisfactory interrater reliability (33) and is a valid measure of psychopathology in patients with dementia (3). Principal components analysis has revealed six Neurobehavioral Rating Scale factors in patients with dementia: cognition (seven items), anxiety/depression (five items), behavioral retardation (four items), psychosis (four items), agitation/disinhibition (nine items), and verbal output disturbance (two items). The semistructured interview and all assessments were completed by one investigator (D.L.S.).
PET Imaging and Image Analysis
PET imaging of cerebral metabolic activity was performed by using the Siemens 953/31 tomographic scanner (Siemens Medical Solutions, Hoffman Estates, Ill.), which captures approximately 3-mm slices of activity and has in-plane and axial resolution of approximately 5 mm at full width at half maximum. Radial artery cannulation was performed in order to sample arterial blood to measure the input function for use in the kinetic model. Each participant received an intravenous dose of 5–10 mCi FDG, which was synthesized at the PET Imaging Facility of the VA Greater Los Angeles Healthcare System by using the technique of Hamacher et al. (34). During the 40-minute uptake phase, the patient rested in a dimly lit room with eyes open and ears unplugged. Arterial blood samples were obtained at defined intervals to describe the input function. The patient was then positioned in the tomograph, with the imaging plane parallel to the canthomeatal line. Head position was maintained with the aid of a thin restraining tape across the patient’s forehead. Metabolic data were acquired over approximately 40 minutes.
The PET imaging data from each participant were corrected for attenuation and displayed on a monitor. The imaging data were axially resliced to generate uniform thicknesses of brain metabolic activity, approximately 8 mm thick. Cerebral regions of interest were drawn on the resliced PET images by one investigator (D.L.S.), experienced in PET image analysis and blind to the subject’s identity, using a cursor (35). Templates of FDG-PET regions of interest, an MRI atlas with superimposed defined regions of interest, and the patient’s MRI were used to help visually guide the definition of the boundaries of the regions of interest on an individual’s PET images. Thirteen regions in each frontal lobe hemisphere and nine regions in each temporal lobe hemisphere were defined. The frontal regions were the precentral (Brodmann’s area 4), premotor (area 6), superior medial prefrontal (medial aspect, areas 6 and 8), superior dorsolateral (area 8), lateral prefrontal (middle frontal gyrus, area 46), lateral frontal (inferior frontal gyrus, areas 44 and 45), operculum (area 44), superior frontal pole (area 9), inferior frontal pole (area 10), anterior cingulate (areas 24 and 32), lateral orbitofrontal (area 47), central orbitofrontal (area 11), and medial orbitofrontal (areas 11 and 12). The temporal regions were the superior temporal gyrus, middle temporal gyrus, inferior temporal gyrus, fusiform gyrus, temporal pole (Brodmann’s area 38), parahippocampal gyrus, amygdala, hippocampus, and posterior hippocampal formation. This technique has been shown to be reliable for measurement of regional metabolic rates (35, 36). The metabolic rate for glucose was calculated for each region of interest according to the method of Sokoloff and colleagues (37, 38) as applied to the noninvasive measurement of human cerebral glucose metabolism, by using the input function, kinetic rate constants, and the lumped constant. The mean absolute metabolic rates for the frontal and temporal lobes in each hemisphere were calculated by averaging the absolute metabolic rates, weighted for size, of the regions within each lobe. The mean absolute metabolic rates in the entire parietal, occipital, and limbic cortexes of each hemisphere were also calculated. Mean limbic cortex metabolism included metabolism in individual elements of the limbic system across the traditional anatomical lobes. There was no correction for the effects of intrusion of individual pixels representing cerebrospinal fluid on the regional metabolic rates. Metabolic rates for the regions of interest and cortical lobes were normalized to the individual’s mean global cerebral metabolic rate.
Statistical Analyses
Associations between the delusion score and 1) other scores measuring clinical symptoms (Neurobehavioral Rating Scale factor scores, Hamilton depression scale score) and 2) the metabolic rate in each cortical lobe were measured by using Spearman correlation coefficients. The multivariate relationship between the delusion score and metabolic rates in the frontal and temporal regions was assessed by using stepwise multiple linear regression analysis (forward elimination), with regional metabolic rates and the Neurobehavioral Rating Scale cognition factor score (to control for the effect of global cognitive impairment) included as potential predictor variables in the model. Because of the limited number of subjects, we were not able to explore possible interactions among the metabolic rate variables. A resampling, or bootstrap, procedure was used to examine the stability of the regression model coefficients (39). In this procedure, subgroups of the 25 patients were randomly selected, with replacement; the sampling was repeated 500 times. Regression coefficients and standard errors were calculated, and they were compared to the results in the conventional Gaussian regression model. Finally, to further explore the relationship between severity of delusional thought and metabolic activity in frontal and temporal regions, univariate partial correlations for the delusion score and individual regions (controlling for the effect of the Neurobehavioral Rating Scale cognition factor score) were examined. Statistical significance for all analyses was set at alpha=0.05; the tests were two-tailed.
Results
Delusions
At the time of neuroimaging, six patients had a delusion score of 0 (no delusions), six patients had a delusion score of 1 (very mild delusions: overvalued ideas that may be amended with additional evidence), and 13 patients had a delusion score of 2 or higher (at least mild delusions: false beliefs that persist in spite of evidence to the contrary). The delusional beliefs of the patients with scores of 2 or higher are shown in Table 1. Among the 25 patients, there was a significant correlation between delusion score and the Neurobehavioral Rating Scale cognition factor score (r=0.62, p=0.001) and agitation factor score (r=0.60, p=0.001); the delusion score was higher in those with more cognitive deficits and more agitated behaviors. The delusion score was not significantly associated with age (r=0.29), age at onset of dementia (r=0.28), duration of dementia (r=–0.21), Hamilton depression scale score (r=0.16), Neurobehavioral Rating Scale anxiety/depression factor score (r=–0.25), or Neurobehavioral Rating Scale behavioral retardation factor score (r=–0.22). Four patients had hallucination scores of 2 or higher (at least mild hallucinations). There was no difference in delusion score between patients with hallucination scores of 2 or higher and those with hallucination scores of 0 or 1 (Mann-Whitney U test, z=–1.55, p=0.13).
Cortical Metabolism and Relationship With Delusions
The mean global cortical metabolic rate among the patients with Alzheimer’s disease (in the resting state) was 28.8 mmol of glucose per 100 g of tissue per minute (compared to 36.5 mmol glucose/100 g per minute in a comparison group of normal elders). Bivariate correlation coefficients for the relationship between the delusion score and normalized metabolic rate in each cortical lobe are shown in Table 2. The relationship was significant for metabolism in the right frontal cortex (Figure 1) but not the other cortical lobes.
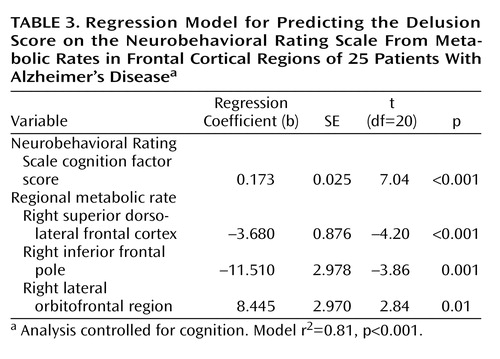
Results from the multiple regression analysis of individual frontal and temporal regional metabolic rates that predict the delusion score, while controlling for overall cognition, are shown in Table 3. Levels of metabolic activity in three right frontal regions were associated with the delusion score: the right superior dorsolateral frontal region (middle frontal gyrus, Brodmann’s area 8), the right inferior frontal pole (superior frontal gyrus, Brodmann’s area 10), and the right lateral orbitofrontal region (Brodmann’s area 47). Low metabolism was associated with greater severity of delusions for the dorsolateral and inferior frontal regions, while low metabolism was associated with less severe delusions for the lateral orbitofrontal region. The regression model r2 was 0.81 (p<0.001). Examples of regional cortical hypometabolism associated with delusions in Alzheimer’s disease are shown in Figure 2. When age, age at onset of dementia, and duration of dementia were included in the regression model, the relationship between the delusion score and frontal metabolic rate was unchanged. The regression coefficients for each of the predictors that emerged in the conventional regression model were also significant in the resampling, or bootstrap, model (Neurobehavioral Rating Scale cognition factor score, p<0.001; right superior dorsolateral frontal region, p<0.001; right inferior frontal pole, p=0.008; right lateral orbitofrontal region, p=0.04). In an exploratory post hoc analysis, the Neurobehavioral Rating Scale agitation factor score was included as a covariate in the regression model. The relationship between the delusion score and metabolic activity in the right superior dorsolateral frontal region remained significant (p=0.002), but the relationships with other frontal regions were no longer significant.
In order to further explore the relationship between severity of delusional thought and metabolic rates in regions of the frontal and temporal cortexes, we examined partial correlation coefficients for bivariate relationships between the delusion score and individual frontal and temporal regional metabolic rates (controlling for overall cognition by using the Neurobehavioral Rating Scale cognition factor score). Relationships for which rs>0.40 (p<0.05) are shown in Table 4. Only the relationship with metabolism in the right superior dorsolateral frontal region was significant at the p<0.05 level with Bonferroni adjustment for multiple comparisons.
Discussion
The results of this study indicate that hypometabolism in two regions of the right prefrontal cortex, the superior dorsolateral area (lateral aspect of Brodmann’s area 8) and inferior frontal pole (Brodmann’s area 10), are associated with delusional thoughts in patients with Alzheimer’s disease. The regression analysis also indicated that hypermetabolism in the lateral orbitofrontal region (Brodmann’s area 47) was independently associated with delusions, when we controlled for the metabolism in the other two regions. In bivariate correlation analyses, hypometabolism in additional right prefrontal regions, some homologous left prefrontal regions, and the bilateral anterior cingulate gyrus were also related to the severity of delusions, although this analysis was a consideration of each region individually rather than a simultaneous evaluation of all regions. Hypermetabolism in the left middle temporal gyrus was associated with delusions in the bivariate correlation analysis, but there were no other observed relationships between delusional thought and metabolic activity in the temporal lobe.
The results of a few previous PET and SPECT studies have suggested a relationship between delusional thought in Alzheimer’s disease and abnormal metabolism or perfusion in the frontal cortex. Early studies of global lobar function by Grady et al. (40), Kotrla et al. (41), and our group (26) suggested frontal involvement. More recently, Mega and colleagues (25) reported that patients with Alzheimer’s disease and delusions had lower perfusion in the bilateral dorsolateral prefrontal cortex and left anterior cingulate gyrus than did patients with Alzheimer’s disease without delusions. The highest peak z score on the statistical parametric map was near Brodmann’s area 6 in the right dorsolateral frontal cortex. Staff and colleagues found that hypoperfusion in the right prefrontal cortex was associated with the presence of content-specific delusions (42) or any persistent delusion (24). In an FDG-PET study, Mentis et al. (27) demonstrated hypometabolism in orbitofrontal and anterior cingulate regions in Alzheimer’s disease patients with misidentification delusions. Lopez et al. (43) examined two patients with Alzheimer’s disease and delusions and found left dorsolateral prefrontal hypoperfusion in both, with additional right frontal hypoperfusion in one. Three of these studies demonstrating relationships between frontal metabolism and delusions in Alzheimer’s disease also indicated that metabolism or perfusion of the temporal cortex (27, 43) or other cortical or subcortical regions (25, 27) contributes. Moreover, in studies by Hirono et al. (22) and Starkstein et al. (23), abnormal metabolism or perfusion in the temporal cortex was associated with delusions in Alzheimer’s disease, without evidence of frontal lobe involvement. However, temporal dysfunction is less consistently demonstrated across the reports. Both low and high metabolism or perfusion in the temporal lobe have been seen, and different subregions, either on the left or bilaterally, have been implicated.
The substantial heterogeneity of previous findings probably reflects large differences in patient groups, clinical assessment strategies, definition of delusions, medication status, neuroimaging procedures, clinical state at the time of functional neuroimaging, and image analysis techniques. Many investigators have examined only selected regions within lobes or have summed measurements of activity across large volumes. In the current study, the patient’s thought content was assessed near the time of the neuroimaging procedure, thus helping to establish a relationship between his or her neurophysiologic state and ongoing thought. Clinical assessments were performed by trained staff using a graded measure of delusion severity. No patient was taking psychotropic medication, and metabolism was measured in regions of interest that reflect known neurobiological boundaries in frontal and temporal regions.
The specific content of delusional thoughts, as well as their presence, may reflect functional activity in particular brain regions of a distributed network. The heterogeneity of the delusional thoughts present in this study and the limited number of subjects do not allow thorough analysis, and most reports of previous studies did not describe the nature of the delusional thoughts that were present. Studies by Hirono et al. (22), Mentis et al. (27), and Ponton et al. (44) included many patients with paranoid delusions or misidentification delusions (e.g., spouse is an impostor, house is not one’s home) and showed associated abnormalities in the temporal cortex or orbitofrontal cortex. In contrast, the studies by Staff et al. (24, 42) and the current study included some patients with predominant “factual” delusions that are less emotionally charged, e.g., delusions about current activities or fixed false beliefs regarding the environment (Table 1). These delusions had specific and persistent content and were firmly held in spite of information to the contrary, and thus they were considered delusions and not solely a reflection of inaccurate memory or poor insight. The relationships of delusions with frontal metabolism or perfusion were strongest in these studies. It is possible that temporal or orbitofrontal dysfunction contributes to delusions that involve fear or interpersonal relevance through limbic connections, whereas delusions of fact are linked to frontal dysfunction and errors of logic, monitoring, or mapping internal impressions to observations of the external environment.
Data from patients with psychosis due to neuropsychiatric disorders other than Alzheimer’s disease support a role for frontal dysfunction in the expression of delusional thoughts, although other brain regions may contribute. Studies of patients with frontotemporal dementia and psychosis (45, 46) or those with schizophrenia (28, 47, 48) have revealed abnormal frontal function, although the findings do not all agree. While a unitary neurophysiology of delusional thought is intriguing, additional data are needed, and disease-specific factors probably play an important role.
While activity in discrete brain regions has value in understanding the etiology of clinical symptoms such as delusions in Alzheimer’s disease, function across distributed networks that span neuroanatomic foci is probably more pathophysiologically relevant. Several neuronal circuits have been implicated across diagnostic groups. Cummings (49) suggested that lesions in the temporal cortex or caudate nucleus may result in delusional thoughts by disrupting limbic functions that link perception to emotional states. Richardson and Malloy (50) proposed that right hemisphere structures and the frontal cortex influence the development of content-specific delusions by disrupting self-corrective functions, and they suggested that temporal lobe lesions may also contribute through dysregulation of the experience of familiarity. Blackwood and colleagues, in a review of persecutory delusions from the perspective of cognitive neuroscience (51), indicated that the medial and lateral inferior prefrontal cortex, anterior cingulate, and ventral striatum, as well as the temporal cortex, are involved in several cognitive processes that contribute to delusions: attentional bias, attributional bias, and deficits in the theory of mind. These findings are consistent with the idea that the role of frontal and temporal dysfunction in the development of delusions is mediated by a collaborative network. Although the neuropathology of Alzheimer’s disease is widespread, and distant abnormalities may be important, most patients have prominent structural (52) and metabolic (53) abnormalities in the temporal cortex. In this study, the mean absolute metabolic rate in the temporal cortex was 20% lower than the mean frontal metabolic rate across the Alzheimer’s disease patients, which indicates lower relative temporal cortex metabolism than occurs in elderly normal subjects (54). Patients with hypometabolism in additional critical regions of the frontal cortex may develop delusions as a result of the loss of frontal systems that facilitate the monitoring of reality, compare internal experience with reality, link new experiences with memories of the past, or prevent consolidation of inaccurate beliefs. Such a hypothesis is supported by the finding that the density of neurofibrillary tangles in neocortical regions, including the midfrontal gyrus, but not the hippocampus or entorhinal cortex, is associated with delusions in Alzheimer’s disease (15).
There are several aspects of this study that must be considered carefully in interpreting the results. First, we focused on the metabolic rate in defined regions of the frontal and temporal lobes, on the basis of previous findings. We thus cannot exclude associations between severity of delusions and metabolic activity elsewhere in the brain, although no lobar effects were found. Also, the limited number of subjects prohibits a definitive analysis of the potential simultaneous impact of many regional metabolic rates on the Neurobehavioral Rating Scale delusion score. Moreover, the associations with specific frontal regions that emerged in the regression model are sensitive to chance fluctuations given the number of subjects, as well as potential intercorrelations among metabolic rates, and thus may not be replicable. However, the significance of associations with individual frontal regions was confirmed in the resampling model. Second, whether regional metabolic rate is a cause or an effect of delusional thoughts in Alzheimer’s disease could not be determined in this study. Third, the observed regional metabolic rates may be due to anatomically distant, rather than local, structural lesions (55). Thus, we cannot exclude an etiologic role for distant cortical neuropathologic events that are reflected in local regional metabolic rates. In addition, the regional metabolic rates were not corrected for atrophy, and thus regional hypometabolism in this study may at least partly reflect regional brain atrophy. Fourth, it is possible that neuropsychiatric symptoms other than delusions may contribute to the observed relationships with regional metabolic rates. However, the analyses controlled for the effects of cognitive impairment, and other psychiatric symptoms, including anxiety, depression, and behavioral retardation, were not associated with severity of delusions. Delusions were associated with the extent of agitated behavior, although these two constructs are not entirely independent and strict control for behavioral consequences of delusional thoughts in the analysis needs to be considered cautiously. Nonetheless, when the Neurobehavioral Rating Scale agitation factor score was included in the regression model, the significant relationship between the delusion score and hypometabolism in the right superior dorsolateral cortex persisted, but the relationships with the other two frontal regions were not clearly independent of the effect of agitated behavior.
The results of this study indicate that hypometabolism in specific regions of the right prefrontal cortex may be involved in the expression of delusions in Alzheimer’s disease. Functional interactions across broader neuronal networks are likely to be important. These findings contribute a neurobiological framework for a specific syndrome of psychosis in Alzheimer’s disease (13) that appears to be longitudinally consistent (7, 56). Other factors, which may or may not be linked to regional neuroanatomic effects, also may be important. Such factors include genotype, neurochemical abnormalities, cultural background, previous personal experience, psychological state, and effects specific to particular delusional thoughts. Better understanding of the relationships between regional brain function and clinical symptoms in Alzheimer’s disease can help to refine the syndromal concept of psychosis in Alzheimer’s disease and to predict longitudinal stability of symptoms and response to therapeutic intervention.
 |
 |
 |
 |
Received Feb. 20, 2002; revision received June 17, 2002; accepted July 11, 2002. From the Department of Psychiatry and Biobehavioral Sciences and the Department of Neurology, David Geffen School of Medicine at UCLA; and the VA Greater Los Angeles Healthcare System. Address reprint requests to Dr. Sultzer, Gero/Neuropsychiatry, 3-South, 116AF, West Los Angeles VA Healthcare Center, 11301 Wilshire Blvd., Los Angeles, CA 90073; [email protected] (e-mail). Supported by grant MH-56031 from NIMH, the Department of Veterans Affairs, and Alzheimer’s Disease Research Center grant AG-16057 from the National Institute on Aging. The authors thank Jeffrey Gornbein, Dr.Ph., for guidance in the statistical analyses, and Lorena Monserratt, B.A., Denise Feil, M.D., M.P.H., and Evan Freedman, B.S., for assistance with patient care, project administration, and data management.

Figure 1. Scatterplot Showing the Relationship of the Score on the Delusion Item of the Neurobehavioral Rating Scale With the Metabolic Rate in the Right Frontal Cortex of 25 Patients With Alzheimer’s Disease
aMean metabolic rate in the right frontal cortex, normalized to the individual’s mean global cerebral metabolic rate.

Figure 2. Cerebral Metabolic Rates in a Healthy Elderly Comparison Subject, a Patient With Alzheimer’s Disease Without Delusions, and a Patient With Alzheimer’s Disease and Delusionsa
aImages are displayed as three-dimensional volume renderings of PET-derived metabolic rates at rest. Each row of images is from a different individual. In the image displays, when a voxel’s metabolic rate is below the threshold value (80% of the mean metabolic rate for the whole brain), the voxel is eliminated and appears as a metabolic “hole” in the image. The image on the left in each row is a lateral view of the brain, and the middle image is a view directly toward the front of the brain. The image on the right is a frontal view that has been excavated to the level of the superior frontal pole (Brodmann’s area 9) to reveal metabolic rates in the frontal cortical rim at this level. Metabolism is represented according to a color scale in which red indicates the highest relative metabolic rate and yellow and green indicate lower metabolism.
bThe subject was a normal 72-year-old man without Alzheimer’s disease (MMSE score=30). The volume images show no defects, and the frontal cortical rim shows high metabolic activity (arrow; uniform red rim).
cThe subject was a 63-year-old man with autopsy-confirmed Alzheimer’s disease and moderate cognitive deficits (MMSE score=14) but no delusional thoughts. The parietal and temporal cortex show moderate defects (image on the left), but the frontal cortical view appears normal (middle image), and the frontal cortical rim shows preserved metabolic activity (arrow; image on the right).
dThe subject was a 78-year-old man with Alzheimer’s disease, moderate cognitive deficits (MMSE score=13), and firmly held delusional beliefs of a somatic condition and vermin living in his home. The parietal and temporal cortex show moderate defects (image on the left). In addition, the frontal cortex shows moderate defects (middle image), and the frontal cortical rim shows low metabolic activity (image on the right), particularly in the right hemisphere (arrow). The absence of superior and inferior cerebral metabolism is due to the restricted field of view in the PET image acquisition and not metabolic deficit.
1. Paulsen JS, Salmon DP, Thal LJ, Romero R, Weisstein-Jenkins C, Galasko D, Hofstetter CR, Thomas R, Grant I, Jeste DV: Incidence of and risk factors for hallucinations and delusions in patients with probable AD. Neurology 2000; 54:1965-1971Crossref, Medline, Google Scholar
2. Flint AJ: Delusions in dementia: a review. J Neuropsychiatry Clin Neurosci 1991; 3:121-130Crossref, Medline, Google Scholar
3. Sultzer DL, Levin HS, Mahler ME, High WM, Cummings JL: Assessment of cognitive, psychiatric, and behavioral disturbances in patients with dementia: the Neurobehavioral Rating Scale. J Am Geriatr Soc 1992; 40:549-555Crossref, Medline, Google Scholar
4. Rockwell E, Jackson E, Vilke G, Jeste DV: A study of delusions in a large cohort of Alzheimer’s disease patients. Am J Geriatr Psychiatry 1994; 2:157-164Medline, Google Scholar
5. Ballard CG, O’Brien JT, Swann AG, Thompson P, Neill D, McKeith IG: The natural history of psychosis and depression in dementia with Lewy bodies and Alzheimer’s disease: persistence and new cases over 1 year of follow-up. J Clin Psychiatry 2001; 62:46-49Crossref, Medline, Google Scholar
6. Devanand DP, Jacobs DM, Tang M-X, Del Castillo-Castaneda C, Sano M, Marder K, Bell K, Bylsma FW, Brandt J, Albert M, Stern Y: The course of psychopathologic features in mild to moderate Alzheimer disease. Arch Gen Psychiatry 1997; 54:257-263Crossref, Medline, Google Scholar
7. Levy ML, Cummings JL, Fairbanks LA, Bravi D, Calvani M, Carta A: Longitudinal assessment of symptoms of depression, agitation, and psychosis in 181 patients with Alzheimer’s disease. Am J Psychiatry 1996; 153:1438-1443Link, Google Scholar
8. Deutsch LH, Bylsma FW, Rovner BW, Steele C, Folstein MF: Psychosis and physical aggression in probable Alzheimer"s disease. Am J Psychiatry 1991; 148:1159-1163Link, Google Scholar
9. Rapoport MJ, van Reekum R, Freedman M, Streiner D, Simard M, Clarke D, Cohen T, Conn D: Relationship of psychosis to aggression, apathy and function in dementia. Int J Geriatr Psychiatry 2001; 16:123-130Crossref, Medline, Google Scholar
10. Donaldson C, Tarrier N, Burns A: The impact of the symptoms of dementia on caregivers. Br J Psychiatry 1997; 170:62-68Crossref, Medline, Google Scholar
11. Stern Y, Tang M-X, Albert MS, Brandt J, Jacobs DM, Bell K, Marder K, Sano M, Devanand D, Albert SM, Bylsma F, Tsai W-Y: Predicting time to nursing home care and death in individuals with Alzheimer disease. JAMA 1997; 227:806-812Crossref, Google Scholar
12. Steele C, Rovner B, Chase GA, Folstein M: Psychiatric symptoms and nursing home placement of patients with Alzheimer’s disease. Am J Psychiatry 1990; 147:1049-1051Link, Google Scholar
13. Jeste DV, Finkel SI: Psychosis of Alzheimer’s disease and related dementias: diagnostic criteria for a distinct syndrome. Am J Geriatr Psychiatry 2000; 8:29-34Crossref, Medline, Google Scholar
14. Lai MKP, Lai O-F, Keene J, Esiri MM, Francis PT, Hope T, Chen CPL-H: Psychosis of Alzheimer’s disease is associated with elevated muscarinic M2 binding in the cortex. Neurology 2001; 57:805-811Crossref, Medline, Google Scholar
15. Farber NB, Rubin EH, Newcomer JW, Kinscherf DA, Miller JP, Morris JC, Olney JW, McKeel DW Jr: Increased neocortical neurofibrillary tangle density in subjects with Alzheimer disease and psychosis. Arch Gen Psychiatry 2000; 57:1165-1173Crossref, Medline, Google Scholar
16. Zubenko GS, Moossy J, Martinez AJ, Rao G, Claassen D, Rosen J, Kopp U: Neuropathologic and neurochemical correlates of psychosis in primary dementia. Arch Neurol 1991; 48:619-624Crossref, Medline, Google Scholar
17. Forstl H, Burns A, Levy R, Cairns N: Neuropathological correlates of psychotic phenomena in confirmed Alzheimer’s disease. Br J Psychiatry 1994; 165:53-59Crossref, Medline, Google Scholar
18. Sultzer DL, Chen ST, Brown CV, Mahler ME, Cummings JL, Hinkin CH, Mandelkern MA: Subcortical hyperintensities in Alzheimer’s disease: associated clinical and metabolic findings. J Neuropsychiatry Clin Neurosci 2002; 14:262-269Crossref, Medline, Google Scholar
19. Geroldi C, Akkawi NM, Galluzzi S, Ubezio M, Binetti G, Zanetti O, Trabucchi M, Frisoni GB: Temporal lobe asymmetry in patients with Alzheimer’s disease with delusions. J Neurol Neurosurg Psychiatry 2000; 69:187-191Crossref, Medline, Google Scholar
20. Binetti G, Padovani A, Magni E, Bianchetti A, Scuratti A, Lenzi GL, Trabucchi M: Delusions and dementia: clinical and CT correlates. Acta Neurol Scand 1995; 91:271-275Crossref, Medline, Google Scholar
21. Forstl H, Burns A, Jacoby R, Levy R: Neuroanatomical correlates of clinical misidentification and misperception in senile dementia of the Alzheimer type. J Clin Psychiatry 1991; 52:268-271Medline, Google Scholar
22. Hirono N, Mori E, Ishii K, Kitagaki H, Sasaki M, Ikejiri Y, Imamura T, Shimomura T, Ikeda M, Yamashita H: Alteration of regional cerebral glucose utilization with delusions in Alzheimer’s disease. J Neuropsychiatry Clin Neurosci 1998; 10:433-439Crossref, Medline, Google Scholar
23. Starkstein SE, Vazquez S, Petracca G, Sabe L, Migliorelli R, Teson A, Leiguarda R: A SPECT study of delusions in Alzheimer’s disease. Neurology 1994; 44:2055-2059Crossref, Medline, Google Scholar
24. Staff RT, Shanks MF, Macintosh L, Pestell SJ, Gemmell HG, Venneri A: Delusions in Alzheimer’s disease: SPET evidence of right hemispheric dysfunction. Cortex 1999; 35:549-560Crossref, Medline, Google Scholar
25. Mega MS, Lee L, Dinov ID, Mishkin F, Toga AW, Cummings JL: Cerebral correlates of psychotic symptoms in Alzheimer’s disease. J Neurol Neurosurg Psychiatry 2000; 69:167-171Crossref, Medline, Google Scholar
26. Sultzer DL, Mahler ME, Mandelkern MA, Cummings JL, Van Gorp WG, Hinkin CH, Berisford MA: The relationship between psychiatric symptoms and regional cortical metabolism in Alzheimer’s disease. J Neuropsychiatry Clin Neurosci 1995; 7:476-484Crossref, Medline, Google Scholar
27. Mentis MJ, Weinstein EA, Horwitz B, McIntosh AR, Pietrini P, Alexander GE, Furey M, Murphy DGM: Abnormal brain glucose metabolism in the delusional misidentification syndromes: a positron emission tomography study in Alzheimer disease. Biol Psychiatry 1995; 38:438-449Crossref, Medline, Google Scholar
28. Blakemore S-J, Frith CD: Functional neuroimaging studies of schizophrenia, in Brain Mapping: The Disorders. Edited by Mazziotta JC, Toga AW, Frackowiak RSJ. San Diego, Academic Press, 2000, pp 523-544Google Scholar
29. McKhann G, Drachman D, Folstein M, Katzman R, Price D, Stadlan EM: Clinical diagnosis of Alzheimer’s disease: report of the NINCDS-ADRDA Work Group under the auspices of the Department of Health and Human Services Task Force on Alzheimer’s Disease. Neurology 1984; 34:939-944Crossref, Medline, Google Scholar
30. Folstein MF, Folstein SE, McHugh PR: “Mini-Mental State”: a practical method for grading the cognitive state of patients for the clinician. J Psychiatr Res 1975; 12:189-198Crossref, Medline, Google Scholar
31. Hamilton M: Development of a rating scale for primary depressive illness. Br J Soc Clin Psychol 1967; 6:278-296Crossref, Medline, Google Scholar
32. Levin HS, High WM, Goethe KE, Sisson RA, Overall JE, Rhoades HM, Eisenberg HM, Kalisky Z, Gary HE: The Neurobehavioral Rating Scale: assessment of the behavioral sequelae of head injury by the clinician. J Neurol Neurosurg Psychiatry 1987; 50:183-193Crossref, Medline, Google Scholar
33. Sultzer DL, Berisford MA, Gunay I: The Neurobehavioral Rating Scale: reliability in patients with dementia. J Psychiatr Res 1995; 29:185-191Crossref, Medline, Google Scholar
34. Hamacher K, Coenen HH, Stocklin G: Efficient stereospecific synthesis of no-carrier-added 2-18F-fluoro-2-deoxy-D-glucose using aminopolyether supported nucleophilic substitution. J Nucl Med 1986; 27:235-238Medline, Google Scholar
35. Small GW, Stern CE, Mandelkern MA, Fairbanks LA, Min CA, Guze BH: Reliability of drawing regions of interest for positron emission tomographic data. Psychiatry Res Neuroimaging 1992; 45:177-185Crossref, Medline, Google Scholar
36. Henry TR, Mazziotta JC, Engel J, Christenson PD, Zhang JX, Phelps ME, Kuhl DE: Quantifying interictal metabolic activity in human temporal lobe epilepsy. J Cereb Blood Flow Metab 1990; 10:748-757Crossref, Medline, Google Scholar
37. Phelps ME, Huang SC, Hoffman EJ, Selin C, Sokoloff L, Kuhl DE: Tomographic measurement of local cerebral glucose metabolic rate in humans with (F-18)2-fluoro-2-deoxy-D-glucose: validation of method. Ann Neurol 1979; 6:371-388Crossref, Medline, Google Scholar
38. Reivich M, Kuhl D, Wolf A, Greenberg J, Phelps M, Ido T, Casella V, Hoffman E, Alavi A, Sokoloff L: The F-18 fluorodeoxyglucose method for the measurement of local cerebral glucose utilization in man. Circ Res 1979; 44:127-137Crossref, Medline, Google Scholar
39. Efron B: The Jackknife, the Bootstrap, and Other Resampling Plans. Philadelphia, Society for Industrial and Applied Mathematics, 1982Google Scholar
40. Grady CL, Haxby JV, Schapiro MB, Gonzalez-Aviles A, Kumar A, Ball MJ, Heston L, Rapoport SI: Subgroups in dementia of the Alzheimer type identified using positron emission tomography. J Neuropsychiatry Clin Neurosci 1990; 2:373-384Crossref, Medline, Google Scholar
41. Kotrla KJ, Chacko RC, Harper RG, Jhingran S, Doody R: SPECT findings on psychosis in Alzheimer’s disease. Am J Psychiatry 1995; 152:1470-1475Link, Google Scholar
42. Staff RT, Venneri A, Gemmell HG, Shanks MF, Pestell SJ, Murray AD: HMPAO SPECT imaging of Alzheimer’s disease patients with similar content-specific autobiographic delusion: comparison using statistical parametric mapping. J Nucl Med 2000; 41:1451-1455Medline, Google Scholar
43. Lopez OL, Smith G, Becker JT, Meltzer CC, DeKosky ST: The psychotic phenomenon in probable Alzheimer’s disease: a positron emission tomography study. J Neuropsychiatry Clin Neurosci 2001; 13:50-55Crossref, Medline, Google Scholar
44. Ponton MO, Darcourt J, Miller BL, Cummings JL, Schumann SW, Maen I: Psychometric and SPECT studies in Alzheimer’s disease with and without delusions. Neuropsychiatry Neuropsychol Behav Neurol 1995; 8:264-270Google Scholar
45. Bozeat S, Gregory CA, Ralph MA, Hodges JR: Which neuropsychiatric and behavioural features distinguish frontal and temporal variants of frontotemporal dementia from Alzheimer’s disease? J Neurol Neurosurg Psychiatry 2000; 69:178-186Crossref, Medline, Google Scholar
46. Miller BL, Chang L, Mena I, Boone K, Lesser IM: Progressive right frontotemporal degeneration: clinical, neuropsychological and SPECT characteristics. Dementia 1993; 4:204-213Medline, Google Scholar
47. Sabri O, Erkwoh R, Schreckenberger M, Owega A, Sass H, Buell U: Correlation of positive symptoms exclusively to hyperperfusion or hypoperfusion of cerebral cortex in never-treated schizophrenics. Lancet 1997; 349:1735-1739Crossref, Medline, Google Scholar
48. Velakoulis D, Pantelis C: What have we learned from functional imaging studies in schizophrenia? the role of frontal, striatal and temporal areas. Aust NZ J Psychiatry 1996; 30:195-209Crossref, Medline, Google Scholar
49. Cummings JL: Psychosis in neurologic disease: neurobiology and pathogenesis. Neuropsychiatry Neuropsychol Behav Neurol 1992; 5:144-150Google Scholar
50. Richardson ED, Malloy PF: The frontal lobes and content-specific delusions, in The Frontal Lobes and Neuropsychiatric Illness. Edited by Salloway SP, Malloy PF, Duffy JD. Washington, DC, American Psychiatric Press, 2001, pp 215-232Google Scholar
51. Blackwood NJ, Howard RJ, Bentall RP, Murray RM: Cognitive neuropsychiatric models of persecutory delusions. Am J Psychiatry 2001; 158:527-539Link, Google Scholar
52. Lantos P, Cairns N: The neuropathology of Alzheimer’s disease, in Dementia. Edited by O’Brien J, Ames D, Burns A. London, Arnold, 2000, pp 443-459Google Scholar
53. Rapoport SI: Positron emission tomography in Alzheimer’s disease in relation to disease pathogenesis: a critical review. Cerebrovasc Brain Metab Rev 1991; 3:297-335Medline, Google Scholar
54. Duara R: Utilization of positron emission tomography for research and clinical applications in dementia, in Positron Emission Tomography in Dementia. Edited by Duara R. New York, Wiley-Liss, 1990, pp 1-12Google Scholar
55. Sultzer DL, Mahler ME, Cummings JL, Van Gorp WG, Hinkin CH, Brown C: Cortical abnormalities associated with subcortical lesions in vascular dementia: clinical and PET findings. Arch Neurol 1995; 52:773-780Crossref, Medline, Google Scholar
56. Schneider L, Katz I, Park S, Azen S, Martinez R: Psychosis of Alzheimer’s disease: validity and response to risperidone (abstract). Am J Geriatr Psychiatry 2001; 9(suppl 1):53Google Scholar