Increases in Regional Subarachnoid CSF Without Apparent Cortical Gray Matter Deficits in Schizophrenia: Modulating Effects of Sex and Age
Abstract
OBJECTIVE: The authors investigated the modulating effects of biological sex and age on regional decreases in cortical gray matter and increases in subarachnoid CSF in 25 patients with chronic schizophrenia and 28 group-matched healthy comparison subjects. METHOD: Computational cortical pattern-matching methods were employed to measure the local proportions of gray matter and subarachnoid CSF at thousands of homologous cortical surface locations in each subject using high-resolution magnetic resonance images. Principal-component analysis reduced tissue proportion values obtained at each cortical surface point into component scores for each subject. Principal-component analysis scores were used as dependent variables in statistical analyses that included diagnosis, age, and sex as predictor variables. To reveal more regional changes in tissue proportions, statistical differences in gray matter and CSF were compared at each cortical surface location and mapped in three dimensions. RESULTS: Principal-component analyses revealed main effects of diagnosis, sex, and age for the CSF increases seen in the schizophrenia patients, in male subjects, and in association with age. Significant diagnosis-by-age, diagnosis-by-sex, and diagnosis-by-sex-by-age interactions were also observed, revealing CSF increases in male patients at younger ages. Statistical maps showed regional increases in subarachnoid CSF in association with the above effects. For cortical gray matter measurements, only main effects of age were observed. CONCLUSIONS: Regionally specific increases in sulcal and subarachnoid CSF occur during adulthood and appear prematurely in male schizophrenia patients. Cortical gray matter reductions show aging effects but are below the threshold of significance in schizophrenia.
Increases in CSF—including lateral and third ventricular enlargements, sulcal widening, and larger CSF-to-brain tissue ratios—are the most frequently observed neuroanatomic abnormalities in schizophrenia (1–3). Although CSF increases, first recognized in pneumoencephalographic and computed tomography studies (4, 5), are well replicated in schizophrenia, the regional specificity of extracortical CSF increases are not well characterized, despite the improved spatial resolution of magnetic resonance imaging (MRI) techniques. Some MRI studies, however, have shown localized sulcal CSF increases in frontal and temporal regions (6, 7), although others have observed extracortical CSF enlargements in all brain regions (8, 9).
Cortical gray matter deficits have also been observed in schizophrenia, as documented in qualitative and quantitative reviews of the structural imaging literature, although findings are somewhat less consistent (3, 10–12). Cortical gray matter deficits in the temporal lobe, particularly the superior temporal gyrus (13–16) and medial temporal regions (17, 18), are well replicated in schizophrenia. Gray matter deficits in parietal, orbitofrontal, and mesiofrontal regions have also been reported with some frequency (19–21), although deficits in prefrontal and occipital regions are less consistently observed (3). Effect sizes obtained from pooling data across studies, however, suggest that global or regional differences in cortical gray matter volume are small (10, 22). Inadequate statistical power may therefore contribute to the relative frequency of negative findings.
Several other factors may compromise the ability to recognize small and regional differences in tissue distributions linked with schizophrenia. For example, different interactions between harmful environmental or polygenetic factors, potentially underlying the heterogeneous clinical manifestation of the disease, may interfere with attempts to identify local brain abnormalities that reflect an overall diagnostic specificity. Furthermore, enormous variation exists in normal brain structure that has been associated with individual differences such as biological sex (23–25), age (23, 26), and handedness (25, 27, 28) as well as the unique contributions of genetics and experience (29, 30). Possible interactions between these factors and those associated with disease processes may compromise the ability to recognize regional differences in tissue distributions that distinguish schizophrenia patients from healthy subjects. For example, gender differences, present in the clinical manifestation of the disease (i.e., age at onset), are also documented with respect to brain abnormalities (31, 32). Aging effects, as investigated in cross-sectional and longitudinal studies, suggest a progressive loss of gray matter, particularly in frontal and temporal regions, and pronounced CSF increases in schizophrenia patients relative to healthy subjects (33–37), although negative findings exist.
Brain mapping methods capable of matching structurally or functionally homologous brain regions between subjects may serve to increase power by reducing noise associated with the well-documented variability in brain structure between individuals. Matching corresponding cortical surface locations between subjects may therefore help to dissociate subtle and spatially diffuse differences in regional tissue volumes that may exist in schizophrenia. In this study, we employed such methods to isolate regional differences in tissue proportions (gray matter and CSF) surrounding the cortex in patients with chronic schizophrenia compared with healthy subjects. This methodological approach has been used in two published schizophrenia studies. The first study demonstrated an accelerated pattern of gray matter loss in childhood-onset patients relative to comparison subjects (38). The second investigation compared monozygotic and dizygotic twins discordant for chronic schizophrenia along with demographically matched control twins and showed highly significant differences surrounding prefrontal and temporal cortices that were interpreted to reflect genetic and disease-specific schizophrenia-related reductions in cortical gray matter (39). The results from these two studies, however, warrant further investigation for several reasons. First, childhood-onset schizophrenia patients may possess a more severe form of the disorder (40) and thus exhibit pronounced gray matter deficits and maturational/aging effects compared with patients with a more typical onset. Second, if aging effects are pronounced in schizophrenia, such effects may have contributed toward the positive results observed in the schizophrenia twin study (39). Finally, in the schizophrenia twin study, tissue-sampling measurements included voxels from nonbrain tissue such that group differences attributable to extracortical CSF or scalp and meninges classified as “gray matter” likely influenced results.
In our study, we set out to confirm whether regional differences in cortical gray matter are present in adult-onset patients with chronic schizophrenia compared with healthy subjects after editing nonbrain tissue from each MR volume and employing cortical pattern-matching methods to resolve individual differences in anatomy. The same methods were employed to examine the regional specificity of extracortical (sulcal and subarachnoid) CSF increases in schizophrenia. For both measures, the modulating effects of biological sex and age were examined. Diagnosis, sex, and aging effects were also examined for intracranial volumes, whole brain volumes (including sulcal CSF only), and intracranial gray matter, white matter, and CSF. Statistical relationships between measures were later assessed.
Method
Subjects
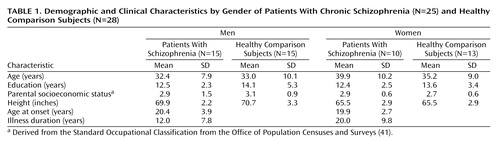
Twenty-five chronic schizophrenia patients (15 men and 10 women) and 28 healthy subjects (15 men and 13 women) were scanned at the Institute of Psychiatry in London. Other demographic and clinical details are summarized in Table 1. Groups did not differ significantly in age (range=20 to 58 years), years of education, height, or parental socioeconomic class. Duration of illness, however, was significantly longer in female than in male patients (t=2.26, df=23, p<0.03). Socioeconomic status was derived from the Office of Population Censuses and Surveys Standard Occupational Classification(41) using details of “best-ever” parental occupation. Both groups had one male and one female subject who were left-handed according to the Annett Handedness Scale (42). All schizophrenia patients met DSM-III-R criteria and were receiving regular antipsychotic medication. Healthy subjects were screened for any personal or family history of psychiatric illness. Exclusion criteria for both patients and comparison subjects were head trauma, drug abuse, and hereditary neurological disorders. All subjects gave informed written consent for participation with ethical permission obtained from the Bethlem and Maudsley Ethical Committee (Research).
Image Analysis Procedures
High-resolution three-dimensional spoiled gradient recall acquisition MR images (256×256 matrix; 20-cm field of view) were acquired on a GE Signa 1.5-T scanner as a series of 124 contiguous 1.5-mm coronal slices and were corrected for signal intensity inhomogeneities (43, 44). Nonbrain tissue including the scalp, bone, and meninges was manually edited from each brain slice such that only brain tissue and subarachnoid and sulcal CSF remained in each image volume (Figure 1). These scalp-edited MRI volumes were used to estimate intracranial brain volume and for tissue segmentation (45, 46) providing volumes of intracranial gray matter, white matter, and CSF in native scanner space. Brain volumes were also measured after including sulcal CSF only (i.e., without extrasulcal subarachnoid CSF). Reliability of manual scalp editing was determined by calculating the intraclass correlation coefficients for brain volumes from 10 test brains that were randomly mixed in among a larger data set and edited by the same raters (S.K. and D.A.). Intra- and interrater reliabilities of manual editing were excellent (r>0.99).
Cortical Surface Averaging
For interindividual and group comparisons of surface anatomy we used a two-point anterior-posterior commissure registration to correct for differences in the relative position and orientation of each brain volume and to place scalp-edited MR volumes into a common coordinate space as previously described (30, 47–49). This method for registering anatomy has been validated for comparing morphometry between normal and diseased populations (50–52).
Parametric models of the cortex were extracted from each MR volume (53) and used to outline 38 primary cortical sulci and fissures employing validated anatomic delineation protocols (http://www.loni.ucla.edu/~esowell/new_sulcvar.html) (38, 47, 54). Interrater reliability of manual outlining was measured as the three-dimensional root mean square difference in millimeters between 100 equidistant points from each sulcal landmark in six test brains that were traced by one rater (K.L.N.) and compared with a gold standard arrived at by a consensus of raters (E.R.S. and D.R.). Intrarater reliability was computed by comparing the three-dimensional root mean square distance between equidistant surface points from each sulcal landmark traced six times in one test brain by the same rater (K.L.N.). Three-dimensional root mean square distance was <2 mm, and on average <1 mm, for all landmarks within raters and relative to the gold standard.
Sulcal/gyral landmarks and the cortical surface models from each subject were used to compute a three-dimensional vector deformation field, which reconfigures each subject’s anatomy into the average pattern of a given group. Briefly, a surface-warping algorithm uses the sulcal landmarks as anchors to drive the surrounding cortical surface anatomy from each individual into correspondence. This surface-matching procedure records the amount of x, y, and z coordinate shift (or deformation) at all cortical surface points between individuals, thus associating homologous cortical regions between subjects (30, 49).
Tissue Proportion Measurements
The three-dimensional deformation vector fields obtained from the cortical pattern-matching methods allow a local measurement of gray matter or CSF to be made at equivalent three-dimensional cortical surface locations in each subject, referencing corresponding point locations in spatially registered tissue-classified, scalp-edited brain volumes (Figure 1). To quantify cortical gray matter, we measured the proportion (or density) of voxels segmenting as gray matter, relative to all other tissue types, within a sphere with a fixed radius of 15 mm, at homologous cortical surface points in each individual. Gray matter proportion measures thus represent values ranging from 0.0 (no gray matter voxels within the sphere) to 1.0 (all gray matter voxels) and provide a local estimate of gray matter volume within the cortical mantle in each individual. These measures are also consistent with postmortem cortical thickness distributions (55), where gray matter thickness depends on the relative development of pyramidal and granular cells in the cortical layers. Intermediate proportions of gray matter are observed in homotypical areas, higher indices of gray matter are observed in agranular regions, and lower indices of gray matter are observed in granular sensory regions (54, 56).
Extracortical CSF was estimated similarly by measuring the ratio of CSF voxels in the sulcal and subarachnoid space surrounding each cortical surface point, again using a sphere with a fixed radius of 15 mm. This measure thus estimates the amount of CSF in the sulcal and subarachnoid space at corresponding locations between individuals, with concentration again ranging from 0.0 to 1.0. For each point on the cortical surface, local measurements of gray matter or CSF were compared statistically between individuals to provide maps indexing extremely local differences in tissue proportions within and between groups (38, 54).
Statistical Analyses
To circumvent the need to correct for statistical comparisons made at each cortical surface location (65,536 surface points), we first examined whether overall changes in cortical gray matter or subarachnoid CSF tissue proportions were present in association with diagnosis, sex, or age. We used principal-component analyses to reduce tissue proportion values measured at homologous cortical surface locations in each individual into components that explained the maximum amount of possible variance in the data for cortical gray matter and subarachnoid CSF proportion measures separately. Scree plots in Figure 2 show the proportion of total variance accounted for by each of the principal components. The first components account for 58.9% and 21.5% of the total variance for subarachnoid CSF and cortical gray matter, respectively. Given the size of our study group, we decided a priori to examine only the first components. However, when the first component showed no schizophrenia effect, we performed follow-up tests on all components above the elbow (or bend) in the curve, as displayed in the Scree plots, to verify that negative results would have been obtained even with inclusion of additional components.
Factor scores from principal components were included as dependent variables in statistical analyses that used the general linear model. Diagnostic group (schizophrenia patients, healthy subjects) and sex (male, female) were included as categorical predictor variables, and age was included as a continuous predictor variable. All main effects and interactions between the predictor variables were included in the model. Only significant effects of principal-component analysis scores for either CSF or gray matter were followed up with statistical comparisons of tissue proportions at each cortical surface location to show the regional specificity of gray matter or CSF effects surrounding the cortex in three dimensions. Specifically, to identify regional differences, in tissue proportions between diagnostic groups, we used Student’s t tests to compare gray matter or CSF measures at each cortical surface point. Pearson correlation coefficients were used to assess associations between tissue proportion measures and age. The results of these tests were mapped onto three-dimensional, group-averaged cortical surface models by using the deformation fields described previously and colored to index statistically significant results.
We employed the same general linear model described for principal-component analysis factor scores to examine the effects of the predictor variables on intracranial, whole brain, and intracranial gray matter, white matter, and CSF volumes. Tissue volumes were corrected for individual differences in brain size by multiplying the ratio of the average intracranial volume to the individual’s intracranial volume. Finally, Pearson correlation coefficients were used to describe the relationships among principal-component analysis scores and brain tissue volumes. For all analyses, a two-tailed alpha level of 0.05 was used as the threshold for statistical significance.
Results
Intracranial, Brain, and Tissue Volumes
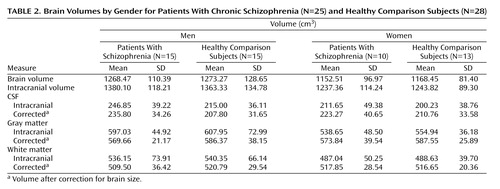
Table 2 shows intracranial, whole brain, and intracranial tissue and CSF volumes (cm3), before and after correction for brain size, in groups defined by sex and diagnosis. Main effects of sex (larger volumes in male subjects) were observed for intracranial volume (F=5.49, df=1, 45, p<0.02) and whole brain volume (F=10.85, df=1, 45, p<0.002), with no other significant effects noted. Gray matter volumes showed significant main effects of age (F=50.09, df=1, 45, p<0.0001), a sex-by-diagnostic group interaction (F=5.17, df=1, 45, p<0.02), and a three-way interaction between diagnosis, sex, and age (F=4.13, df=1, 45, p<0.04). Figure 3 shows a decrease in gray matter with age, although male schizophrenia patients possess smaller gray matter volumes even in young adulthood. A complementary pattern of results was observed for intracranial CSF volumes for which significant age (F=9.03, df=1, 45, p<0.004), diagnosis-by-sex (F=5.94, df=1, 45, p<0.01), sex-by-age (F=5.98, df=1, 45, p<0.01), and diagnosis-by-sex-by-age (F=4.68, df=1, 45, p<0.03) effects were detected. Figure 3 also shows that male schizophrenia patients exhibited CSF volumes similar to those of older comparison subjects and female patients. White matter volumes showed significant increases with age (F=4.81, df=1, 45, p<0.03) (Figure 3).
Subarachnoid CSF and Cortical Gray Matter Principal-Component Analysis Scores
Subarachnoid CSF factor scores from the first principal-component analysis showed significant main effects of diagnosis (F=3.97, df=1, 45, p<0.05), age (F=9.36, df=1, 45, p<0.003), and sex (F=10.81, df=1, 45, p<0.002). Significant interaction effects were also observed for diagnostic group and age (F=4.82, df=1, 45, p<0.03), diagnostic group and sex (F=8.98, df=1, 45, p<0.01), sex and age (F=8.98, df=1, 45, p<0.004), and diagnostic group, sex, and age (F=7.15, df=1, 45, p<0.01). Figure 4 shows greater sulcal and subarachnoid CSF scores in older subjects, although male patients exhibited larger subarachnoid CSF scores even in young adulthood.
First component cortical gray matter factor scores showed a main effect of age only (F=15.32, df=1, 45, p<0.0003). Since schizophrenia effects were absent, the same analyses were performed for principal-component analysis components accounting for a lesser percentage of the total variance but falling above the elbow of the Scree plot (Figure 2). We did not observe any significant effects of diagnosis, age, or sex, or any two- or three-way interactions for any of the remaining six components analyzed individually or in combination, using repeated-measures analysis of variance. Figure 4 plots raw cortical gray matter principal-component analysis scores from the first principal component.
Statistical Mapping of Subarachnoid CSF and Cortical Gray Matter Proportions
To isolate regional differences in subarachnoid CSF and cortical gray matter, we compared tissue proportion measures at each three-dimensional cortical surface location between diagnostic groups and in association with age. Simple effects of age were mapped within groups defined by diagnosis and sex to follow up the significant diagnosis-by-sex-by-age interaction observed for subarachnoid CSF principal-component analysis scores. Probability values, indexed in color, were mapped back onto a group-averaged cortical surface model at each three-dimensional point location.
Figure 5 shows regional subarachnoid CSF proportion increases 1) in schizophrenia patients relative to healthy subjects, 2) in association with age across all groups, and 3) in association with age in groups defined by sex and diagnosis. Significant left hemisphere CSF increases were present surrounding the superior temporal gyrus and perisylvian, inferior frontal, and parietal cortices in the schizophrenia patients. In the right hemisphere, significant subarachnoid CSF increases were pronounced surrounding the Sylvian fissure and anterior temporal lobe. Significant linear relationships between CSF increases and age were widely distributed surrounding dorsolateral prefrontal and parietal heteromodal association cortices. These effects were similar when simple effects of age were mapped within groups defined by sex and diagnosis. Male patients with schizophrenia, however, failed to exhibit significant regional CSF increases in association with age, as consistent with the principal-component analysis results.
Figure 6 shows the same probability maps for cortical gray matter proportion measurements. Significant regional gray matter reductions, mapped at each cortical surface location in three dimensions, appeared small and spatially diffuse in schizophrenia patients relative to healthy subjects, consistent with the principal-component analysis results. Linear reductions in cortical gray matter occurred in association with age in dorsolateral prefrontal and parietal association cortices. Simple effects for age showed similar although less pervasive regional gray matter reductions in association with age within each group. However, in spite of the negative three-way interaction for cortical gray matter principal-component analysis scores, male patients appeared to exhibit less regional gray matter reductions with age in comparison with the other groups.
Relationships Between Volumes and Principal-Component Analysis Scores
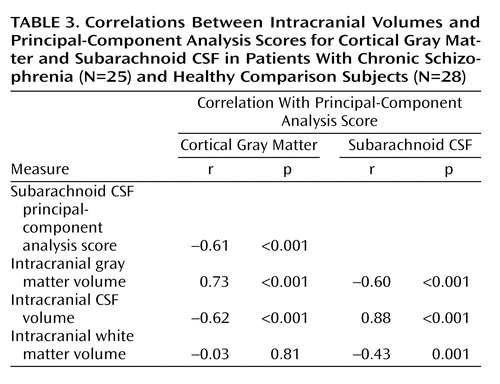
Table 3 lists Pearson’s correlation coefficients and probability values showing relationships between intracranial volumes and factor scores from the first principal components. Subarachnoid CSF and cortical gray matter factor scores were correlated with each other and with intracranial tissue volumes. Gray matter factor scores and overall white matter volumes failed to show significant associations.
Discussion
We aimed to confirm the regional specificity of cortical gray matter deficits in chronic schizophrenia and to establish whether sex and age, shown to influence brain tissue distributions in normal individuals (23, 26, 57), interact with the disease processes contributing to these abnormalities. Reciprocal relationships between gray matter decreases and extracortical CSF increases are shown during normal aging (26, 58, 59). Regional increases in extracortical CSF may thus also serve to predict where brain tissue is lost during disease and to determine whether normal aging effects are disturbed in schizophrenia. Although some previous reports suggest that increases in sulcal CSF are pronounced in temporal and frontal regions in schizophrenia (6, 7, 60), no prior study has characterized regional CSF increases in the sulcal and subarachnoid space surrounding the entire cerebral cortex in patients with schizophrenia relative to healthy subjects. We therefore additionally examined effects of diagnosis, sex, and age for local extracortical CSF measures.
Results showed that schizophrenia patients exhibit significantly larger proportions of extracortical CSF relative to healthy subjects and that sex and age significantly interact with disease effects when CSF measures are reduced using principal components analysis. In spite of strong negative associations between gray matter and subarachnoid CSF factor scores from the first components of the principal-components analysis (Table 3), only main effects of age were observed for first component gray matter scores. Scree plots, however, emphasize that the dimensionality of variance influencing cortical gray matter reductions is higher than the dimensionality of variance contributing to CSF increases (Figure 2). Since the first component for cortical gray matter accounted for only 21.5% of the total variance and failed to reveal significant schizophrenia effects, we analyzed the six components remaining above the elbow of the Scree plot. These components also failed to show significant schizophrenia effects for cortical gray matter. Results suggest, therefore, that while possibly still present, schizophrenia effects and interactions between diagnosis, age, and sex are lost among a multitude of other effects that alter global patterns of gray matter concentration. Such effects could include clinical symptoms (61), cognitive deficits (62), medications, a family history of schizophrenia (63), or other unknown genetic or environmental insults. Unfortunately, it was either not possible or not pragmatic to dissociate the contributing effects of these variables given the relatively small size of our study groups.
Regional Increases in Subarachnoid CSF
To identify local increases in subarachnoid and sulcal CSF in schizophrenia and the modulating effects of sex and age, we compared local CSF to brain tissue ratios at thousands of homologous points surrounding the cortical surface between individuals. Schizophrenia-related CSF increases were observed surrounding perisylvian cortices, including bilateral superior temporal gyrus, and were more widely distributed in the left hemisphere. Extracortical CSF increases observed in association with advancing age were pronounced surrounding frontal and parietal association cortices, as consistent with established findings (23, 26, 57). Female schizophrenia patients showed aging effects similar to healthy subjects. Male patients, however, exhibited increased CSF even in young adulthood. Only longitudinal follow-up studies, however, can confirm that age-related increases in CSF are disturbed in male patients. Both principal-component analyses and statistical mapping results, however, make clear that age and biological sex are important predictors of extracortical CSF enlargements in schizophrenia.
Regional Cortical Gray Matter Deficits
MRI studies employing volumetric methods have shown gray matter deficits in almost all cortical regions in schizophrenia, although reductions in temporal cortices, and to a lesser extent, in subregions of the parietal and frontal lobes, are most replicated (3, 10, 16, 21, 64). Similarly, gray matter deficits in the orbitofrontal (20, 63) and medial frontal cortices (19, 20, 61, 65) as well as the superior temporal gyrus and the temporal poles (19, 20, 61) have been identified by using voxel-based morphometry, although coordinate locations have varied between studies. In our study, gray matter deficits were not significant when measures were reduced using principal-component analysis. When gray matter proportion comparisons were made at each cortical location, however, some small and spatially diffuse cortical gray matter reductions were observed in frontal and parietal association cortices and within the right posterior superior temporal gyrus (Figure 6). These results may conflict with previous schizophrenia studies observing focal gray matter deficits in the superior temporal gyrus (3).
In the same study groups, we previously measured cortical gray matter volumes in discrete lobar regions using manual delineation procedures (56). Only marginal reductions in cortical gray matter volumes were observed in the temporal lobes (p<0.08, two-tailed) in schizophrenia, results that are not inconsistent with our current findings. However, in a more refined region of interest study, we found significant hippocampal volume reductions, again in the same schizophrenia study group (48), as in line with most prior reports (3, 17). Differences between manual delineation results and those obtained in this study are likely attributable to sampling radius chosen for measuring local tissue proportions within the cortical mantle. That is, gray matter measurements from the most medial parts of the temporal lobes, including the hippocampus proper and gray matter voxels from beds of deep cortical fissures, fell outside of the 15-mm measurement radius used for gray matter sampling (Figure 1). Likewise, differences in subcortical gray matter and surrounding the medial surface of the brain as well as the deep surfaces of the insula were not examined in our investigation in which tissue proportions were compared only within the cortical mantle.
Also in contrast with our findings, Cannon et al. (39) reported highly significant gray matter deficits in large and partially nonoverlapping areas of prefrontal and temporal heteromodal association cortices in schizophrenia probands and their unaffected co-twins relative to healthy subjects, using the same general methodological approach as employed in our study. Image preprocessing steps, however, were different in this prior investigation. Specifically, image volumes were not scalp-edited before obtaining gray matter proportion measures at each cortical location. Increases in extracortical CSF and “gray” matter voxels from nonbrain tissue in unedited MR volumes may largely influence local tissue proportion measurements obtained from each individual (Figure 1). This has been demonstrated previously where cortical gray results appear to more closely reflect extracortical CSF changes in unedited MR volumes (56).
Intracranial Tissue Volumes
As universally reported in the normative literature, male subjects possessed significantly larger brain volumes than did female subjects, although sex effects were absent for intracranial tissue volumes after brain size correction. Also confirming established reports, linear decreases in gray matter and complementary increases in CSF volume were observed during normal aging, and intracranial white matter volumes increased with age (23, 26, 57, 59, 65, 66). Significant interactions between diagnostic group, sex, and age were present for intracranial gray matter and CSF volumes with effects similar to those observed for subarachnoid CSF principal-component analysis scores. Results again suggested the presence of premature aging processes in male schizophrenia patients. These results are compatible with observations of accelerated gray matter losses within 2–4 years following disease onset (36, 37, 67, 68). Although results from a large cross-sectional study spanning five decades suggest that steeper aging effects occur in older patients with schizophrenia (37), the age range of our study groups prevented cross-sectional investigation of such effects.
Our results are consistent with the majority of studies in the published literature that show small, although often nonsignificant, reductions in whole brain volume in schizophrenia patients relative to healthy subjects (3, 10, 11, 22). However, with the inclusion of subarachnoid CSF, intracranial volumes were marginally increased in male patients relative to healthy subjects. These results are consistent with prior studies, where increases, or decreases less pronounced than for brain volumes only, are reported for intracranial volumes in schizophrenia patients compared with healthy subjects (10). Moreover, when CSF to whole brain ratios (or CSF to gray matter ratios) are compared, disease effects are invariably larger than for whole brain volumes or gray matter volumes alone (6, 9, 33).
In normal development, intracranial size appears driven by brain volume expansion until adolescence, when brain growth peaks, with gray matter growth peaking slightly earlier (58). After adolescence, intracranial size stabilizes, although extracortical CSF increases as whole brain volume and gray matter decline. In our study, schizophrenia-related gray matter deficits were of lesser magnitude than extracortical CSF increases. Extracortical CSF increases, therefore, although significantly correlated with gray matter reductions, appeared not completely at the expense of gray matter loss. Similarly, increases in CSF in patients could not be attributed to changes in white matter volumes that increased with age and showed no diagnostic group effects. It may be possible, however, that patients possess an excess of gray matter early in development that decreases over time to just below the normal threshold, therefore accounting for the larger extracortical CSF increases observed later in development in schizophrenia patients relative to healthy subjects. Of interest is that gray matter increases have been reported in childhood-onset schizophrenia patients, although these increases appear to decrease rapidly over time (40, 69). Gray matter increases in early-onset schizophrenia patients have been observed in temporal lobe regions, the same regions showing regional subarachnoid CSF increases in our study.
Methodological Considerations
Although manual delineation measurements are still considered the gold standard for obtaining reliable regions of interest measures (70), computerized brain mapping methods may offer improved spatial sensitivity for localizing small differences in tissue distributions between groups. That is, global as well as local differences in cortical and subcortical tissue can be examined simultaneously with these methods (71). Moreover, individual differences in brain size, shape, and tissue distributions may be taken into account. For example, voxel-based morphometry methods allow voxel-wise comparisons to be made throughout the entire brain volume after registering and transforming tissue-classified MR data into a standard stereotaxic space (19, 72). Like voxel-based morphometry, our methodological approach utilizes registration of MR data, requires tissue classification, applies smoothing procedures, and provides results in the form of statistical maps. In contrast to voxel-based morphometry, which requires the underlying automated registration method to be imprecise in order to generate a measurable signal (73), our computational cortical matching methods are able to align the surface anatomy as precisely as posible using manually delineated features without compromising the resulting signal. The reliance on manual delineation should be advantageous to the extent that automated registration methods may fail to correctly identify pertinent homologies but may also be disadvantageous to the extent that the results are susceptible to human error (71).
Tissue measurements obtained after using cortical pattern-matching algorithms, however, are constrained by the size of the sphere used to sample local tissue proportions at the same spatial locations between individuals. In this study, we chose a 15-mm kernel size to increase signal to noise for local tissue measurements (30, 54, 74, 75). We also chose this kernel size because it captures all voxels within the subarachnoid space, so regional differences in extracortical CSF can be compared between groups. Validations between tissue proportion measurements using this kernel size and manual delineation procedures have been shown previously. Specifically, Sowell et al. (54) demonstrated that when the manually delineated region of interest is small and at the same cortical surface location, measures of gray matter concentration and gray matter volume are similar.
Conclusions
Although significantly correlated, increases in sulcal and subarachnoid CSF appear a more robust neuroanatomical correlate of schizophrenia than reductions in cortical gray matter. Increased extracortical CSF in the absence of significant brain size or gray matter reductions may implicate disturbed developmental processes resulting from an initial increase in brain tissue, particularly in temporal lobe regions, although this hypothesis remains to be confirmed in follow-up investigations. Overall, patients with chronic schizophrenia showed only small and spatially diffuse regional reductions in cortical gray matter compared with healthy subjects, although regionally specific sulcal and subarachnoid CSF increases were observed that were strongly influenced by biological sex and age. If CSF occupies the intracranial space where tissue is lost, brain tissue (gray matter or white matter) may be lost prematurely in male patients. Only longitudinal studies, however, may confirm disturbed aging effects in male patients. Finally, small effect sizes observed in earlier investigations (10, 11) may further indicate that the power to detect local gray matter deficits between diagnostic groups requires larger sample sizes or that other factors in addition to sex and age contribute to cortical gray matter deficits in schizophrenia.
 |
 |
 |
Received Nov. 16, 2002; revision received March 19, 2003; accepted March 31, 2003. From the Laboratory of Neuro Imaging, Department of Neurology, Division of Brain Mapping, UCLA School of Medicine; and the Clinical Neuroscience Research Centre, Dartford, Kent, U.K. Address reprint requests to Dr. Toga, Laboratory of Neuro Imaging, Department of Neurology, Division of Brain Mapping, UCLA School of Medicine, 710 Westwood Plaza, Los Angeles, CA 90095-1769; [email protected] (e-mail). Supported by research grants from the National Center for Research Resources (RR-13642, RR-00865) and the National Library of Medicine (LM-05639) as well as an NIMH National Research Service Award Training Grant (MH-14584).

Figure 1. Method for Measuring Brain Tissue and CSF Volumesa
aLocal measurements of gray matter and CSF were made at thousands of equivalent three-dimensional cortical surface locations in each subject, referencing corresponding point locations in spatially registered tissue-classified, scalp-edited brain volumes. The top right image shows a tissue-classified brain slice before removal of extracortical tissue. The bottom right image shows a tissue-classified brain slice after removal of scalp, bone, and meninges.

Figure 2. Total Variance in Cortical Gray Matter and Subarachnoid CSF Associated With Each Principal Component for Patients With Chronic Schizophrenia (N=25) and Healthy Comparison Subjects (N=28)

Figure 3. Relationship by Gender Between Brain Size-Corrected Intracranial Volumes and Age in Patients With Chronic Schizophrenia (N=25) and Healthy Comparison Subjects (N=28)

Figure 4. Relationship by Gender Between Age and Principal-Component Analysis Scores for Subarachnoid CSF and Cortical Gray Matter in Patients With Chronic Schizophrenia (N=25) and Healthy Comparison Subjects (N=28)

Figure 5. Effects of Age, Gender, and Diagnosis on Extracortical CSF Increases in Patients With Chronic Schizophrenia (N=25) and Healthy Comparison Subjects (N=28)

Figure 6. Effects of Age, Gender, and Diagnosis on Gray Matter Reductions in Patients With Chronic Schizophrenia (N=25) and Healthy Comparison Subjects (N=28)
1. Chua SE, McKenna PJ: Schizophrenia: a brain disease? a critical review of structural and functional cerebral abnormality in the disorder. Br J Psychiatry 1995; 166:563–582Crossref, Medline, Google Scholar
2. Vita A, Dieci M, Giobbio GM, Tenconi F, Invernizzi G: Time course of cerebral ventricular enlargement in schizophrenia supports the hypothesis of its neurodevelopmental nature. Schizophr Res 1997; 23:25–30Crossref, Medline, Google Scholar
3. Shenton ME, Dickey CC, Frumin M, McCarley RW: A review of MRI findings in schizophrenia. Schizophr Res 2001; 49:1–52Crossref, Medline, Google Scholar
4. Johnstone EC, Crow TJ, Frith CD, Stevens M, Kreel L, Husband J: The dementia of dementia praecox. Acta Psychiatr Scand 1978; 57:305–324Crossref, Medline, Google Scholar
5. Northoff G, Waters H, Mooren I, Schluter U, Diekmann S, Falkai P, Bogerts B: Cortical sulcal enlargement in catatonic schizophrenia: a planimetric CT study. Psychiatry Res 1999; 91:45–54Crossref, Medline, Google Scholar
6. Cannon TD, van Erp TGM, Huttunen M, Lönnqvist J, Salonen O, Valanne L, Poutanen V-P, Standertskjöld-Nordenstam C-G, Gur RE, Yan M: Regional grey matter, white matter, and cerebrospinal fluid distributions in schizophrenic patients, their siblings, and controls. Arch Gen Psychiatry 1998; 55:1084–1091Crossref, Medline, Google Scholar
7. Sullivan EV, Lim KO, Mathalon D, Marsh L, Beal DM, Harris D, Hoff AL, Faustman WO, Pfefferbaum A: A profile of cortical gray matter volume deficits characteristic of schizophrenia. Cereb Cortex 1998; 8:117–124Crossref, Medline, Google Scholar
8. Andreasen NC, Flashman L, Flaum M, Arndt S, Swayze V II, O’Leary DS, Ehrhardt JC, Yuh WTC: Regional brain abnormalities in schizophrenia measured with magnetic resonance imaging. JAMA 1994; 272:1763–1769Crossref, Medline, Google Scholar
9. Woods BT, Yurgelun-Todd D, Goldstein JM, Seidman LJ, Tsuang MT: MRI brain abnormalities in chronic schizophrenia: one process or more? Biol Psychiatry 1996; 40:585–596Crossref, Medline, Google Scholar
10. Lawrie SM, Abukmeil SS: Brain abnormality in schizophrenia: a systematic and quantitative review of volumetric magnetic resonance imaging studies. Br J Psychiatry 1998; 172:110–120Crossref, Medline, Google Scholar
11. Wright IC, Rabe-Hesketh S, Woodruff PWR, David AS, Murray RM, Bullmore ET: Meta-analysis of regional brain volumes in schizophrenia. Am J Psychiatry 2000; 157:16–25Link, Google Scholar
12. Harrison PJ: The neuropathology of schizophrenia: a critical review of the data and their interpretation. Brain 1999; 122:593–624Crossref, Medline, Google Scholar
13. Menon RR, Barta PE, Aylward EH, Richards SS: Posterior superior temporal gyrus in schizophrenia: grey matter changes and clinical correlates. Schizophr Res 1995; 16:127–135Crossref, Medline, Google Scholar
14. Gur RE, Turetsky BI, Cowell PE, Finkelman C, Maany V, Grossman RI, Arnold SE, Bilker WB, Gur RC: Temporolimbic volume reductions in schizophrenia. Arch Gen Psychiatry 2000; 57:769–775Crossref, Medline, Google Scholar
15. Hirayasu Y, Shenton ME, Salisbury DF, Dickey CC, Fischer IA, Mazzoni P, Kisler T, Arakaki H, Kwon JS, Anderson JE, Yurgelun-Todd D, Tohen M, McCarley R: Lower left temporal lobe MRI volumes in patients with first-episode schizophrenia compared with psychotic patients with first-episode affective disorder and normal subjects. Am J Psychiatry 1998; 155:1384–1391Link, Google Scholar
16. Sanfilipo M, Lafargue T, Rusinek H, Arena L, Loneragan C, Lautin A, Feiner D, Rotrosen J, Wolkin A: Volumetric measure of the frontal and temporal lobe regions in schizophrenia: relationship to negative symptoms. Arch Gen Psychiatry 2000; 57:471–480Crossref, Medline, Google Scholar
17. Nelson MD, Saykin AJ, Flashman LA, Riordan HJ: Hippocampal volume reduction in schizophrenia as assessed by magnetic resonance imaging: a meta-analytic study. Arch Gen Psychiatry 1998; 55:443–440Crossref, Medline, Google Scholar
18. Narr KL, van Erp TG, Cannon TD, Woods RP, Thompson PM, Jang S, Blanton R, Poutanen VP, Huttunen M, Lonnqvist J, Standerksjöld-Nordenstam CG, Kaprio J, Mazziotta JC, Toga AW: A twin study of genetic contributions to hippocampal morphology in schizophrenia. Neurobiol Dis 2002; 11:83–95Crossref, Medline, Google Scholar
19. Wilke M, Kaufmann C, Grabner A, Putz B, Wetter TC, Auer DP: Gray matter-changes and correlates of disease severity in schizophrenia: a statistical parametric mapping study. Neuroimage 2001; 13:814–824Crossref, Medline, Google Scholar
20. Wright IC, Ellison ZR, Sharma T, Friston KJ, Murray RM, McGuire PK: Mapping of grey matter changes in schizophrenia. Schizophr Res 1999; 35:1–14Crossref, Medline, Google Scholar
21. Goldstein JM, Goodman JM, Seidman LJ, Kennedy DN, Makris N, Lee H, Tourville J, Caviness VS Jr, Faraone SV, Tsuang MT: Cortical abnormalities in schizophrenia identified by structural magnetic resonance imaging. Arch Gen Psychiatry 1999; 56:537–547Crossref, Medline, Google Scholar
22. Ward KE, Friedman L, Wise A, Schulz SC: Meta-analysis of brain and cranial size in schizophrenia. Schizophr Res 1996; 22:197–213Crossref, Medline, Google Scholar
23. Good CD, Johnsrude I, Ashburner J, Henson RN, Friston KJ, Frackowiak RS: Cerebral asymmetry and the effects of sex and handedness on brain structure: a voxel-based morphometric analysis of 465 normal adult human brains. Neuroimage 2001; 14:685–700Crossref, Medline, Google Scholar
24. Witelson SF, Kigar DL: Sylvian fissure morphology and asymmetry in men and women: bilateral differences in relation to handedness in men. J Comp Neurol 1992; 323:326–340Crossref, Medline, Google Scholar
25. Wisniewski AB: Sexually-dimorphic patterns of cortical asymmetry, and the role for sex steroid hormones in determining cortical patterns of lateralization. Psychoneuroendocrinology 1998; 23:519–547Crossref, Medline, Google Scholar
26. Coffey CE, Lucke JF, Saxton JA, Ratcliff G, Unitas LJ, Billig B, Bryan RN: Sex differences in brain aging: a quantitative magnetic resonance imaging study. Arch Neurol 1998; 55:169–179Crossref, Medline, Google Scholar
27. Witelson SF: Hand and sex differences in the isthmus and genu of the human corpus callosum: a postmortem morphological study. Brain 1989; 112:799–835Crossref, Medline, Google Scholar
28. Clarke JM, Zaidel E: Anatomical-behavioral relationships: corpus callosum morphometry and hemispheric specialization. Behav Brain Res 1994; 64:185–202Crossref, Medline, Google Scholar
29. Baare WF, van Oel CJ, Hulshoff Pol HE, Schnack HG, Durston S, Sitskoorn MM, Kahn RS: Volumes of brain structures in twins discordant for schizophrenia. Arch Gen Psychiatry 2001; 58:33–40Crossref, Medline, Google Scholar
30. Thompson PM, Cannon TD, Narr KL, van Erp T, Poutanen VP, Huttunen M, Lonnqvist J, Standertskjold-Nordenstam CG, Kaprio J, Khaledy M, Dail R, Zoumalan CI, Toga AW: Genetic influences on brain structure. Nat Neurosci 2001; 4:1253–1258Crossref, Medline, Google Scholar
31. Gur RE, Petty RG, Turetsky BI, Gur RC: Schizophrenia throughout life: sex differences in severity and profile of symptoms. Schizophr Res 1996; 21:1–12Crossref, Medline, Google Scholar
32. Goldstein JM, Seidman LJ, O’Brien LM, Horton NJ, Kennedy DN, Makris N, Caviness VS Jr, Faraone SV, Tsuang MT: Impact of normal sexual dimorphisms on sex differences in structural brain abnormalities in schizophrenia assessed by magnetic resonance imaging. Arch Gen Psychiatry 2002; 59:154–164Crossref, Medline, Google Scholar
33. Gur RE, Mozley PD, Resnick SM, Shtasel D, Kohn M, Zimmerman R, Herman G, Atlas S, Grossman R, Erwin R, et al: Magnetic resonance imaging in schizophrenia, I: volumetric analysis of brain and cerebrospinal fluid. Arch Gen Psychiatry 1991; 48:407–412Crossref, Medline, Google Scholar
34. DeLisi LE, Tew W, Xie S-h, Hoff AL, Sakuma M, Kushner M, Lee G, Shedlack K, Smith AM, Grimson R: A prospective follow-up study of brain morphology and cognition in first-episode schizophrenic patients: preliminary findings. Biol Psychiatry 1995; 38:349–360Crossref, Medline, Google Scholar
35. Davis KL, Buchsbaum MS, Shihabuddin L, Spiegel-Cohen J, Metzger M, Frecska E, Keefe RS, Powchik P: Ventricular enlargement in poor-outcome schizophrenia. Biol Psychiatry 1998; 43:783–793Crossref, Medline, Google Scholar
36. Gur RE, Cowell P, Turetsky BI, Gallacher F, Cannon T, Bilker W, Gur RC: A follow-up magnetic resonance imaging study of schizophrenia: relationship of neuroanatomical changes to clinical and neurobehavioral measures. Arch Gen Psychiatry 1998; 55:145–152Crossref, Medline, Google Scholar
37. Hulshoff Pol HE, Schnack HG, Bertens MGBC, van Haren NEM, van der Tweel I, Staal WG, Baaré WFC, Kahn RS: Volume changes in gray matter in patients with schizophrenia. Am J Psychiatry 2002; 159:244–250Link, Google Scholar
38. Thompson PM, Vidal C, Giedd JN, Gochman P, Blumenthal J, Nicolson R, Toga AW, Rapoport JL: Mapping adolescent brain change reveals dynamic wave of accelerated gray matter loss in very early-onset schizophrenia. Proc Natl Acad Sci USA 2001; 98:11650–11655Crossref, Medline, Google Scholar
39. Cannon TD, Thompson PM, van Erp TG, Toga AW, Poutanen VP, Huttunen M, Lonnqvist J, Standerskjold-Nordenstam CG, Narr KL, Khaledy M, Zoumalan CI, Dail R, Kaprio J: Cortex mapping reveals regionally specific patterns of genetic and disease-specific gray-matter deficits in twins discordant for schizophrenia. Proc Natl Acad Sci USA 2002; 99:3228–3233Crossref, Medline, Google Scholar
40. Jacobsen LK, Giedd JN, Vaituzis AC, Hamburger SD, Rajapakse JC, Frazier JA, Kaysen D, Lenane MC, McKenna K, Gordon CT, Rapoport JL: Temporal lobe morphology in childhood-onset schizophrenia. Am J Psychiatry 1996; 153:355–361; correction, 153:851Link, Google Scholar
41. Office of Population Censuses and Surveys: Standard Occupational Classification, 3 vols. London, Her Majesty’s Stationery Office, 1991Google Scholar
42. Annett M: A classification of hand preference by association analysis. Br J Psychol 1970; 61:303–321Crossref, Medline, Google Scholar
43. Zijdenbos AP, Dawant BM: Brain segmentation and white matter lesion detection in MR images. Crit Rev Biomed Eng 1994; 22:401–465Medline, Google Scholar
44. Sled JG, Pike GB: Standing-wave and RF penetration artifacts caused by elliptic geometry: an electrodynamic analysis of MRI. IEEE Trans Med Imaging 1998; 17:653–662Crossref, Medline, Google Scholar
45. Shattuck DW, Sandor-Leahy SR, Schaper KA, Rottenberg DA, Leahy RM: Magnetic resonance image tissue classification using a partial volume model. Neuroimage 2001; 13:856–876Crossref, Medline, Google Scholar
46. Shattuck DW, Leahy RM: BrainSuite: an automated cortical surface identification tool. Med Image Anal 2002; 6:129–142Crossref, Medline, Google Scholar
47. Narr KL, Thompson PM, Sharma T, Moussai J, Zoumalan C, Rayman J, Toga AW: Three-dimensional mapping of gyral shape and cortical surface asymmetries in schizophrenia: gender effects. Am J Psychiatry 2001; 158:244–255Link, Google Scholar
48. Narr K, Thompson PM, Sharma T, Moussai J, Blanton R, Anvar B, Edris A, Krupp R, Rayman J, Toga AW: 3D mapping of temporo-limbic regions and the lateral ventricles in schizophrenia. Biol Psychiatry 2001; 50:84–97Crossref, Medline, Google Scholar
49. Thompson PM, Woods RP, Mega MS, Toga AW: Mathematical/computational challenges in creating deformable and probabilistic atlases of the human brain. Hum Brain Mapp 2000; 9:81–92Crossref, Medline, Google Scholar
50. Thompson PM, Schwartz C, Toga AW: High-resolution random mesh algorithms for creating a probabilistic 3D surface atlas of the human brain. Neuroimage 1996; 3:19–34Crossref, Medline, Google Scholar
51. Thompson PM, Toga AW: Anatomically-driven strategies for high-dimensional brain image warping and pathology detection, in Brain Warping. Edited by Toga AW. San Diego, Academic Press, 1998, pp 311–336Google Scholar
52. Thompson PM, Moussai J, Zohoori S, Goldkorn A, Khan AA, Mega MS, Small GW, Cummings JL, Toga AW: Cortical variability and asymmetry in normal aging and Alzheimer’s disease. Cereb Cortex 1998; 8:492–509Crossref, Medline, Google Scholar
53. MacDonald D, Avis D, Evans AC: Multiple surface identification and matching in magnetic resonance imaging. Proceedings of the International Society for Optical Engineering 1994; 2359:160–169Google Scholar
54. Sowell ER, Thompson PM, Rex D, Kornsand D, Tessner KD, Jernigan TL, Toga AW: Mapping sulcal pattern asymmetry and local cortical surface gray matter distribution in vivo: maturation in perisylvian cortices. Cereb Cortex 2002; 12:17–26Crossref, Medline, Google Scholar
55. Economo C, Parker S: The Cytoarchitectonics of the Human Cerebral Cortex. London, Humphrey Milford, Oxford University Press, 1929Google Scholar
56. Narr KL: Mapping brain abnormalities in schizophrenia: hemispheric, gender and genetic effects, in Neuroscience. Los Angeles, UCLA, 2002, p 467Google Scholar
57. Magnotta VA, Andreasen NC, Schultz SK, Harris G, Cizadlo T, Heckel D, Nopoulos P, Flaum M: Quantitative in vivo measurement of gyrification in the human brain: changes associated with aging. Cereb Cortex 1999; 9:151–160Crossref, Medline, Google Scholar
58. Courchesne E, Chisum HJ, Townsend J, Cowles A, Covington J, Egaas B, Harwood M, Hinds S, Press GA: Normal brain development and aging: quantitative analysis at in vivo MR imaging in healthy volunteers. Radiology 2000; 216:672–682Crossref, Medline, Google Scholar
59. Jernigan TL, Archibald SL, Berhow MT, Sowell ER, Foster DS, Hesselink JR: Cerebral structure on MRI, part I: localization of age-related changes. Biol Psychiatry 1991; 29:55–67Crossref, Medline, Google Scholar
60. Zipursky RB, Marsh L, Lim KO, DeMent S, Shear PK, Sullivan EV, Murphy GM, Csernansky JG, Pfefferbaum A: Volumetric MRI assessment of temporal lobe structures in schizophrenia. Biol Psychiatry 1994; 35:501–516Crossref, Medline, Google Scholar
61. Sigmundsson T, Suckling J, Maier M, Williams SCR, Bullmore ET, Greenwood KE, Fukuda R, Ron MA, Toone BK: Structural abnormalities in frontal, temporal, and limbic regions and interconnecting white matter tracts in schizophrenic patients with prominent negative symptoms. Am J Psychiatry 2001; 158:234–243Link, Google Scholar
62. Baare WFC, Hulshoff Pol HE, Hijman R, Mali WPT, Viergever MA, Kahn RS: Volumetric analysis of frontal lobe regions in schizophrenia: relation to cognitive function and symptomatology. Biol Psychiatry 1999; 45:1597–1605Crossref, Medline, Google Scholar
63. Ananth H, Popescu I, Critchley HD, Good CD, Frackowiak RSJ, Dolan RJ: Cortical and subcortical gray matter abnormalities in schizophrenia determined through structural magnetic resonance imaging with optimized volumetric voxel-based morphometry. Am J Psychiatry 2002; 159:1497–1505Link, Google Scholar
64. Gur RE, Cowell PE, Latshaw A, Turetsky BI, Grossman RI, Arnold SE, Bilker WB, Gur RC: Reduced dorsal and orbital prefrontal gray matter volumes in schizophrenia. Arch Gen Psychiatry 2000; 57:761–768Crossref, Medline, Google Scholar
65. Raz N, Gunning FM, Head D, Dupuis JH, McQuain J, Briggs SD, Loken WJ, Thornton AE, Acker JD: Selective aging of the human cerebral cortex observed in vivo: differential vulnerability of the prefrontal gray matter. Cereb Cortex 1997; 7:268–282Crossref, Medline, Google Scholar
66. Symonds LL, Archibald SL, Grant I, Zisook S, Jernigan TL: Does an increase in sulcal or ventricular fluid predict where brain tissue is lost? J Neuroimaging 1999; 9:201–209Crossref, Medline, Google Scholar
67. DeLisi LE, Sakuma M, Tew W, Kushner M, Hoff AL, Grimson R: Schizophrenia as a chronic active brain process: a study of progressive brain structural change subsequent to the onset of schizophrenia. Psychiatry Res Neuroimaging 1997; 74:129–140Crossref, Medline, Google Scholar
68. Mathalon DH, Sullivan EV, Lim KO, Pfefferbaum A: Progressive brain volume changes and the clinical course of schizophrenia in men: a longitudinal magnetic resonance imaging study. Arch Gen Psychiatry 2001; 58:148–157Crossref, Medline, Google Scholar
69. Levitt JG, Blanton RE, Caplan R, Asarnow R, Guthrie D, Toga AW, Capetillo-Cunliffe L, McCracken JT: Medial temporal lobe in childhood-onset schizophrenia. Psychiatry Res 2001; 108:17–27Crossref, Medline, Google Scholar
70. Tisserand DJ, Pruessner JC, Sanz Arigita EJ, van Boxtel MP, Evans AC, Jolles J, Uylings HB: Regional frontal cortical volumes decrease differentially in aging: an MRI study to compare volumetric approaches and voxel-based morphometry. Neuroimage 2002; 17:657–669Crossref, Medline, Google Scholar
71. Ashburner J, Csernansky JG, Davatzikos C, Fox NC, Frisoni GB, Thompson PM: Computer-assisted imaging to assess brain structure in healthy and diseased brains. Lancet Neurol 2003; 2:79–88Crossref, Medline, Google Scholar
72. Ashburner J, Friston KJ: Voxel-based morphometry: the methods. Neuroimage 2000; 11(6, part 1):805–821Google Scholar
73. Bookstein FL: “Voxel-based morphometry” should not be used with imperfectly registered images. Neuroimage 2001; 14:1454–1462Crossref, Medline, Google Scholar
74. Sowell ER, Peterson BS, Thompson PM, Welcome SE, Henkenius AL, Toga AW: Mapping cortical change across the human life span. Nat Neurosci 2003; 6:309–315Crossref, Medline, Google Scholar
75. Thompson PM, Hayashi KM, de Zubicaray G, Janke AL, Rose SE, Semple J, Herman D, Hong MS, Dittmer SS, Doddrell DM, Toga AW: Dynamics of gray matter loss in Alzheimer’s disease. J Neurosci 2003; 23:994–1005Crossref, Medline, Google Scholar