Visual Attention Circuitry in Schizophrenia Investigated With Oddball Event-Related Functional Magnetic Resonance Imaging
Abstract
Objective: Schizophrenia patients have problems directing attention. Sustained attention requires ensuring that brain resources are focused on a selected target (top-down task) while ignoring irrelevant distractors (bottom-up interference). Whether patients have too little ability to focus or too much interference from distraction has not been clarified. The oddball paradigm embeds infrequent targets and distractors into the stimulus train, and schizophrenia deficits have been linked to diminished responses to both. Cerebral activity underlying abnormal attention can be examined with event-related functional magnetic resonance imaging. Method: A visual oddball task was presented to 22 patients with schizophrenia and 28 comparison subjects. Statistical probability maps reflecting blood-oxygenation-level-dependent changes were generated for infrequent targets and novel distractors relative to frequent standard stimuli. Activation was related to performance and symptoms. Results: Activation specific to targets and distractors was associated with faster performance. For targets, patients had diminished activation in superior temporal and frontal gyri, cingulate, thalamus, and basal ganglia. They had increased activation in right insula, mid-frontal gyrus, posterior cingulate, and left inferior parietal lobule. For distractors, patients showed less activation in occipital regions and left inferior parietal lobule but increased activation in parietal-occipital, right mid-frontal, and left inferior frontal gyri. Abnormal activation correlated with positive and negative symptoms. Conclusions: Abnormal activation in schizophrenia in response to attentional demands reflects both insufficient recruitment of brain systems required for target detection and overcommitment of resources for processing irrelevant distractors. Schizophrenia patients appear to have an inability both to focus on targets and ignore distraction.
Deficits in attention and working memory are well documented in schizophrenia and disrupt goal-directed behavior (1 , 2) . Patients have difficulties keeping focused in conversations, adhering to schedules, concentrating on work and activities, and achieving personal and vocational goals. Such deficits could reflect either difficulty with their ability to focus on the target of attention or their vulnerability to disruptive effects of irrelevant distractors or both. These domains are simulated by the oddball paradigm, with tasks requiring the subject to respond to prespecified infrequent events (targets) while disrupting this process with attention-grabbing novel distractors. Event-related potential studies have identified separable brain systems for task-related activation to targets (top-down processing) and for inhibition of response to irrelevant distracting events (bottom-up processing). Event-related potential studies in schizophrenia have reported attenuated P300 responses both to auditory and visual targets (P3b) and to novel distractors (P3a) (3 , 4) . In the auditory modality, these abnormalities have been linked to impaired superior temporal gyrus function (5) . Delineating spatial distribution of activation can be more optimally achieved with functional magnetic resonance imaging (fMRI) than with event-related potentials.
In healthy people, event-related fMRI studies reported change in blood-oxygen-level-dependent (BOLD) signals for visual targets relative to nontargets in a network including the thalamus and the frontal, temporal-limbic, and occipitoparietal cortex (6 , 7) . Using a visual oddball paradigm, we characterized two distributed systems for responding to targets and to novel distractors. Target detection was associated with activation of superior temporal, frontal, and occipitoparietal regions and localized limbic, thalamic, and basal ganglia response. Distractors activated posterior regions, including occipitotemporal and mid-temporal cortices (8) .
The fMRI literature on visual stimulus processing in schizophrenia is limited. Barch et al. (9) demonstrated normal activation of visual, motor, somatosensory, and supplementary motor regions to a flashing checkerboard requiring a motor response. However, abnormal activation was reported for more complex conditions. With simultaneous visual and auditory stimuli, patients showed reduced parietal, thalamic, and prefrontal activation, implicating the dorsal visual processing pathway (10) .
The inhibitory P300 for a no-go condition was investigated, with response required to a frequent stimulus and inhibited to an infrequent stimulus (11) . There was diminished activation in patients in regions implicated in regulating inhibition. Although these studies suggest normal sensorimotor response to visual stimulation and deficits in complex visual processing, to our knowledge, no fMRI study has directly examined the integrity of the neural system involved in visual target detection and the effect of novel distractors in schizophrenia.
We applied the visual oddball paradigm with event-related fMRI to examine regional hemodynamic responses to targets and novel distractors. We hypothesized that the abnormalities in brain activity responsible for reduced P3b and P3a event-related potential responses in schizophrenia would be reflected by abnormal hemodynamic activations for targets and for distractors, respectively. Reduced event-related potential amplitudes could result from attenuated activation in regions generating P300 subcomponents. Alternatively, there could be changes in regions that do not actually generate P300 but serve as modulators that can either facilitate or disrupt neuronal synchrony of underlying generators. Therefore, we examined regions of abnormally decreased and increased activation in patients. Finally, activation abnormalities were related to the patients’ performance and symptoms.
Method
Participants
The study group included 22 patients with schizophrenia (13 men) and 28 healthy comparison subjects (16 men), consecutive right-handed volunteers at the Schizophrenia Research Center. Comparison subjects were selected from 36 previously reported participants (8) to balance patients sociodemographically—age: patients, mean=30.5 years (SD=9.1, range=18–48), comparison subjects, mean=31.6 years (SD=8.5, range=20–48), Wilcoxon z=0.615, p=0.54; and parental education: patients, mean=13.2 years (SD=2.5, range=7–18), comparison subjects, mean=14.7 (SD=3.1, range=9–20), Wilcoxon z=1.577, p=0.12. As expected, the patients attained less education (mean=12.8 years, SD=2.3, range=9–18) than the comparison subjects (mean=15.5, SD=2.7, range=10–20), Wilcoxon z=3.349, p=0.0008. After a complete description of the study, written informed consent was obtained from the subjects.
The participants underwent standardized assessment procedures, including medical, neurological, psychiatric, and neurocognitive evaluations and laboratory tests. The psychiatric evaluation for patients included a clinical assessment; a structured interview (12) ; a history obtained from family, care providers, and records; and scale scores for measuring symptoms administered by investigators trained to a criterion reliability of intraclass correlation=0.90. The patients had a DSM-IV diagnosis of schizophrenia established in a consensus conference based on all information available and had no history of other disorders or events affecting brain function. The age of onset of psychotic symptoms in the context of functional decline was mean=22.5 years (SD=6.4, range=16–37), with an illness duration of mean=12.4 years (SD=7.5) and mean=2.5 (SD=3.6, range=0–15) hospitalizations. These clinically stable outpatients had mild symptoms at the time of the study. Global ratings on the Scale for the Assessment of Negative Symptoms (SANS) (13) averaged 1.4 (SD=0.9, range=0–3.4), and ratings on the Scale for the Assessment of Positive Symptoms (SAPS) (14) averaged 1.2 (SD=0.8, range=0.0–3.0). Except for an unmedicated patient, all were taking a stable dose of antipsychotics (four first-generation, 15 second-generation, and two combined antipsychotics).
The average daily dose in chlorpromazine equivalents was 295 (SD=50, range=50–600) mg/day. The comparison subjects underwent the same evaluation procedures (15) . They had no history of major psychiatric illness in first-degree relatives.
Imaging Procedures: Tasks
Three stimulus types were presented: standards, targets, and novels ( Figure 1 ). The standard frequent stimulus was a circular arrangement of small bright red Gabor elements against a gray textured background with randomly distributed light gray Gabor elements. The target infrequent stimulus, a green circle, differed only in color. The novel stimuli were fractal images created with commercial software (ArtMatic v1.2.1, U&I Software, 1999; http: //www.uisoftware.com). A total of 200 stimuli were presented: 15% targets, 15% novels, and 70% standards, matched for luminance. They followed 10 filler stimuli (eight standard, two target) presented before usable image acquisition. Each stimulus was presented for 1 second, with a 1-second interstimulus interval during which a homogeneous visual noise gray background was displayed. Responses and latencies were recorded. The test required 420 seconds.

The participants were placed in the scanner in a supine position. Earplugs were fitted to muffle noise, and head fixation was ensured through a foam rubber device mounted on the head coil. A computer-controlled liquid crystal display rear-projected the stimuli onto a screen viewed through a mirror mounted inside the head coil. The scanner synchronized task administration with image acquisition through the PowerLaboratory platform (16) on a laptop computer. After random assignment of response hand, each participant was instructed to press a button on a response pad (FORP, Current Design, Philadelphia) when infrequent targets appeared. No response was required for novels or standards.
Image Acquisition
Data were acquired on a 4-T General Electric Signa Scanner (Milwaukee) by employing a quadrature head coil. Structural images consisted of a sagittal T 1 -weighted localizer, followed by a T 1 -weighted acquisition of the entire brain in the axial plane (24-cm field of view, a 256×256 matrix, resulting in a voxel size of 0.9375×0.9375×4 mm). This sequence was used for spatial normalization to a standard atlas (17) and for anatomic overlays of functional data. Functional imaging was performed axially by using a multislice gradient-echo echo-planar sequence, a field of view of 24 cm (frequency) ×15 cm (phase), and an acquisition matrix of 64×40 (22 slices, 4-mm thickness, a 0-slice gap, TR=2000 msec, TE=21 msec). Slices were acquired from the superior cerebellum through the frontal lobe. Inferiorly, this corresponded to just below the inferior aspect of the temporal lobes, and superiorly, to the hand motor area in the primary motor cortex. This sequence delivered nominal voxel resolution of 3.75×3.75×4 mm.
Image Analysis
The fMRI data were preprocessed and analyzed with FEAT (fMRI Expert Analysis Tool) Version 5.1 (www.fmrib.ox.ac.uk/fsl). Images were slice-time-corrected, motion-corrected to the median image with tri-linear interpolation with df (18) , high-pass filtered (60 seconds), spatially smoothed (8 mm fMRI Expect Analysis Tool, isotropic), and scaled with mean-based intensity normalization. Resulting translational motion parameters were examined to ensure that there was not excessive motion (i.e., >8 mm in any plane). A brain extraction tool was used to remove nonbrain areas (19) . The median functional image was coregistered to the T 1 -weighted structural volume and then transformed into standard anatomical space (T 1 Montreal Neurological Institute template) with the tri-linear interpolation (18 , 20) , and transformation parameters were later applied to statistical images.
Statistical Analysis
Subject-level time-series statistical analysis was carried out by using FILM (FMRIB’s Improved Linear Model) with local autocorrelation correction (21) . Condition events were modeled with a canonical hemodynamic response function and its temporal derivative. After preprocessing, whole brain statistical analysis was completed for each individual in subject space, and resulting contrast maps were spatially normalized as above. Group-level random effects analyses were performed in FMRIB’s Software Library. Within-group analyses were accomplished by entering whole brain contrasts into one-sample t tests. Between-group analyses used inclusion masks to restrict contrasts to voxels with above-threshold responses for each group. Significance thresholds were based on spatial extent, and we used a minimum-height threshold of z≥2.33 and a cluster p≤0.05. Identified clusters were then localized in anatomical regions with the Talairach Daemon database (20) .
Because participants made few errors, response time (in milliseconds) was used as a measure of performance. These parameters were applied in a voxelwise correlation analysis to examine the association between activation (percent signal change) and individual differences in clinical severity. To contain type I error, we limited the evaluation to the summary scores for the SANS and SAPS. Furthermore, we only examined correlations that exceeded p<0.0001 and extended to at least 10 adjacent voxels.
Results
Performance
The task was easy for patients (number correct: mean=29.2, SD=2.3, of 30) and comparison subjects (mean=29.0, SD=2.8) (t=0.26, df=48, p=0.80). The response times were also comparable (patients: mean=540.2 msec, SD=126.8; comparison subjects: mean=497.7 msec, SD=62.4) (t=1.38, df=48, p=0.18), with variance higher in patients (F=4.13, df=21, 27, p=0.001).
Target Condition
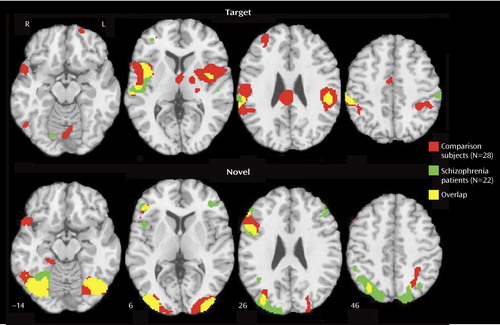
A similar network was activated in patients and comparison subjects for targets ( Figure 2 , top; data supplement Table 1, available at http://ajp.psychiatryonline.org): bilateral superior temporal gyrus, parietal, mid-temporal, insular, cingulate, and limited frontal areas. In comparison subjects, there was also activation in the thalamus, basal ganglia, and occipital regions. The patients showed less extensive activation (11 activated regions versus 23 in comparison subjects), more limited to the right hemisphere (eight of 11) in relation to comparison subjects (12 of 23) (data supplement Table 1). Although activation was in the same cortical regions, there was diminished activation in patients bilaterally in the superior temporal gyrus; the basal ganglia, left superior frontal, thalamus, and insula regions; and the right anterior and posterior cingulate ( Figure 3 , top; data supplement Table 1, top right column). Abnormally increased activation in patients occurred in the right insula, mid-frontal gyrus, and posterior cingulate (Brodmann’s area 31) and in the left inferior parietal lobule (Brodmann’s area 40).
a z-level coordinates are provided. Images are in radiological convention (left hemisphere to viewer’s right).
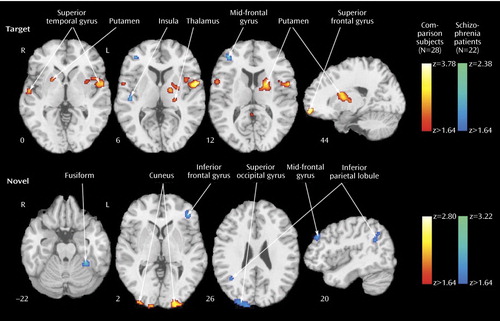
a Greater activation in patients is depicted by the blue scale, whereas greater activation in comparison subjects is shown by the red scale. Images are in radiological convention (left hemisphere to viewer’s right).
Novel Condition
Both groups activated a network that included visual and parietal association areas, with more restricted activation in the right inferior frontal cortex ( Figure 2 , bottom; data supplement Table 1, bottom). Contrasting patients and comparison subjects ( Figure 3 , bottom; data supplement Table 1, bottom, last columns) indicated few regions of reduced activity in patients but several areas of abnormally increased activity. Reduced activation was observed in the cuneus bilaterally, the left inferior occipital gyrus, and the inferior parietal lobule. Increased activation was noted in the left middle occipital (Brodmann’s area 18), the fusiform, the precuneus, and the inferior frontal (Brodmann’s area 10) areas and in the right angular (Brodmann’s area 39), superior occipital, superior parietal (Brodmann’s area 7), and middle frontal (Brodmann’s area 10) regions.
Association With Performance
The voxelwise correlations between reaction time and signal change for targets showed only negative correlations exceeding the threshold, reflecting faster reaction time with increased activation. These correlations peaked for comparison subjects in the thalamus, cingulate, mid-frontal and inferior parietal areas, and precuneus. Correlations were attenuated but had similar topography in patients. The only correlation exceeding the threshold was in the right mid-frontal area (data supplement Table 2A). Although no performance was required for novel stimuli, abnormalities in their processing might affect response to targets. Indeed, the correlations between activation to novels and reaction time to targets were predominantly negative for both patients and comparison subjects. In comparison subjects, they peaked in the superior temporal gyrus bilaterally and in the left putamen, thalamus, and precuneus. In patients, negative correlations peaked in the left anterior cingulate and superior occipital gyri, but there were also positive correlations that peaked in the left superior temporal gyrus.
Association With Clinical Measures
The voxelwise association between activation and SANS and SAPS summary scores revealed correlations both for target and novel contrasts. For targets, negative correlations, reflecting less severe symptoms associated with greater activation, were seen with the SANS in the right mid-temporal and right superior temporal gyrus. Positive correlations were seen with frontal activation to targets, peaking in the left superior frontal and right mid-orbitofrontal regions (data supplement Table 2B). Negative correlations with the SAPS were observed in the left superior frontal area and right cingulate, whereas positive correlations occurred only in the left mid-orbitofrontal region. For novels, negative correlations with the SANS occurred in the superior temporal gyrus and insula, whereas positive correlations peaked in the left superior frontal region. Correlations between activation for novels and the SAPS were negative for the left caudate, putamen, and precuneus. They were positive for the right mid-frontal region and cuneus.
Discussion
Patients with schizophrenia and healthy participants showed robust regional cerebral activation temporally associated with the appearance of targets. Consistent with fMRI studies of spatial attention (22 , 23) , both groups recruited temporal, parietal, cingulate, and frontal regions. Despite equal performance, the patients activated some but not all regions activated by comparison subjects. They had diminished activation in the superior temporal gyrus bilaterally, the thalamus and basal ganglia, and superior frontal areas. These regions are important in sensory input integration and response selection (24) and have been implicated in schizophrenia (5 , 11) . Because the task was made easy to match the performance of patients and comparison subjects, different activation patterns likely reflect the use of alternative strategies. Failure to activate brain circuitry recruited by healthy people would be expected with dysfunction in that circuitry. Such failure of activation may generate performance deficits in more demanding attentional tasks.
In few regions, specifically the left inferior parietal lobule, the right insula, and the mid-frontal gyrus, the patients showed increased activation for targets relative to comparison subjects. The patients also activated a right posterior cingulate region not activated in comparison subjects. Both fMRI (25 , 26) and focal lesion studies (27) have linked the inferior parietal lobule to the auditory target P300 response. Increased activation in schizophrenia of the left inferior parietal lobule and the right mid-frontal gyrus has been reported for working memory (28) , suggesting overexertion. Activation of the right insula has been related to risk-taking during decisions (29) , while posterior cingulate activation has been linked to thought suppression and cognitive control (30) .
The results suggest that attentional processing in schizophrenia is compromised by increased demands on working memory to complete even simple tasks, combined with greater risk assignment to decisions and the increased need to suppress competing thoughts. Consistent with reports on neural circuitry involved in response to novel visual stimuli (6 , 7 , 31) , a more posterior brain system responded to their presentation. Activation was prominent in occipital-temporal regions, with only right inferior frontal gyrus activated anteriorally. In contrast to targets, for which patients activated fewer regions and less robustly, for novels, patients activated almost all regions activated in comparison subjects and some additional areas.
Furthermore, most between-group differences indicated greater activation in patients. The areas of reduced activation in patients included the visual cortex and the left inferior parietal lobule, which were overactivated in patients as targets. The reduced bilateral activation in the cuneus suggests less mobilization of visual association areas, whereas reduced activation in the inferior parietal lobule suggests less allocation of attentional resources. Increased activity in patients for novel distractors was observed in occipital-parietal regions, reflecting increased activity superiorly. Greater occipital activation in dorsal regions and in the left fusiform gyrus may reflect efforts in visual processing of the spatial layout (32) . Notably, the patients activated two frontal regions, the right mid-frontal gyrus and the left inferior parietal lobule, not activated in comparison subjects. This likely reflects increased efforts by the patients to inhibit responses to distractors compared to the normal subjects, who had inhibited the response to distractors at earlier stages of processing in the posterior visual system (11) .
Several regions were activated by both targets and distractors: the right superior temporal gyrus and mid-occipital gyrus and the left inferior frontal gyrus and lingual gyrus. These areas likely mediate visuospatial integration and attentional requirements to both conditions. Because the inferior parietal lobule is activated by both targets and distractors, reduced activation for distractors in patients, in the context of increased inferior parietal lobule response to targets, may reflect limited resources for serving the conflicting needs of regulating top-down requirements and bottom-up interference. When we consider the pattern of abnormal activation and failure to activate in schizophrenia, it appears that attentional deficits emanate from both insufficient recruitment of regions necessary for goal-directed behavior and overprocessing of irrelevant events.
The correlations between regional activation and response time provide further validation that activation measured by the BOLD signal reflects the operation of a neural system that facilitates attentional processing. In comparison subjects, the main regions activated for target processing, including the bilateral superior temporal gyrus, left inferior parietal lobule, thalamus, cingulate, and right mid-frontal, also show response facilitation with increased activity. Such correlations indicate that activation of this cortical-thalamic network facilitates response to targets in attentional settings. The attenuation of these correlations in patients, despite comparable performance, suggests the operation of other factors that may include medication effects.
The correlations between hemodynamic response to distractors and processing efficiency for targets suggest a linkage. In comparison subjects, activation to distractors predicting faster response time for targets occurred in regions activated by targets. The only exception was the precuneus, which was activated by novels and predicted faster response to targets. This indicates a network that distinguishes salient events that require a response from distractors and supports the contribution of the precuneus in processing novel visual stimuli for top-down relevance (33) . In patients, anterior cingulate and superior occipital activation to distractors accelerated response to the target, whereas activation of the left superior temporal gyrus slowed responses. This supports left superior temporal gyrus involvement in schizophrenia (5) .
The correlations between activation measures and symptom severity also revealed regional specificity. Greater activation of right temporal regions was associated with milder negative symptoms, whereas greater bilateral frontal activation was associated with increased symptom severity.
The correlations for temporal regions are consistent with group differences in activation. Because patients had reduced temporal activation, normalizing activation predicted less severe symptoms. For frontal regions, activation was associated with more negative symptoms, although patients overactivated the right mid-frontal and underactivated the left superior frontal areas. This suggests that negative symptoms are associated with a greater need to recruit frontal regions for target detection. For distractors, correlations with SANS were also negative for temporal and positive for frontal activation. For SAPS, target and distractor activation of frontal regions was associated with fewer symptoms, as was activation of the anterior cingulate for targets and the basal ganglia and precuneus for distractors. Thus, frontal activation portends less severe positive and increased negative symptom profiles. Perhaps recruitment of frontal regions in target detection indicates executive difficulties associated with negative symptoms, whereas recruitment of frontal regions in response to distractors indicates excessive processing of irrelevant information, mediating positive symptoms.
Although parallel measurements of electrophysiology and fMRI are needed to assess such relationships directly, our results suggest potential metabolic substrates for the visual P300 and its abnormalities in schizophrenia. Visual P3a and P3b likely have separable but partially overlapping generators, with the inferior parietal lobule, superior temporal gyrus, and visual association areas providing a system that responds to stimulus deviance regardless of whether it is a target or a novel distractor. These regions have been implicated in both auditory and visual P300 electrophysiological studies. Likewise, the regions activated specifically for targets and novels have been related to P3b and P3a generation, respectively (26 – 28) . Reduced P3a and P3b in schizophrenia, however, may be caused by different mechanisms. Reduced P3b seems to result from failure to recruit regions that generate it because target response in patients was less robust. By contrast, reduced P3a magnitude in schizophrenia may relate to overactivation of regions that are not engaged by healthy people, attenuating its propagation. Notably, the left inferior parietal lobule, putatively involved in generating both P3a and P3b, was overactivated in patients for targets but underactivated for distractors.
The present study has several limitations. The patients were stable, mildly symptomatic, and medicated. Our positive results encourage more systematic evaluation of such factors, including animal studies to clarify medication effects on response to targets and novels. We used the visual modality, more amenable to fMRI. Most electrophysiological studies have examined the auditory modality, which may have more extensive abnormalities in schizophrenia. The generalizability of our findings to other visual targets and novel stimuli also needs further investigation. For example, to ensure that the novel stimuli are “attention grabbers,” we have made them complex. Although we have equated targets and novels for size and luminance, this dimension requires further examination by manipulating the relative complexity of targets and distractors. For example, familiar distractors can be used that are of equal complexity to targets.
Notwithstanding these limitations, the results demonstrate robust effects of target detection and novelty processing in patients and comparison subjects but several noteworthy differences. Our study simulates a situation in which an individual is asked to pay attention to a specific infrequent event while being intermittently distracted by attention-grabbing but irrelevant events. We observed that patients showed diminished activation for the targets in key regions, yet for novel distractors, they overactivated several regions. Appropriate activation of networks regulating target and novelty processing was generally associated with faster performance and, in patients, with less severe symptoms. These results encourage further efforts to examine attentive and preattentive processing in schizophrenia with event-related fMRI.
1. Braff DL: Information processing and attention dysfunctions in schizophrenia. Schizophr Bull 1993; 19:233–259Google Scholar
2. Lee J, Park S: Working memory impairments in schizophrenia: a meta-analysis. J Abnorm Psychol 2005; 114:599–611Google Scholar
3. Mathalon DH, Ford JM, Pfefferbaum A: Trait and state aspects of P300 amplitude reduction in schizophrenia: a retrospective longitudinal study. Biol Psychiatry 2000; 47:434–449Google Scholar
4. Turetsky BI, Colbath EA, Gur RE: P300 subcomponent abnormalities in schizophrenia, I: physiological evidence for gender and subtype specific differences in regional pathology. Biol Psychiatry 1998; 43:84–96Google Scholar
5. McCarley RW, Salisbury DF, Hirayasu Y, Yurgelun-Todd DA, Tohen M, Zarate C, Kikinis R, Jolesz FA, Shenton ME: Association between smaller left posterior superior temporal gyrus volume on magnetic resonance imaging and smaller left temporal P300 amplitude in first-episode schizophrenia. Arch Gen Psychiatry 2002; 59:321–331Google Scholar
6. Clark VP, Fannon S, Lai S, Benson R, Bauer L: Responses to rare visual target and distractor stimuli using event-related fMRI. J Neurophysiol 2000; 83:3133–3139Google Scholar
7. Kirino E, Belger A, Goldman-Rakic P, McCarthy G: Prefrontal activation evoked by infrequent target and novel stimuli in a visual target detection task: an event-related functional magnetic resonance imaging study. J Neurosci 2000; 20:6612–6618Google Scholar
8. Gur RC, Turetsky BI, Loughead J, Waxman J, Snyder W, Ragland JD, Elliott MA, Bilker WB, Arnold SE, Gur RE: Hemodynamic responses in neural circuitries for detection of visual target and novelty: an event-related fMRI study. Hum Brain Mapp 2006 (Epub ahead of print)Google Scholar
9. Barch DM, Mathews JR, Buckner RL, Maccotta L, Csernansky JG, Snyder AZ: Hemodynamic responses in visual, motor, and somatosensory cortices in schizophrenia. Neuroimage 2003; 20:1884–1893Google Scholar
10. Braus DF, Weber-Fahr W, Tost H, Ruf M, Henn FA: Sensory information processing in neuroleptic-naive first-episode schizophrenic patients: a functional magnetic resonance imaging study. Arch Gen Psychiatry 2002; 59:696–701Google Scholar
11. Ford JM, Gray M, Whitfield SL, Turken AU, Glover G, Faustman WO, Mathalon DH: Acquiring and inhibiting prepotent responses in schizophrenia: event-related brain potentials and functional magnetic resonance imaging. Arch Gen Psychiatry 2004; 61:119–129Google Scholar
12. First MB, Spitzer RL, Gibbon M, Williams JBW: Structured Clinical Interview for DSM-IV Axis I Disorders, Patient Edition (SCID-P), Version 2. New York, New York State Psychiatric Institute, Biometrics Research, 1996Google Scholar
13. Andreasen NC: Scale for the Assessment of Negative Symptoms (SANS). Iowa City, University of Iowa, 1984Google Scholar
14. Andreasen NC: Scale for the Assessment of Positive Symptoms (SAPS). Iowa City, University of Iowa, 1984Google Scholar
15. First MB, Spitzer RL, Gibbon M, Williams JBW: Structured Clinical Interview for DSM-IV Axis I Disorders, Non-Patient Edition (SCID-NP), Version 2.0. New York, New York State Psychiatric Institute, Biometics Research, 1996Google Scholar
16. Chute DL, Westall RF: PowerLaboratory. Devon, Pa, MacLaboratory, 1997Google Scholar
17. Talairach J, Tournoux P: Co-Planar Stereotaxic Atlas of the Human Brain: 3-Dimensional Proportional System: An Approach to Cerebral Imaging. New York, Thieme Medical, 1988Google Scholar
18. Jenkinson M, Bannister P, Brady M, Smith S: Improved optimization for the robust and accurate linear registration and motion correction of brain images. Neuroimage 2002; 17:825–841Google Scholar
19. Smith SM: Fast robust automated brain extraction. Hum Brain Mapp 2002; 17:143–155Google Scholar
20. Jenkinson M, Smith S: A global optimisation method for robust affine registration of brain images. Med Image Anal 2001; 5:143–156Google Scholar
21. Woolrich MW, Ripley BD, Brady M, Smith SM: Temporal autocorrelation in univariate linear modeling of fMRI data. Neuroimage 2001; 14:1370–1386Google Scholar
22. Mesulam MM, Nobre AC, Kim YH, Parrish TB, Gitelman DR: Heterogeneity of cingulate contributions to spatial attention. Neuroimage 2001; 13:1065–1072Google Scholar
23. Sturm W, Schmenk B, Fimm B, Specht K, Weis S, Thron A, Willmes K: Spatial attention: more than intrinsic alerting? Exp Brain Res 2005; 1–10 (Epub ahead of print)Google Scholar
24. Egner T, Hirsch J: Where memory meets attention: neural substrates of negative priming. J Cogn Neurosci 2005; 17:1774–1184Google Scholar
25. Thermenos HW, Goldstein JM, Buka SL, Poldrack RA, Koch JK, Tsuang MT, Seidman LJ: The effect of working memory performance on functional MRI in schizophrenia. Schizophr Res 2005; 74:179–194Google Scholar
26. Menon V, Ford JM, Lim KO, Glover GH, Pfefferbaum A: Combined event-related fMRI and EEG evidence for temporal-parietal cortex activation during target detection. Neuroreport 1997; 8:3029–3037Google Scholar
27. Kiehl KA, Laurens KR, Duty TL, Forster BB, Liddle PF: Neural sources involved in auditory target detection and novelty processing: an event-related fMRI study. Psychophysiol 2001; 38:133–142Google Scholar
28. Soltani M, Knight RT: Neural origins of the P300. Crit Rev Neurobiol 2000; 14:199–224Google Scholar
29. Paulus MP, Rogalsky C, Simmons A, Feinstein JS, Stein MB: Increased activation in the right insula during risk-taking decision making is related to harm avoidance and neuroticism. Neuroimage 2003; 19:1439–1448Google Scholar
30. Wyland CL, Kelley WM, Macrae CN, Gordon HL, Heatherton TF: Neural correlates of thought suppression. Neuropsychologia 2003; 41:1863–1867Google Scholar
31. Laurens KR, Kiehl KA, Liddle PF: A supramodal limbic-paralimbic-neocortical network supports goal-directed stimulus processing. Hum Brain Mapp 2005; 24:35–49Google Scholar
32. Eger E, Henson RN, Driver J, Dolan RJ: Bold repetition decreases in object-responsive ventral visual areas depend on spatial attention. J Neurophysiol 2004; 92:1241–1247Google Scholar
33. Cavanna AE, Trimble MR: The precuneus: a review of its functional anatomy and behavioural correlates. Brain 2006 (Epub ahead of print)Google Scholar