Aberrant “Default Mode” Functional Connectivity in Schizophrenia
Abstract
Objective: The “default mode” has been defined as a baseline condition of brain function and is of interest because its component brain regions are believed to be abnormal in schizophrenia. It was hypothesized that the default mode network would show abnormal activation and connectivity in patients with schizophrenia. Method: Patients with schizophrenia (N=21) and healthy comparison subjects (N=22) performed an auditory oddball task during functional magnetic resonance imaging (fMRI). Independent component analysis was used to identify the default mode component. Differences in the spatial and temporal aspects of the default mode network were examined in patients versus comparison subjects. Results: Healthy comparison subjects and patients had significant spatial differences in the default mode network, most notably in the frontal, anterior cingulate, and parahippocampal gyri. In addition, activity in patients in the medial frontal, temporal, and cingulate gyri correlated with severity of positive symptoms. The patients also showed significantly higher frequency fluctuations in the temporal evolution of the default mode. Conclusions: Schizophrenia is associated with altered temporal frequency and spatial location of the default mode network. The authors hypothesized that this network may be under- or overmodulated by key regions, including the anterior and posterior cingulate cortex. In addition, the altered temporal fluctuations in patients may result from a change in the connectivity of these regions with other brain networks.
Schizophrenia is a psychotic disorder that alters patients’ perception, thought processes, and behavior as evidenced by hallucinations, delusions, disorganized speech or behavior, social withdrawal, and varied cognitive deficits (1) . Additionally, episodic memory and attention are significantly impaired in schizophrenia (2) . Disturbed integration of activity across multiple brain regions or dysfunctional connectivity between frontotemporal brain regions is a central feature of schizophrenia (3 , 4) . Symptoms of schizophrenia have been attributed to a failure of functional integration or aberrant connectivity among regions or systems of the brain (4) .
The “default mode” network has been identified as a resting state of brain function; this network has repeatedly exhibited significant functional connectivity across a wide variety of tasks and during a conscious inactive state (5 – 11) . Brain regions identified as parts of the default mode network include the posterior cingulate and medial, prefrontal, parahippocampal, and inferior parietal cortices, among others (10) . Although the exact roles of the default mode network are unknown, it has been implicated in attending to external and internal stimuli (5 , 6 , 12) , as well as self-referential and reflective activity (5 , 7 , 11) that specifically includes episodic memory retrieval, inner speech, mental images, emotions, and planning of future events (9 , 13) . McKiernan et al. (10) found that task-induced deactivation of the default mode network increased as task difficulty increased in a subsequently administered cognitive probe task. They hypothesized that this was due to a reallocation of processing resources from the default mode network to areas used in task performance. This is consistent with a hypothesis that the default mode network is involved in ongoing information processing; as task demand increases, fewer attentional resources can be devoted to this default mode network (8) .
Because the mental processes involved in the default mode are relevant to schizophrenia, it was hypothesized that the default mode network would be abnormal in these patients. Inasmuch as the default mode network is involved in many aspects of brain function, its healthy functional connectivity is imperative to normal mental function; impaired connectivity or activation, as seen in other brain networks in schizophrenia, might influence positive and negative symptoms of the disorder.
Our goal was to test the hypothesis that the default mode might show abnormal spatial and/or temporal patterns of activity in schizophrenia. Independent component analysis, a technique that maximizes the independence between the output components, was used to analyze the data (14 , 15) . The independent component analysis algorithm attempts to determine a set of nonsystematically overlapping (spatially independent) brain networks, each with associated time courses. The default network is readily (and unambiguously) identified by using independent component analysis (8) . In its application to functional magnetic resonance imaging (fMRI) data, independent component analysis separates the fMRI data into a set of spatially distinct networks and their temporal signatures and is useful for revealing functionally related, although not necessarily task-related, cortical areas (16) . We used independent component analysis to calculate spatially independent, temporally synchronous regions; the default mode component for each subject was selected with a spatial template to identify the component of interest. We extracted the default brain modes from fMRI data collected during the performance of an auditory oddball task. We employed the auditory oddball task as a type of control (as opposed to an uncontrolled resting state scan) and also to stimulate the brain with a relatively simple task that elicits robust brain function differences between comparison subjects and patients (17) . Patients with schizophrenia perform as accurately as healthy comparison subjects, although they have slightly longer response times (14 , 17) . The oddball task is also well suited to show whether the fMRI signal in these networks is modulated by behavioral performance, something that is not possible when analyzing resting-state scans.
Study hypotheses were tested by comparing the spatial and temporal characteristics within and between groups. It was hypothesized that patients with schizophrenia would demonstrate altered activation or deactivation of regions of the default mode, specifically in the hippocampus and parahippocampal gyrus, frontal cortex, and anterior and posterior cingulate. These regions have been shown to have altered activation and functional connectivity in previous studies of schizophrenia (3 , 18 – 20) . It was also hypothesized that this altered activation would correlate with positive symptoms of schizophrenia because these regions have been implicated in hallucinations, delusions, and altered thought processes in the disorder (20 – 22) .
Methods and Materials
Participants
Twenty-one patients with schizophrenia (six women and 15 men) and 22 age-matched healthy comparison subjects (six women and 16 men) participated in the experiment at Hartford Hospital. Schizophrenia was diagnosed with the Structured Clinical Interview for DSM-IV (SCID) (23) , and the Positive and Negative Syndrome Scale (PANSS) was used to assess symptom severity (24) , both administered on the day of scanning. The healthy participants were part of an ongoing research study of healthy aging, and neither they nor any of their first-degree relatives met criteria for any DSM-IV axis I disorder, as determined by using the SCID and a family history questionnaire (25) . All participants provided written informed consent and received payment for the time they spent participating.
All subjects were right-handed or ambidextrous (patients: 20 right-handed, one ambidextrous; comparison subjects: 19 right-handed, three ambidextrous) (26) . The healthy participants ranged in age from 20 to 57 years (mean=40.8, SD=11). The patients ranged in age from 20 to 60 years (mean=41.0, SD=10) (two-sample t test, t=0.062, p>0.95). The subjects were administered the Hopkins Adult Reading Test (27) to assess premorbid intelligence (patients—test 1: mean=97, SD=12; test 2: mean=100, SD=10; comparison subjects—test 1: mean=111, SD=8; test 2: mean=112, SD=7) (two sample t test, t=0.89, df=41, p>0.30). Although information on eight patients was not available, the remainder of the patients were known to be taking one or two stable antipsychotic medications (olanzapine, N=3; quetiapine, N=2; haloperidol, N=3; perphenazine, N=2; risperidone, N=3; ziprasidone, N=2; aripiprazole, N=4).
Experimental Design
The auditory oddball task requires the subject to detect an infrequent target sound within a series of standard and novel sounds. The task consisted of two runs of 244 auditory stimuli presented to participants with a computer stimulus presentation system by means of insert earphones embedded within 30 dB of sound-attenuating magnetic-resonance-compatible headphones. The standard stimulus was a 500-Hz tone, the target stimulus was a 1000-Hz tone, and the novel stimuli consisted of nonrepeating random digital noises (e.g., tone sweeps, whistles). Target and novel stimuli each occurred with a probability of 0.10; the nontarget stimuli occurred with a probability of 0.80. Stimulus duration was 200 msec with an 800-, 1300-, or 1800-msec interstimulus interval. All stimuli were presented at approximately 80 dB above the standard threshold of hearing. All participants reported that they could hear the stimuli and discriminate them from the background scanner noise. The intervals between stimuli of interest (i.e., target and novel stimuli) were allocated in a pseudorandom manner to ensure that these stimuli had equal probability of occurring at the beginning, one-third, and two-thirds through the image-acquisition period. The hemodynamic response to each type of stimulus of interest was sampled uniformly at 500-msec intervals. Before scanning, each participant performed a practice block of 10 trials to ensure understanding of the instructions. The participants were instructed to respond as quickly and accurately as possible by pressing a button with their right index finger every time they heard the target stimulus and not to respond to the nontarget stimuli or the novel stimuli. A fiber-optic response device (Lightwave Medical, Vancouver, B.C., Canada) compatible with magnetic resonance imaging (MRI) was used to record behavioral responses for the task. The stimulus paradigm, data acquisition techniques, and previously found stimulus-related activation have been previously described (17) .
Image Acquisition
Scans were acquired at the Olin Neuropsychiatry Research Center at the Institute of Living on a Siemens Allegra 3T dedicated head scanner (Erlangen, Germany) equipped with 40 mT/m gradients and a standard quadrature head coil. The functional scans were acquired with gradient-echo echo-planar imaging with the following parameters: TR=1.50 seconds, TE=27 msec, field of view=24 cm, acquisition matrix=64×64, flip angle=70°, voxel size=3.75×3.75×4 mm, slice thickness=4 mm, gap=1 mm, 29 slices, ascending axial acquisition. Six “dummy” scans were performed at the beginning of each scan to allow for longitudinal equilibrium, after which the paradigm was automatically triggered to start by the scanner.
Preprocessing
fMRI data were preprocessed with statistical parametric mapping (SPM2) software (28) . Images were realigned using INRIalign, a motion-correction algorithm unbiased by local signal changes (29 , 30) . Data were spatially normalized into standard Montreal Neurological Institute space (31) , spatially smoothed with a 10×10×10 mm 3 full width at half-maximum Gaussian kernel. The data (originally acquired at 3.75×3.75×4 mm 3 ) were slightly subsampled to 3×3×3 mm 3 , resulting in 53×63×46 voxels.
Component Identification
Spatial independent component analysis was conducted for each of the 21 patients and 22 healthy comparison subjects to decompose the data for each individual into 20 components with the infomax algorithm (32) . For each individual, the two runs were analyzed with spatial independent component analysis (15) to decompose all of the data into 20 components using the GIFT software (http://icatb.sourceforge.net/) as follows. Dimension estimation, to determine the number of components, was performed by using the minimum description length criteria modified to account for spatial correlation (33) . Data were first reduced to 20 dimensions using principal component analysis, followed by an independent component estimation with the infomax algorithm (34) .
The default mode component was identified by spatially correlating all components with a default mode mask generated by WFU Pickatlas developed at Wake Forest Pharmaceuticals University (http://www.fmri.wfubmc.edu/) (35) . This mask contained the posterior parietal cortex (Brodmann’s area 7), the frontal pole (Brodmann’s area 10), and the occipitoparietal junction (Brodmann’s area 39), as well as the posterior cingulate and precuneus (6) . This template was smoothed with a 3-mm 3 Gaussian kernel. The component that (spatially) correlated most significantly with the template was selected as the default mode component. For each subject, default mode components from each run of the task were then converted to z values and averaged to produce one default mode component.
Statistical Comparison of Images
SPM2 was used to compute group averages and to compare default mode images between healthy comparison subjects and patients with schizophrenia. Statistical maps of the default mode for patients and comparison subjects were created by entering the single-subject default mode component into a voxelwise one-sample t test, which was then thresholded at q<0.05 with false-discovery-rate correction (36) . To examine differences between patients and comparison subjects, a mask was created that combined regions of the default mode network activated by both patients and comparison subjects. When we used this mask, differences in the default modes between groups were computed with voxelwise two-sample t tests at a q<0.05 false-discovery-rate correction threshold.
Statistical Comparison of Time Courses
Multiple regression analysis within the GIFT software assessed the degree to which the default mode independent component analysis time course correlated with the stimuli presentation. Regressors were entered for the target, novel, and standard stimuli, in addition to nuisance regressors for linear and low-frequency drift by using one- and two-cycle COS and SIN functions. The regression parameters were calculated separately for each run of the task. Frequency distribution of the time courses was evaluated by computing the power spectral density of each subject’s time course for both runs. The spectral power of each time course was combined into six equally spaced frequency bins. Patient and comparison differences for each bin were compared by using one-sample t tests.
Correlation of Regions of the Default Mode with Positive and Negative Symptoms
For 20 of the 21 patients, mean scores for the positive and negative symptom subtests of the Positive and Negative Syndrome Scale (PANSS) were computed to determine the severity of symptoms on the same day the fMRI scan was completed. One male patient was omitted from this analysis because of missing data. A voxelwise multiple regression analysis with a constant was computed to examine the relationship between the default mode component and both positive and negative symptoms (37 , 38) .
Correlation of Time Courses with Positive and Negative Symptoms
The frequency distribution of the time courses for patients with schizophrenia was correlated with their positive and negative symptom scores to determine the relationship between spectral power and symptom severity.
Results
Behavioral Data
Neither patients nor comparison subjects had problems completing the task and performed equally well in terms of percentage of correct hits (patients: mean=93.0, SD=0.1; comparison subjects: mean=99.0, SD=0.02; p<0.06), errors of omission (patients: mean=3.3, SD=6.5; comparison subjects: mean=0.5, SD=0.7; p=0.62), and errors of commission (patients: mean=2.8, SD=3.2; comparison subjects: mean=1.7, SD=2.0; p=0.10). The comparison subjects responded to target stimuli faster than the patients (comparison subjects: mean=434 msec, SD=90; patients: mean=526 msec, SD=155; two-sample t test, t=2.37, df=41, p<0.05).
Component Identification
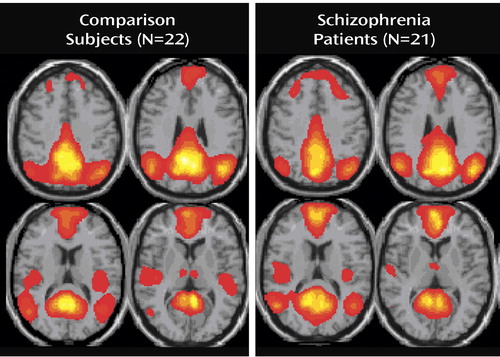
There was no ambiguity in the selection of the default mode component because this component was the only one that correlated with the a priori mask with spatial correlations. The healthy subjects’ networks correlated more significantly with the template than did the patients’ (patients: two-sample t test: mean=0.424, SD=0.042; comparison subjects: mean=0.483, SD=0.030; t=5.32, df=41, p<0.0001). In this work, we refer to default mode fMRI signal as “activity,” although it is actually negatively associated with a task. Default mode activity was observed in patients with schizophrenia and healthy subjects in regions of the brain previously associated with the default mode network ( Figure 1 ). These include the posterior cingulate extending dorsally into the precuneus, the anterior cingulate, the dorsomedial frontal cortex in the middle and superior frontal gyri, the angular gyrus extending anteriorly into the supramarginal gyrus, and the parahippocampal gyrus and hippocampus (10) . Data supplement Table 1 (available at http://ajp.psychiatryonline.org) shows stereotaxic coordinates for all regions of the default mode in patients and comparison subjects.
a From individual independent component analysis.
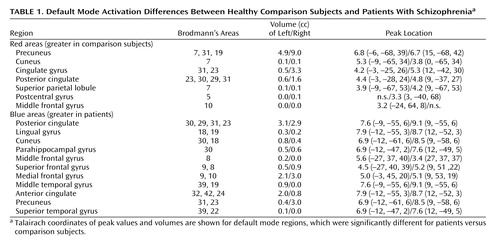
Figure 2 shows that the amplitude of the default mode activity negatively correlated with the oddball task, decreasing during the task and increasing during rest. As expected, the default mode component in patients and comparison subjects was more negatively correlated with the task than any other component. Notably, decreases in the default mode network are greatest during target sounds and smaller during the standard tones. In addition, multiple regression analysis of the SPM design matrix regressors for target, novel, and standard stimuli onto the independent component analysis time courses demonstrates that the default mode network was the component most significantly correlated with the task and accounted for the most task-related variance compared to the other components.
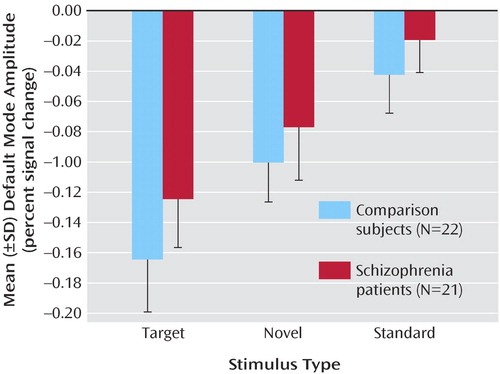
a The amplitude (SD) of the default mode decreased for all stimuli during the task, but the amplitude decreased the most for target stimuli and the least for standard targets. This tendency was not significant.
Statistical Comparison of Images
The default mode maps of patients and comparison subjects are largely similar, although there were significant differences in specific subregions ( Figure 3 ). The comparison subjects demonstrated greater default mode activity in the right posterior cingulate and the left and right precuneus (shown in red). The patients had greater default mode activity in the left and right anterior cingulate, parahippocampal gyrus, and posterior cingulate and in the superior and medial frontal gyri and the left middle frontal and temporal gyri (shown in blue) (q<0.05, false-discovery-rate correction). Coordinates for regions in which activation differed between groups are listed in Table 1 .
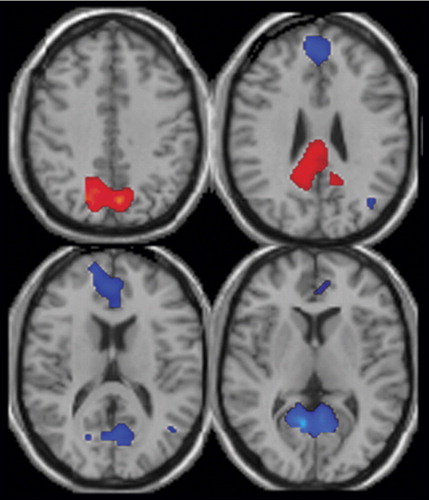
a Areas with increased default mode activation in healthy comparison subjects versus patients are shown in red, and areas with increased default mode activation in patients versus comparison subjects are shown in blue. Comparison subjects show greater activation in the precuneus, posterior cingulate, and cingulate gyrus. Patients show greater activation in the posterior and anterior cingulate and the superior and medial frontal gyrus. See Table 1 for coordinates of the activated areas.
Statistical Comparison of Time Courses
Figure 4 illustrates the results from a t test comparing frequency content in six frequency bins across groups for comparison subjects minus schizophrenia patients. This analysis revealed increased fluctuation in patients with schizophrenia in relation to healthy comparison subjects. Specifically, the comparison subjects had significantly more power in default mode time course frequency in the 0.067-Hz range compared to patients (p<0.005, with Bonferroni correction), who had significantly more power in higher frequency bins, most significantly in the 0.13-Hz bin (p<0.001, with Bonferroni correction).
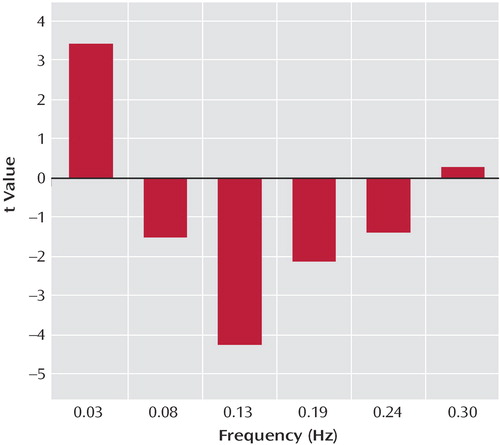
a Default mode frequency bins for comparison subjects minus schizophrenia patients (t values resulting from a two-sample t test computed on each bin are shown). Comparison subjects had significantly more power in low-frequency oscillations (0.03 Hz) in relation to patients with schizophrenia, who showed significantly more power in higher frequencies (0.08 Hz to 0.24 Hz).
Correlation of Regions of the Default Mode With Positive and Negative Symptoms
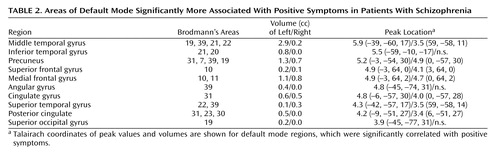
Subregions of the default mode component were found to correlate significantly with severity of positive symptoms in patients, derived from the PANSS ( Figure 5 ). Higher positive symptoms were correlated with increased deactivation in the medial frontal gyrus, the precuneus, and the left middle temporal gyrus, as shown in Table 2 . There were no significant correlations with negative symptoms.
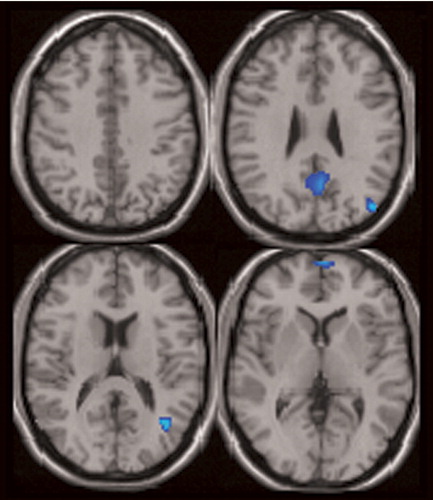
a For patients with schizophrenia, the areas associated with positive symptoms include the middle temporal gyrus, precuneus, medial frontal gyrus, and left posterior cingulate. See Table 2 for a complete description of all regions associated with positive symptoms.
Discussion
This study demonstrates that schizophrenia is associated with both temporal frequency alterations and disruption of local spatial patterns in the default mode network. The default mode was identified as the only component that correlated significantly and most negatively with both the WFU Pick atlas template and the auditory oddball task in both patients and comparison subjects (7 , 8) . Although the default mode spatial maps looked similar for patients and comparison subjects, there were several interesting differences. Spatially, both patients and comparison subjects strongly correlated with the template; however, comparison subjects showed higher correlation, perhaps indicating more variability in the patient maps. Target stimuli produced the largest decrease in default mode activity, followed by novel then standard stimuli. This is consistent with previous research that suggests that increased task difficulty/attentional load leads to increased default mode deactivation, possibly as cognitive resources are reallocated to task-related regions (10) . Patients tend to exhibit smaller default mode changes overall than do healthy comparison subjects; however, this finding was not significant. This tendency may be related to the attentional deficits in schizophrenia and to symptoms such as distractibility and focus on irrelevant internal and external stimuli. This raises the question as to whether patients would show less deactivation in relation to healthy comparison subjects during a more demanding task.
Three major differences in the spatial pattern of default mode activity were observed between patients and comparison subjects. First, patients showed greater deactivation in areas of the frontal gyrus involved in the default mode. Second, patients showed decreased activation in the anterior cingulate relative to comparison subjects. Third, a larger region of the parahippocampal gyrus was included in the default mode of patients versus comparison subjects. The wide variety of regions exhibiting bilateral differences in the default mode network of patients suggests that the strong connectivity of this network (7) is altered in schizophrenia patients. Additionally, healthy comparison subjects exhibited low-frequency oscillations (0.03 Hz), whereas patients exhibited significantly higher-frequency oscillations in the 0.08–0.24 Hz range. This result may indicate less temporal synchronicity between the brain regions involved in the default mode network of patients or may even indicate impaired communication between the default mode network and other brain regions in schizophrenia.
The patients with schizophrenia showed greater deactivation in the middle, medial, and superior frontal gyrus bilaterally in the default mode component. Previous studies have demonstrated similar “hypofrontality” in patients (39) . Cognitive disorganization has been suggested as one cause of decreased activation in the prefrontal cortex (20) , and dorsolateral prefrontal cortex dysfunction has been related to formal thought disorder and attentional deficits of schizophrenia (40) . Abnormal integration of frontal-temporal function, underpinned by a failure of normal cingulate cortical modulation, has also been demonstrated in patients (3) .
In patients with schizophrenia, the anterior cingulate showed a reduced volume of activation, more on the left, in relation to comparison subjects. In addition, patients had greater deactivation bilaterally during the task. Abnormal fMRI activation of the anterior cingulate is widely reported in schizophrenia and has been correlated with working memory deficits (3) . The anterior cingulate is believed to play a role in modulating basic subconscious and higher cortical processing in the default mode during rest (7) and monitoring task progress and implementing task strategy (41) . A failure to monitor internally generated actions has been implicated in hallucinations and delusions in schizophrenia; the activation of the anterior cingulate in both a resting state and during a task implicates it as a modulator of default mode functioning. Its inability to function correctly to modulate internal thoughts and those related to the task may play a role in the positive symptoms of schizophrenia.
Significant differences in hippocampal morphology, volume, neuron size, and connectivity are reported in schizophrenia (18) . In this study, the parahippocampal gyrus was found to have decreased deactivation bilaterally. Parahippocampal neuropathology may play a significant role in the episodic memory problems and related cognitive deficits in schizophrenia and may also be associated with negative symptoms (18 , 19 , 22 , 42) . The hippocampus is functionally connected to brain regions involved in working memory (42) , such as the dorsolateral prefrontal cortex (19) . The decreased deactivation of the frontal cortex and parahippocampal gyrus found in this study may be caused by an altered functional connectivity between these two regions, as demonstrated in previous studies (18 , 19) . Positive symptoms have previously been associated with increased hippocampal activation at rest, as was found in this study (22) .
The medial frontal gyrus, left middle and inferior temporal gyri, precuneus, cingulate gyrus, and left posterior cingulate all correlated with positive symptom severity ( Table 2 ). Positive symptoms have previously been associated with abnormal activation of the prefrontal cortex (20) , superior temporal gyrus, and anterior and posterior cingulate (21 , 40) .
The default mode consistently shows low-frequency blood-oxygen-level-dependent (BOLD) signal fluctuations (0.012 Hz to 0.1 Hz) that contribute to functional connectivity in healthy comparison subjects (8 , 11) . These low-frequency fluctuations represent temporal synchronicity among functionally related regions of the brain. In this study, patients and comparison subjects exhibited low-frequency oscillations in BOLD signals at similar frequencies. However, comparison subjects had significantly more power in this low-frequency range and patients exhibited significantly higher power at higher frequencies ( Figure 4 ). The high-frequency oscillation observed in this study is comparable to that found in a temporal lobe network (14) and in a small study of five patients with schizophrenia and matched healthy comparison subjects. An unpublished study by Calhoun et al. found that the time courses for the temporal lobe network in patients showed a tendency toward more power at higher frequencies than those of normal comparison subjects. The greater fluctuations BOLD signals observed in the default mode time course components for patients in this study may reflect a lower degree of interconnection between the regions in the default mode and other brain regions (e.g., cognitive dysmetria) (43) .
Altered functional connectivity in schizophrenia has been demonstrated in many areas that evidenced altered activation in this study, including the parahippocampal and prefrontal cortices (18 , 19) . Furthermore, abnormal modulation of brain regions has also been implicated in the symptoms of the disorder (44) . The anterior cingulate has been shown to play a role as a modulator of internal speech and attending to the outside environment and also demonstrated altered activation in this study (41) . The default mode, or regions of it, may be involved in overactivity of brain regions that interfere with normal thought and functioning, thus disrupting the “internal monologue” and playing a role in the genesis of delusional thoughts and hallucinations. Previous research suggests that auditory hallucinations, experienced by patients in this study, may be due to a failure to properly interpret inner speech (45) .
An advantage of our use of individual independent component analysis in this study is that it allowed for examination of functional connectivity without specifying regions of interest beforehand. In this study, independent component analysis is consistent with other methods of data analysis for the identification of the default mode network. Independent component analysis also revealed aspects of brain activity in schizophrenia that may not be apparent through other forms of analysis. These include the differences in temporal characteristics of default mode activity and the individual differences among subjects, which will inform future research and may lead to further understanding of the mechanisms underlying schizophrenia. Another advantage of this study is the large group size. The degree to which the auditory oddball task affected the default mode is unknown because there is no previous research using the auditory oddball task to examine the default mode, to our knowledge.
This research provides strong evidence for a significantly different default mode network in patients with schizophrenia. Regions previously identified to be abnormal in schizophrenia evidence abnormalities in the default mode. In addition, abnormal cingulate modulation of the default mode may play a role in the auditory hallucinations, delusional thoughts, and attentional deficits that are hallmarks of schizophrenia.
1. Liddle PF: The symptoms of chronic schizophrenia: a re-examination of the positive-negative dichotomy. Br J Psychiatry 1987; 151:145–151Google Scholar
2. Kuperberg G, Heckers S: Schizophrenia and cognitive function. Curr Opin Neurobiol 2000; 10:205–210Google Scholar
3. Fletcher P, McKenna PJ, Friston KJ, Frith CD, Dolan RJ: Abnormal cingulate modulation of fronto-temporal connectivity in schizophrenia. Neuroimage 1999; 9:337–342Google Scholar
4. Friston KJ: Schizophrenia and the disconnection hypothesis. Acta Psychiatr Scand Suppl 1999; 395:68–79Google Scholar
5. Gusnard DA, Raichle ME: Searching for a baseline: functional imaging and the resting human brain. Nat Rev Neurosci 2001; 2:685–694Google Scholar
6. Raichle ME, MacLeod AM, Snyder AZ, Powers WJ, Gusnard DA, Shulman GL: A default mode of brain function. Proc Natl Acad Sci USA 2001; 98:676–682Google Scholar
7. Greicius MD, Krasnow B, Reiss AL, Menon V: Functional connectivity in the resting brain: a network analysis of the default mode hypothesis. Proc Natl Acad Sci USA 2003; 100:253–258Google Scholar
8. Greicius MD, Menon V: Default-mode activity during a passive sensory task: uncoupled from deactivation but impacting activation. J Cogn Neurosci 2004; 16:1484–1492Google Scholar
9. Greicius MD, Srivastava G, Reiss AL, Menon V: Default-mode network activity distinguishes Alzheimer’s disease from healthy aging: evidence from functional MRI. Proc Natl Acad Sci USA 2004; 101:4637–4642Google Scholar
10. McKiernan KA, Kaufman JN, Kucera-Thompson J, Binder JR: A parametric manipulation of factors affecting task-induced deactivation in functional neuroimaging. J Cogn Neurosci 2003; 15:394–408Google Scholar
11. Fransson P: Spontaneous low-frequency BOLD signal fluctuations: an fMRI investigation of the resting-state default mode of brain function hypothesis. Hum Brain Mapp 2005; 26:15–29Google Scholar
12. Gusnard DA, Akbudak E, Shulman GL, Raichle ME: Medial prefrontal cortex and self-referential mental activity: relation to a default mode of brain function. Proc Natl Acad Sci USA 2001; 98:4259–4264Google Scholar
13. Mazoyer B, Zago L, Mellet E, Bricogne S, Etard O, Houde O, Crivello F, Joliot M, Petit L, Tzourio-Mazoyer N: Cortical networks for working memory and executive functions sustain the conscious resting state in man. Brain Res Bull 2001; 54:287–298Google Scholar
14. Calhoun VD, Kiehl KA, Liddle PF, Pearlson GD: Aberrant localization of synchronous hemodynamic activity in auditory cortex reliably characterizes schizophrenia. Biol Psychiatry 2004; 55:842–849Google Scholar
15. Calhoun VD, Adali T, Pearlson GD, Pekar JJ: Spatial and temporal independent component analysis of functional MRI data containing a pair of task-related waveforms. Hum Brain Mapp 2001; 13:43–53Google Scholar
16. Calhoun VD, Adali T, Pearlson GD, Pekar JJ: A method for making group inferences from functional MRI data using independent component analysis. Hum Brain Mapp 2001; 14:140–151Google Scholar
17. Kiehl KA, Stevens MC, Celone K, Kurtz M, Krystal JH: Abnormal hemodynamics in schizophrenia during an auditory oddball task. Biol Psychiatry 2005; 57:1029–1040Google Scholar
18. Harrison PJ: The hippocampus in schizophrenia: a review of the neuropathological evidence and its pathophysiological implications. Psychopharmacology (Berl) 2004; 174:151–162Google Scholar
19. Meyer-Lindenberg AS, Olsen RK, Kohn PD, Brown T, Egan MF, Weinberger DR, Berman KF: Regionally specific disturbance of dorsolateral prefrontal-hippocampal functional connectivity in schizophrenia. Arch Gen Psychiatry 2005; 62:379–386Google Scholar
20. Perlstein WM, Carter CS, Noll DC, Cohen JD: Relation of prefrontal cortex dysfunction to working memory and symptoms in schizophrenia. Am J Psychiatry 2001; 158:1105–1113Google Scholar
21. Choi JS, Kang DH, Kim JJ, Ha TH, Roh KS, Youn T, Kwon JS: Decreased caudal anterior cingulate gyrus volume and positive symptoms in schizophrenia. Psychiatry Res 2005; 139:239–247Google Scholar
22. Heckers S, Rauch SL, Goff D, Savage CR, Schacter DL, Fischman AJ, Alpert NM: Impaired recruitment of the hippocampus during conscious recollection in schizophrenia. Nat Neurosci 1998; 1:318–323Google Scholar
23. First MB, Gibbon M, Williams JBW: Structured Clinical Interview for DSM-IV Axis I Disorders, Patient Edition SCID-I/P, Version 2.0. New York, New York State Psychiatric Institute, Biometrics Research Department, 1995Google Scholar
24. Kay SR, Fiszbein A, Opler LA: The Positive and Negative Syndrome Scale (PANSS) for schizophrenia. Schizophr Bull 1987; 13:261–276Google Scholar
25. Schretlen DJ, Pearlson GD, Anthony JC, Yates KO: Determinants of Benton Facial Recognition Test performance in normal adults. Neuropsychology 2001; 15:405–410Google Scholar
26. Oldfield RC: The assessment and analysis of handedness: the Edinburgh Inventory. Neuropsychologia 1971; 9:97–113Google Scholar
27. Blair JR: Predicting premorbid IQ: a revision of the National Adult Reading Test. Clin Neuropsychol 1989; 3:129–136Google Scholar
28. Worsley KJ, Friston KJ: Analysis of fMRI time-series revisited—again. Neuroimage 1995; 2:173–181Google Scholar
29. Freire L, Roche A, Mangin JF: What is the best similarity measure for motion correction in fMRI time series? IEEE Trans Med Imaging 2002; 21:470–484Google Scholar
30. Freire L, Mangin JF: Motion correction algorithms may create spurious brain activations in the absence of subject motion. Neuroimage 2001; 14:709–722Google Scholar
31. Friston KA, Frith CD, Poline JP, Heather JD, Frackowiak RS: Spatial registration and normalization of images. Hum Brain Mapp 1995; 2:159–171Google Scholar
32. Calhoun VD, Adali T, Pearlson GD, Pekar JJ: Spatial and temporal independent component analysis of functional MRI data containing a pair of task-related waveforms. Hum Brain Mapp 2001; 13:43–53Google Scholar
33. Li Y, Adali T, Calhoun VD: Estimating the number of independent components for fMRI data. Hum Brain Mapp 2006 (in press)Google Scholar
34. Bell AJ, Sejnowski TJ: An information-maximization approach to blind separation and blind deconvolution. Neur Comp 1995; 7:1129–1159Google Scholar
35. Maldjian JA, Laurienti PJ, Kraft RA, Burdette JH: An automated method for neuroanatomic and cytoarchitectonic atlas-based interrogation of fMRI data sets. Neuroimage 2003; 19:1233–1239Google Scholar
36. Genovese CR, Lazar NA, Nichols T: Thresholding of statistical maps in functional neuroimaging using the false discovery rate. Neuroimage 2002; 15:870–878Google Scholar
37. Hempel RJ, Tulen JH, van Beveren NJ, van Steenis HG, Mulder PG, Hengeveld MW: Physiological responsivity to emotional pictures in schizophrenia. J Psychiatr Res 2005; 39:509–518Google Scholar
38. Liddle PF, Friston KJ, Frith CD, Hirsch SR, Jones T, Frackowiak RS: Patterns of cerebral blood flow in schizophrenia. Br J Psychiatry 1992; 160:179–186Google Scholar
39. Hill K, Mann L, Laws KR, Stephenson CM, Nimmo-Smith I, McKenna PJ: Hypofrontality in schizophrenia: a meta-analysis of functional imaging studies. Acta Psychiatr Scand 2004; 110:243–256Google Scholar
40. Assaf M, Rivkin PR, Kuzu CH, Calhoun VD, Kraut MA, Groth KM, Yassa MA, Hart J Jr, Pearlson GD: Abnormal object recall and anterior cingulate overactivation correlate with formal thought disorder in schizophrenia. Biol Psychiatry 2006; 59:452–459Google Scholar
41. Boksman K, Theberge J, Williamson P, Drost DJ, Malla A, Densmore M, Takhar J, Pavlosky W, Menon RS, Neufeld RW: A 4.0-T fMRI study of brain connectivity during word fluency in first-episode schizophrenia. Schizophr Res 2005; 75:247–263Google Scholar
42. Talamini LM, Meeter M, Elvevag B, Murre JM, Goldberg TE: Reduced parahippocampal connectivity produces schizophrenia-like memory deficits in simulated neural circuits with reduced parahippocampal connectivity. Arch Gen Psychiatry 2005; 62:485–493Google Scholar
43. Keri S, Janka Z: “Cognitive dysmetria” in schizophrenia. Am J Psychiatry 2000; 157:662–663Google Scholar
44. Foucher JR, Vidailhet P, Chanraud S, Gounot D, Grucker D, Pins D, Damsa C, Danion JM: Functional integration in schizophrenia: too little or too much? preliminary results on fMRI data. Neuroimage 2005; 26:374–388Google Scholar
45. Allen PP, Johns LC, Fu CH, Broome MR, Vythelingum GN, McGuire PK: Misattribution of external speech in patients with hallucinations and delusions. Schizophr Res 2004; 69:277–287Google Scholar