Deactivation of the Parahippocampal Gyrus Preceding Auditory Hallucinations in Schizophrenia
Abstract
Objective
Activation in a network of language-related regions has been reported during auditory verbal hallucinations. It remains unclear, however, how this activation is triggered. Identifying brain regions that show significant signal changes preceding auditory hallucinations might reveal the origin of these hallucinations.
Method
Twenty-four patients with a psychotic disorder indicated the presence of auditory verbal hallucinations during 3-Tesla functional magnetic resonance imaging by squeezing a handheld balloon. A one-sample t test was performed to reveal groupwise activation during hallucinations. To enable analysis of brain activation 6 to 0 seconds preceding hallucinations, a tailored 'selective averaging' method, without any a priori assumptions concerning the hemodynamic response profile, was performed. To control for motor-related activation, 15 healthy comparison subjects squeezed a balloon at matched time intervals.
Results
Groupwise analysis during auditory verbal hallucinations revealed brain activation in bilateral (right more than left) language-related regions and bilateral motor regions. Prominent deactivation preceding these hallucinations was observed in the left parahippocampal gyrus. In addition, significant deactivation preceding hallucinations was found in the left superior temporal, right inferior frontal, and left middle frontal gyri as well as in the right insula and left cerebellum. No significant signal changes were revealed prior to the matched balloon squeezing among the comparison subjects.
Conclusion
Auditory verbal hallucinations in patients with a psychotic disorder are consistently preceded by deactivation of the parahippocampal gyrus. The parahippocampus has been hypothesized to play a central role in memory recollection, sending information from the hippocampus to the association areas. Dysfunction of this region could trigger inadequate activation of right language areas during auditory hallucinations.
Auditory verbal hallucinations, or 'hearing voices,' constitute a cardinal feature of psychosis. The pathophysiology of auditory hallucinations remains unknown. Previous research has shown that these hallucinations in schizophrenia are responsive to antipsychotic medication in approximately 70% of patients (1) and that the antipsychotic effect of these agents is most likely mediated by antagonism at the dopamine type 2 (D2) receptors (2). Therefore, a dopaminergic component is presumed to be involved in the origin of auditory hallucinations.
A second line of evidence is derived from neuroimaging studies demonstrating consistent activation of bilateral language-related areas during auditory hallucinations (3–9), with the most prominent activation in the right homologue of Broca"s area (9). However, since these language-related areas barely have any D2 innervations (10, 11), this cannot easily be linked to the suspected dopaminergic component. Moreover, although functional imaging of activity during hallucinations is helpful in understanding which regions are involved in the experience of hearing voices, it cannot explain how and where these experiences originate in the brain. Because auditory hallucinations arise without an external source (i.e., the experience of an actual voice), they must be triggered internally. Studying brain activation in the time period preceding the hallucinations might reveal this trigger. Therefore, we not only investigated brain activation during auditory hallucinations but also identified brain activation prior to these hallucinations.
Method
Participants
Forty-two patients with a psychotic disorder were recruited from the Department of Psychiatry, University Medical Center, Utrecht, the Netherlands, and the Parnassia Bavo Group, the Hague, the Netherlands. Patients were selected for further participation if they met the following inclusion criteria: 1) auditory hallucinations with a perceptual quality; 2) hallucination content that did not parallel thoughts (consisting of commands or derogatory critique); 3) right-handedness; 4) both hallucination and nonhallucination periods present during functional magnetic resonance imaging (fMRI); 5) a complete fMRI scan; and 6) hallucinations indicated correctly (i.e., onset of hallucinations followed by clear offset of hallucinations). To qualify for the analysis of brain activation preceding hallucinations, the following eighth inclusion criterion was added: a minimum of 6 seconds had to be present between successive hallucinations. A 6-second interval was chosen because fMRI blood-oxygen-level-dependent (BOLD) response lasts approximately 4 to 6 seconds (after neuronal activation) before reaching its peak. Also, since the time frame in which hallucinations are prepared is unknown, an extended time window was preferred. Several patients were found unsuitable for inclusion because three did not fulfill criterion 2, two did not meet criterion 4, four did not meet criterion 5, seven did not fulfill criterion 6, and two did not fulfill criterion 7. An additional nine patients were excluded from the analysis of brain activation preceding hallucinations because they did not meet criterion 8. This resulted in the inclusion of 24 patients in the analysis of brain activation during hallucinations (analysis 1) and 15 patients in the analysis of brain activation prior to hallucinations (analysis 2). Eighteen of the 24 patients in the first analysis and 11 of the 15 patients in the second analysis also participated in a previous study conducted by our research group (9).
Patients were diagnosed by an independent psychiatrist using the Comprehensive Assessment of Symptoms and History interview (12) according to DSM-IV criteria. On the day of the fMRI scan, the Positive and Negative Syndrome Scale (PANSS [13]) was used for the assessment of symptoms. Detailed characteristics of hallucinations were assessed using the auditory hallucinations subscale of the Psychotic Symptom Rating Scales (14). As a comparison group, 15 healthy subjects were recruited. A demographical description of the patients and comparison subjects is summarized in Table 1. The study was approved by the Human Ethics Committee of the University Medical Center, Utrecht, the Netherlands. After complete description of the study to the subjects, written informed consent was obtained.
 |
Experimental Design and Data Acquisition
Patients signaled the presence of auditory verbal hallucinations by squeezing a handheld balloon while functional scans were obtained continuously (12). To correct for brain activation related to balloon squeezes, the 15 healthy comparison subjects were instructed to squeeze the balloon approximately 10 times at random time intervals. This number was approximately matched to the mean number of hallucinations during the scanning periods in the first analysis.
Activation maps were obtained using a Philips Achieva 3 Tesla clinical MRI scanner (Philips Medical Systems, Best, the Netherlands). Eight-hundred BOLD fMRI scans were acquired with the following parameter settings: slices (coronal)=40, repetition time=21.75 msec, echo time=32.4 msec, flip angle=10º, field of view=224×256×160, matrix=64×64×40, voxel size=4 mm isotropic. This scan sequence achieves full brain coverage within 609 msec by combining a three-dimensional PRESTO (principle of echo shifting with a train of observations) pulse sequence with parallel imaging (SENSE [sensitivity encoding]) in two directions, using a commercial eight-channel SENSE head coil (15). After the functional scans were performed, a high-resolution anatomical scan was conducted with the following parameters: repetition time=9.86 msec, echo time=4.6 msec, voxels=0.875×0.875×1, flip angle=8º. These parameters were acquired to improve localization of the functional data (15).
Data Analysis
Preprocessing
Functional MRI data were analyzed using Statistical Parametric Mapping (SPM2) (Wellcome Department of Cognitive Neurology, London). Preprocessing included realignment of fMRI time series to correct for head motion, coregistration of fMRI data with the T1-weighted anatomical image, and spatial normalization to a standard Montreal Neurological Institute template based on the T1-weighted scan with high anatomical contrast. Finally, images were smoothed using an 8-mm full-width at half maximum Gaussian kernel.
Statistical Analysis of fMRI Responses
Analysis 1: Brain activation during auditory verbal hallucinations
To compare activation during hallucination periods with activation during nonhallucination periods, a model was created using balloon squeezes as the onset of a hallucination and the time between squeezes and releases as the duration of the hallucination. This model was convolved with the standardized hemodynamic response function from SPM2 to introduce typical delays of fMRI responses and fitted to the data using general linear model estimation (16). A one-sample t test was performed to enable groupwise analysis with a threshold of p<0.05, whole-brain corrected by the false discovery rate combined with an extent threshold of five voxels.
Analysis 2: Brain activation preceding auditory verbal hallucinations and balloon squeezes
To detect brain activation preceding hallucinations and random balloon squeezes, the finite impulse response was chosen as the basis function. Most commonly, the canonical hemodynamic response function is used as a model to detect fMRI signal changes of interest. The hemodynamic response function reflects the average shape of the slow increase and subsequent decrease in BOLD signal after a very brief moment of neuronal activation (17). However, a prerequisite of using the hemodynamic response function for the purpose of modeling fMRI data is a reasonably clear hypothesis about the onset time of the event of interest. Since it is unknown when regions implicated in the cascade of events that lead to the conscious experience of hallucinations will approximately activate, the hemodynamic response function does not represent a suitable basis function. Therefore, a set of finite impulse response functions was selected to detect brain activation preceding hallucinations. Finite impulse response function is the most general of the basis functions used to model fMRI responses and makes no assumptions about the shape and temporal resolution of the hemodynamic response. Using finite impulse response functions, a number of successive time bins ('miniboxcars') were created, typically following the onset of an event (18), with each independently modeling a single time point before the hallucination. To enable analysis of brain activation up to 6 seconds prior to the hallucination, 10 finite-impulse-response-function time bins were created, each coding for a period of 0.609 second, corresponding to the interscan interval. If the first hallucination occurred sooner than 6 seconds after the start of the paradigm, no finite-impulse-response-function time bins were modeled prior to the first hallucination. In the context of a general linear model consisting of finite-impulse-response basis functions fitted to fMRI time series on a voxel-by-voxel basis, we effectively corrected for possible overlap of subsequent BOLD responses (18). Therefore, this method is sometimes referred to as 'selective averaging.' Seven additional postonset hallucination/balloon squeeze finite-impulse-response-function time bins, designed to capture the prolonged BOLD responses of neuronal events preceding hallucinations, were entered as covariates in this analysis. In addition, since the hallucination/balloon squeeze itself was expected to explain a considerable amount of variance in the data (9), it was entered as a covariate, similar to the first analysis. To introduce typical delays of fMRI responses, this covariate was convolved with the hemodynamic response function from SPM2.
To enable groupwise analysis, data were examined through repeated-measures univariate analysis of variance (ANOVA), with the regression coefficients of the finite-impulse-response-function time bins as repeated measures. A nonsphericity correction was included in this ANOVA. Subsequently, F tests were used to calculate statistical maps, revealing voxels that showed significant signal changes at some point in the interval from 6 to 0 seconds prior to the hallucination.
The threshold was set at p<0.05, whole-brain corrected by the false discovery rate combined with an extent threshold of five voxels.
Since F tests are two-tailed, revealing both activation and deactivation, inspection of time courses was necessary to determine the direction of the signal change. For this purpose, mean poststimulus time histograms displaying the average BOLD signal were constructed from the finite-impulse-response-function regression coefficients. Poststimulus time histograms were calculated from 6 to 0 seconds preceding hallucinations (averaged over all subjects).
Furthermore, since finite impulse response function makes no assumptions about the shape and temporal resolution of the hemodynamic response, it is important to verify whether effects are indeed of a hemodynamic nature rather than being caused by movement artifacts, for instance, during the preparation of a balloon squeeze. For this reason, the realignment parameters describing head motion using three rotation and three translation parameters, derived from realignment during the preprocessing in SPM2, were acquired per subject for the 10 scans preceding the hallucination and tested using repeated-measures multivariate analyses of variance (MANOVAs). In addition, if movement led to any significant signal changes, effects would most likely be present throughout the scanned volume, including gray and white matter and out-of-brain voxels. To screen for such artifacts, average signal changes in gray and white matter and out-of-brain voxels were calculated and tested for the 10 scans preceding the hallucinations using repeated-measures ANOVAs. The analysis for the signal from out-of-brain voxels was identical to the other analyses except for the correction for temporal autocorrelation, which was not employed because voxels outside the head probably do not exhibit typical temporal dependencies known for BOLD signals acquired in the brain.
Results
Clinical Evaluation
Patients were chronically psychotic, with a mean total PANSS score of 73 (SD=15) for the 24 patients in the analysis of brain activation during hallucinations (analysis 1). These patients had an average score of 19 (SD=5) on the positive subscale, an average score of 19 (SD=0.5) on the negative subscale, and an average score of 35 (SD=9) on the scale assessing general psychopathology. The 15 patients in the analysis of brain activation prior to hallucinations (analysis 2) had a mean total PANSS score of 73 (SD=18). Their average scores on the positive, negative, and general psychopathology subscales were 20 (SD=5), 19 (SD=6), and 35 (SD=10), respectively. Details about the hallucinations as rated using the Psychotic Symptom Rating Scales interview are listed in Table 2, in which a rating of '1' signifies absent hallucinations or a very mild form of hallucinations during the last 3 months.
 |
Hallucinations During fMRI Scans
The average number of hallucinations during the fMRI scans was 14 (SD=0.85) for patients in the first analysis. The average duration of a hallucination was 17 seconds (SD=0.28), adding up to a mean total duration of hallucinations of 151 seconds (SD=121).
For the second analysis, the average number of hallucinations, average duration of a hallucination, and mean total duration of hallucinations were 11 (SD=5), 16 seconds (SD=15), and 129 seconds (SD=116), respectively. The average time between successive hallucinations was 38 seconds (SD=29).
In the comparison group, the average number of balloon squeezes was 12 (SD=4). The average duration of a balloon squeeze was 10 seconds (SD=6), adding up to a mean total duration of balloon squeezes of 122 seconds (SD=75). The average duration between successive balloon squeezes was 33 seconds (SD=20).
No statistical differences were found between the patient group in the second analysis and the comparison group for the mean number, mean duration, and total duration of the hallucinations/balloon squeezes and for the time between successive squeezes and releases.
fMRI
Analysis 1: Brain activation during auditory verbal hallucinations
As seen in Figure 1, the group analysis for hallucinations revealed activation of multiple confluent brain regions. These included language-related regions, such as the bilateral insula and inferior frontal gyrus (including Broca"s homologue) as well as the middle temporal, superior temporal, and supramarginal gyri. Other significantly activated regions consisted of the bilateral inferior parietal lobule, precentral gyrus, postcentral gyrus, cerebellum, and superior and middle frontal gyri.

aSPM2 t statistics for the groupwise analysis depict significant activity in the precentral and postcentral gyri (left), insula (center), and right inferior frontal and right middle temporal gyri (right).
For more clarity with respect to the different functional regions implicated in the group hallucination analysis, masks, created using the Automatic Anatomical Labeling Atlas (19), were overlaid on the group results. Anatomic regions were chosen based on the locations of significantly activated local maxima in the groupwise hallucination analysis. Masks consisted of the bilateral inferior frontal, middle temporal, superior temporal, supramarginal, precentral, postcentral, middle frontal, and superior frontal gyri as well as the inferior parietal lobule, insula, and cerebellum. The amount of significantly activated voxels and the coordinates of the local maximum and its t values are reported for every masked region in Table 3.
 |
Analysis 2: Brain activation preceding auditory verbal hallucinations and random balloon squeezes
The most prominent signal change preceding hallucinations was observed in the left parahippocampal gyrus. In addition, significant signal changes were found in the left superior temporal, right inferior frontal, and left middle frontal gyri as well as the right insula and left cerebellum. The largest significantly activated cluster consisted of the following two interconnected local maxima: one located in the left parahippocampal gyrus and one in the left cerebellum. Since these areas are anatomically unconnected, a functional connection of these maxima probably resulted from spatial smoothing. Inspection of the cluster coordinates revealed that 11 voxels were located in the left parahippocampus, five were located in the left cerebellum, and one voxel was placed on the boundary between these regions. Table 4 shows the coordinates of all significant local maxima in the group analysis. SPM2 F statistics are shown in Figure 2.
 |

aSPM2 F statistics for the interval 6 to 0 seconds preceding auditory verbal hallucinations depict significant signal changes in the left parahippocampal gyrus, left superior temporal gyrus, left cerebellum, left middle frontal gyrus, right insula, and right inferior frontal gyrus.
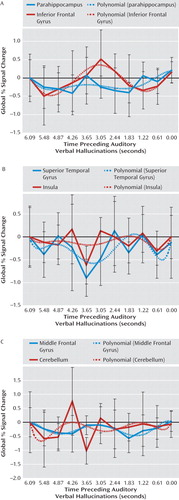
Figure 3 shows poststimulus time histogram plots from 6 to 0 seconds prior to hallucinations, averaged over all subjects, and a fitted sixth-order polynomial of all regions showing significant signal changes in the group analysis. From these poststimulus time histogram plots it can be concluded that the reported regions were significantly deactivated.
No significant effect of motion before the onset of hallucinations was revealed by the realignment parameters (for the three translation parameters as well as for the three rotation parameters), as identified by two separate repeated-measures MANOVAs, with the 10 scans preceding hallucinations as repeated measures.
Three independent repeated-measures ANOVAs, with gray and white matter and out-of-brain signal changes as dependent variables and the 10 scans preceding hallucinations as repeated measures, revealed no significant signal changes, indicating that motion artifacts cannot explain the effects detected with the finite-impulse-response analysis.
Brain Activation Preceding Balloon Squeezes
No significant signal changes were observed prior to the random balloon squeezes.
Discussion
This study investigated brain activation during auditory verbal hallucinations in 24 patients with psychosis. Brain activation during these hallucinations was primarily present in bilateral language areas. Brain activation preceding hallucinations could be investigated in 15 subjects. Groupwise analysis of signal changes up to 6 seconds preceding hallucinations showed pronounced deactivation in the left parahippocampal gyrus. Additional deactivation was observed in the left superior temporal, left middle frontal, and right inferior frontal gyri as well as the right insula and left cerebellum. These findings could not be attributed to motor activation, since groupwise analysis of activity in the 6 seconds prior to random balloon squeezes revealed no significant signal changes. Bilateral activation of language regions during hallucinations is consistent with a previous study conducted by our research group (9).
Most prominent deactivation preceding hallucinations was observed in the parahippocampal gyrus. Because the parahippocampus is D2 innervated (20), this finding might represent an important link between dopaminergic overactivity and inadequate activation of bilateral language-related areas. The parahippocampus has been hypothesized to play a central role in memory recollection, since it receives perceptual information from association cortices, such as the language areas, and forwards this information to the hippocampus in order to be 'recognized.' This perceptual information is then passed back to the parahippocampal gyrus from where it is redistributed to the association cortices involved in the original perception (21–24). Indeed, activation of association cortices originally involved in the encoded fragment has consistently been shown during memory retrieval (25–27).
In the case of auditory verbal hallucinations, increased dopaminergic stimulation may enhance the redistribution function of the parahippocampal gyrus, leading to erroneous activation of an association cortex and hence to incorrect recognition. Disinhibition of the parahippocampal gyrus, demonstrated as deactivation preceding hallucinations, then triggers the bilateral language-related areas originally involved in the perception of speech fragments, as shown in the first analysis of the preset study. According to this hypothesis, hallucinations result from the spontaneous re-experience of memories, as already hypothesized in the nineteenth century (28). Support for this hypothesis was provided in a study in which patients with hallucinations showed difficulties identifying the source of memories (29). Furthermore, increases in hallucinations have been associated with an increasing inability to inhibit irrelevant memories (30).
Deactivation instead of activation of the parahippocampus may seem at odds with its postulated role in memory recollection. However, deactivations have been reported to be realistic phenomena, probably caused by short decreases in neuronal activity (31, 32). Previous studies on memory recollection have also reported deactivation of the parahippocampus (33–37).
Apart from parahippocampal deactivation, we observed significant deactivation preceding hallucinations in the left superior temporal and right inferior frontal gyri as well as right insula. These areas correspond with regions significantly activated during hallucinations and may result from the information redistributed to them by the parahippocampus, preparing them for activation in the course of hallucinations.
Our results are partially consistent with those of previous studies. Hoffman and colleagues (38) reported deactivation of the parahippocampal and anterior cingulate gyri preceding hallucinations in six patients as well as activation of the left anterior insula and right middle temporal gyrus (38). In addition, Lennox and colleagues (39) found activity in the right middle temporal gyrus in a single subject, while Shergill and colleagues (40) found activity in the left inferior frontal and right middle temporal gyri preceding hallucinations in two subjects. Deactivations were not discussed in these studies.
Limitations and Suggestions for Future Research
A limitation of this study is that most patients were treated with antipsychotic medication. Since the effect of antipsychotic medication is probably mediated by antagonism at the D2 receptors (2) and the parahippocampus is D2 innervated (20), parahippocampal function is expected to be influenced by D2 blockade. The patients included in this study suffered from medication-resistant hallucinations. Therefore, deactivation of the parahippocampal gyrus is expected to be present in medication-free patients with psychosis prior to hallucinations, yet negative signal changes may be more pronounced in these patients. To further explore this effect, future studies should focus on brain activation preceding hallucinations in medication-free patients with psychosis.
Furthermore, a limitation of the finite impulse response can be that observed effects not necessarily reflect hemodynamic changes but instead any BOLD signal deviation from baseline. Nonetheless, in our study, analyses of signal changes in gray and white matter and out-of-brain voxels showed that movement artifacts could not have induced the observed deactivations because such artifacts should have been present in these regions also. Furthermore, the movement parameters describing head motion in the fMRI images did not differ significantly from zero before the hallucinations.
Since little a priori knowledge was available to indicate which neural and cognitive processes precede hallucinations, we selected a control condition that only controlled for motor preparation, enabling us to identify brain activation related to the actual hallucinations. A limitation of the control condition is that motor control was compared between subjects instead of within subjects. However, a within-subjects analysis was impractical as a result of the interference of hallucinations during random balloon squeezing among the patients.
In addition, a potential flaw is that significant deactivation preceding hallucinations may have resulted from subjects" delayed response to the hallucinations. In this case, peak deactivation would be expected to occur in the last seconds preceding hallucinations. However, in this study peak deactivation occurred between 4.87 and 2.44 seconds prior to hallucinations (Figure 3), which renders this explanation unlikely.
Finally, it can be argued that deactivation preceding hallucinations results from the 'poststimulus undershoot.' When applying BOLD fMRI, peak activation is followed by a short period of deactivation, which is the poststimulus undershoot. However, the poststimulus undershoot is typically present between 10 and 30 seconds after an event. Since the average time between successive hallucinations was 38 seconds in our study, this explanation also appears unlikely.
An important strength of this study is the large sample size and groupwise analyses. Furthermore, other explanations for the present findings were ruled out by including a comparison group and investigating the BOLD time course signals for motion artifacts. Finally, a particular strength is that an assumption-free finite-impulse-response model was used.
To test the model proposed in this study, future studies should focus on comparing hallucinations with word recall. An elegant design would be one in which patients recall their previous hallucinations
Conclusions
The present study showed that auditory verbal hallucinations are preceded by deactivation of the parahippocampus. Since the parahippocampus is implicated in memory recollection, dysfunction of this region could trigger inadequate activation of language-related regions, leading to auditory hallucinations. Indeed, activation of language regions was detected during these hallucinations.
1 : Auditory hallucinations: a review of psychological treatments. Schizophr Res 1998; 32:137–150 Crossref, Medline, Google Scholar
2 : Antipsychotic drug doses and neuroleptic/dopamine receptors. Nature 1976; 261:717–719 Crossref, Medline, Google Scholar
3 : Probing the pathophysiology of auditory/verbal hallucinations by combining functional magnetic resonance imaging and transcranial magnetic stimulation. Cereb Cortex 2007; 7:2733–2743 Crossref, Google Scholar
4 : Increased blood flow in Broca"s area during auditory hallucinations in schizophrenia. Lancet 1993; 342:703–706 Crossref, Medline, Google Scholar
5 : Mapping auditory hallucinations in schizophrenia using functional magnetic resonance imaging. Arch Gen Psychiatry 2000; 57:1033–1038 Crossref, Google Scholar
6 : Activation of Heschl"s gyrus during auditory hallucinations. Neuron 1999; 22:615–621 Crossref, Medline, Google Scholar
7 : Modality specific neural correlates of auditory and somatic hallucinations. J Neurol Neurosurg Psychiatry 2001; 71:688–690 Crossref, Medline, Google Scholar
8 : Can fMRI-guidance improve the efficacy of rTMS treatment for auditory verbal hallucinations? Schizophr Res 2007; 93:406–408 Crossref, Medline, Google Scholar
9 : Auditory verbal hallucinations predominantly activate the right inferior frontal area. Brain 2008; 131:3169–3177 Crossref, Medline, Google Scholar
10 : Localization of D1 and D2 dopamine receptors in brain with subtype-specific antibodies. Proc Natl Acad Sci U S A 1993; 90:8861–8865 Crossref, Medline, Google Scholar
11 : D1 and D2 dopamine receptor mRNA expression in whole hemisphere sections of the human brain. J Chem Neuroanat 2001; 22:127–137 Crossref, Medline, Google Scholar
12 : The Comprehensive Assessment of Symptoms and History (CASH): an instrument for assessing diagnosis and psychopathology. Arch Gen Psychiatry 1992; 49:615–623 Crossref, Medline, Google Scholar
13 : The Positive and Negative Syndrome Scale (PANSS) for schizophrenia. Schizophr Bull 1987; 13:261–276 Crossref, Medline, Google Scholar
14 : Scales to measure dimensions of hallucinations and delusions: the Psychotic Symptom Rating Scales (PSYRATS). Psychol Med 1999; 29:879–889 Crossref, Medline, Google Scholar
15 : Enhanced sensitivity with fast three-dimensional blood-oxygen-level-dependent functional MRI: comparison of SENSE-PRESTO and 2D-EPI at 3 T. NMR Biomed 2008; 21:663–676 Crossref, Medline, Google Scholar
16 : Analysis of fMRI time-series revisited—again. Neuroimage 1995; 2:173–181 Crossref, Medline, Google Scholar
17 : Neurophysiological investigation of the basis of the fMRI signal. Nature 2001; 412:150–157 Crossref, Medline, Google Scholar
18 : The choice of basis functions in event-related fMRI. Neuroimage 2001; 13(suppl 1):149 Crossref, Google Scholar
19 : Automated anatomical labeling of activations in SPM using a macroscopic anatomical parcellation of the MNI MRI single-subject brain. Neuroimage 2002; 15:273–289 Google Scholar
20 : Characterization and distribution of [125I]epidepride binding to dopamine D2 receptors in basal ganglia and cortex of human brain. J Pharmacol Exp Ther 1991; 257:1253–1263 Medline, Google Scholar
21 : The parahippocampal gyrus: new observations regarding its cortical connections in the monkey. Trends Neurosci 1982; 5:345–350 Crossref, Google Scholar
22 : Functional organization of the hippocampal memory system. Proc Natl Acad Sci U S A 1996; 24:13500–13507 Crossref, Google Scholar
23 : A cortical-hippocampal system for declarative memory. Nat Rev Neurosci 2000; 1:41–50 Crossref, Medline, Google Scholar
24 : The medial temporal lobe and recognition memory. Annu Rev Neurosci 2007; 30:123–152 Crossref, Medline, Google Scholar
25 : Memory"s echo: vivid remembering reactivates sensory-specific cortex. Proc Natl Acad Sci U S A 2000; 97:11125–11129 Crossref, Medline, Google Scholar
26 : Functional-neuroanatomic correlates of recollection: implications for models of recognition memory. J Neurosci 2004; 28:4172–4180 Crossref, Medline, Google Scholar
27 : Recollection and the reinstatement of encoding-related cortical activity. Cereb Cortex 2007; 17:2507–2515 Crossref, Medline, Google Scholar
28 : Die Sinnesdelirien. Allgemeine Zeitschrift für Psychiatrie und psychisch-gerichtliche Medizin 1866; 23:56–78 Google Scholar
29 : Positive symptomatology and source-monitoring failure in schizophrenia: an analysis of symptom specific effects. Psychiatry Res 2000; 95:119–131 Crossref, Medline, Google Scholar
30 : Inhibition in schizophrenia: association with auditory hallucinations. Schizophr Res 2003; 62:275–280 Crossref, Medline, Google Scholar
31 : Sustained negative bold, blood flow and oxygen consumption response and its coupling to the positive response in the human brain. Neuron 2002; 36:1195–1210 Crossref, Medline, Google Scholar
32 : Negative BOLD in the visual cortex: evidence against blood stealing. Hum Brain Mapp 2004; 21:213–220 Crossref, Medline, Google Scholar
33 : A temporoparietal and prefrontal network for retrieving the spatial context of lifelike events. Neuroimage 2001; 14:439–453 Crossref, Medline, Google Scholar
34 : The hippocampus is preferentially associated with memory for spatial context. J Cogn Neurosci 2008; 20:432–446 Crossref, Medline, Google Scholar
35 : Content-specificity of the neural correlates of recollection. Neuropsychologia 2005; 43:1022–1032 Crossref, Medline, Google Scholar
36 : A familiarity signal in human anterior medial temporal cortex? Hippocampus 2003; 13:301–304 Crossref, Medline, Google Scholar
37 : Neural correlates of successful declarative memory formation and retrieval: the anatomical overlap. Cortex 2004; 40:200–202 Crossref, Medline, Google Scholar
38 : Time course of regional brain activation associated with onset of auditory/verbal hallucinations. Br J Psychiatry 2008; 193:424–425 Crossref, Medline, Google Scholar
39 : Spatial and temporal mapping of neural activity associated with auditory hallucinations. Lancet 1999; 20:644 Crossref, Google Scholar
40 : Temporal course of auditory hallucinations. Br J Psychiatry 2004; 185:516–517 Crossref, Medline, Google Scholar