Microarray Technology: A Review of New Strategies to Discover Candidate Vulnerability Genes in Psychiatric Disorders
Abstract
OBJECTIVE: An international effort is in progress to discover candidate genes and pathways associated with psychiatric disorders, including two of the most serious diseases, schizophrenia and mood disorders, through the use of new technology—microarrays. Instead of studying one gene at a time, microarrays provide the opportunity to analyze thousands of genes at once. METHOD: This article reviews the steps in this discovery process, including the acquisition and characterization of high-quality postmortem brain tissue, RNA extraction, and preparation and use of microarray technology. Two alternative microarray methods and factors affecting the quality of array data are reviewed. RESULTS: New analytical strategies are being developed to process the massive data sets generated by microarray studies and to define the significance of implicated genes. Array results must be validated by other methods, including in situ hybridization and real-time polymerase chain reaction. Identified genes can also be evaluated in terms of their chromosomal locations and possible overlap with regions of suggestive linkage or association identified with genome-wide linkage analysis in psychiatry and in terms of overlap with genes identified by microarray studies in animals administered psychoactive drugs. Microarray studies are only the first major step in the process. Further efforts in the investigation involve multiple strategies for studying function and gene structure, including transgenic and knockout animal studies. CONCLUSIONS: Microarrays present a methodology that can identify genes or pathways for new and unique potential drug targets, determine premorbid diagnosis, predict drug responsiveness for individual patients, and, eventually, initiate gene therapy and prevention strategies.
There is currently no fundamental understanding of the genes that increase the risk for psychiatric disorders. Despite success in developing new compounds based on receptor subtypes (1, 2), a significant number of patients with these disorders remain resistant to treatment (3, 4), and there is no systematic way to determine which of a variety of treatments will be efficacious for a given patient. Limited progress has been made in identifying new and unique drug targets in these illnesses, and no objective validated diagnostic markers for these diseases have been found (5–7).
It is now clear that psychiatric disorders such as schizophrenia and depression are not caused by a single gene abnormality but, instead, by a set of abnormal genes (1). Complex trait disorders, such as schizophrenia and depression, are multifactorial diseases attributed to polygenic (more than a single gene) and epigenetic (e.g., changes in gene expression that are heritable but do not entail a change in DNA sequence) factors. Of the many challenges in research into complex trait disorders, one of the limiting factors is the time required to screen large numbers of genes. Recent advances in technology, including high-throughput methods such as microarrays, allow the screening of tens of thousands of genes (up to 30,000) in humans in a relatively short period of time (8). To date, a limited number of published studies in schizophrenia (9–18) and in mood disorders (10, 19) have used microarrays to identify candidate genes and relevant metabolic and signaling pathways. At present, there is an early consensus of the possible role of presynaptic and myelin-related genes in the pathophysiology of schizophrenia (15–17, 20). This review focuses on methods used in microarray technology and describes its relative strengths and weaknesses.
The central genetic dogma states that genomic DNA (Appendix 1) is first transcribed into mRNA, after which mRNA is translated into protein. Proteins are critical to a wide range of intra- and extracellular activities, including enzymatic, regulatory, and structural function. Microarrays monitor the transcriptome, the collection of mRNA in a cell. Estimates suggest that 50% of human transcriptome is expressed in the brain (21). Changes in mRNA expression can, but not always, result in phenotypical and morphological differences. Alterations in patterns of expression of multiple genes can offer new data concerning regulatory mechanisms and biochemical pathways. Novel genes and pathways that have never been linked to the pathophysiology of psychiatric illnesses can emerge from microarray studies to provide new insight into the disease process and potential unique therapeutic drug targets.
Molecular genetic studies, in combination with the extensive new body of sequence information for the human genome, are revolutionizing the way in which cellular processes are investigated (22). New types of experiments are possible, and discoveries are being made on an unprecedented scale. High-density DNA microarrays allow the parallel and quantitative investigation of complex mixtures of RNA and DNA (for reviews, see references 8, 21–27).
Acquisition, Characterization, and Processing of Postmortem Brain Tissue
Table 1 summarizes the flow of the discovery process for candidate vulnerability genes with microarray technology. The first steps in the process, involving the acquisition, characterization, processing, and storage of the highest-quality brain tissue, are critical to the successful use of microarrays (28). Major fundamental advances in psychiatry and neuroscience depend on the quality and use of brain banks. The federally funded Alzheimer’s Center program has developed 29 brain banks that have been critical to its success. More than 10 brain banks focused on psychiatric disorders have been established in the United States and the United Kingdom. It is important to develop systematic standardized procedures for diagnostic reliability, clinical characterization of patients and comparison subjects, and reliable sources of tissue. Obtaining tissue, contacting next of kin for informed consent, matching patients and comparison subjects, dissecting/freezing, and processing tissue, and establishing a database, and tracking samples are important components.
Processing and Storage of Brain Tissue
Acquisition of postmortem brain tissue requires establishment of a cooperative interaction with coroner’s offices, hospitals, and eye and tissue banks. Multiple daily contacts with these sources are essential to obtain postmortem material. The institutional research boards must obtain informed consent from next of kin before receiving the tissue. Once the brain tissue has been acquired, the brain can be sliced and each slice placed in a plastic envelope, photographed on each side, and flash frozen at –120°F between precooled aluminum plates. A neuropathologist should examine the tissue for abnormalities, including hemorrhage, infarcts, tumors, and plaques and tangles.
Characterization of the patients and healthy comparison subjects is particularly important and needs to include a review of the coroner’s notes and psychiatric and other medical records, with all information recorded in a database. Family interviews can provide information on psychiatric symptoms, substance abuse, and family psychiatric history. Additional database information should include age, gender, postmortem interval, brain pH, manner of death, toxicology analysis, psychiatric symptoms, substance abuse (including tobacco), age at onset of illness, and DSM-IV diagnosis. Ideally, each patient should be individually matched with important variables from healthy comparison subjects.
Regional Dissection
A great deal of information has accumulated from brain imaging (with and without pharmacological probes) and postmortem investigations to strongly implicate specific brain regions in the pathophysiology of mood disorders and schizophrenia (29–31). For example, several articles have supported the importance of the dorsolateral prefrontal cortex in schizophrenia and the limbic system in mood disorders (30, 32–34). A thorough literature review of these implicated regions is indicated to help determine the areas that are to be dissected from the brain. One approach is to use one side of the brain for microarray studies and the other side for parallel studies, including in situ hybridization to determine cell site specificity of the array findings. Methods have been perfected for placing frozen tissue into fixative in a manner that retains histological quality for in situ hybridization histochemistry (35).
RNA Extraction of Total Cellular RNA From Brain Tissue and Preparation for Microarray Hybridization
Microarrays are hybridization experiments involving comparison of relative amounts of cellular mRNA from two tissue samples. The terms “hybridize” and “hybridization” mean that a single strand of DNA or RNA consisting of unpaired nucleotide bases bonds to a respective complementary nucleotide strand of DNA or RNA. Genomic DNA is usually first transcribed into mRNA in the cell nucleus and subsequently translated into proteins in the cell cytoplasm. The amount of mRNA in the cell is thought to represent the transcription of the gene. Hence, the extraction, stabilization, and purification of total RNA that includes mRNA are important factors affecting the quality of the microarray results. Total RNA is extracted from the tissue, and the quality of the total RNA is verified by electrophoresis and spectrophotometry. The mRNA is labeled and hybridized to the array for quantification. This is achieved by introducing a fluorescent marker during the preparation of mRNA that can be detected and quantified by a laser scanner.
Methods for Profiling Gene Expression
The exploitation of hybridization in microarray analyses sharply accelerated the search for defective genes. Hybridization is based on the Watson-Crick model of base pairing of nucleic acids such that adenine (A) binds to thymine (T) (or uracil [U], in the case of RNA), and cytosine (C) binds to guanine (G). Each probe on a microarray is designed to hybridize with unknown target mRNA. In this review, the term “probe” refers to known oligonucleotides (sets of short sequences of linear nucleotides) or cDNA (complementary DNA) fragments immobilized on microarray slides. (Some authors outside the oligonucleotide chip community tend to use the reverse terminology.) When samples labeled with fluorescence are applied to microarrays, hybridization or binding reactions take place between each probe and the target mRNA. Each microarray probe recognizes cDNA sequences by base pairing (hybridization). After a series of washes to eliminate unbound nucleotides and nonspecific bindings, only the target probe complexes remain bound. Intensity of the fluorescent signal for each probe reflects the abundance of the target RNA in the RNA sample.
Microarray Gene Expression Profiling
A number of functional methods for determining gene expression have been developed, including microarrays, total gene expression analysis (TOGA), massive parallel serial sequencing (MPSS), subtraction hybridization (SBF), and serial analysis of gene expression (SAGE) (SAGE is a first-pass screening method that can be used in parallel with microarrays) (36–38). This review, however, will focus on microarrays that involve synthetic oligonucleotides or complementary DNA sequences immobilized on membranes or solid surfaces.
Oligonucleotide Probe Array Method
Affymetrix GeneChip arrays (Affymetrix Inc., Santa Clara, Calif.) are high-density oligonucleotides (probes) that are synthesized on a glass slide (22, 39). The GeneChip differs from other techniques in that the probe is generated on the slide rather than being created first and placed on the slide, as with spotted arrays. Affymetrix uses a process similar to that used in the production of solid-state semiconductors. Essentially, this method entails adding one base at a time in sequence to create the desired oligonucleotide. Synthesis involving protective chemistry and lithographic masks allows the placement of specific nucleotides in preferred locations to form multiple arrays on a single glass surface. The computer registers where each fragment or specific gene is located on the slide matrix. The known probe cDNAs that are fixed to the matrix are allowed to bind with the unknown mixture of target cDNAs. This technology allows the comparison of the expression of thousands of genes at a time between biological samples.
cDNA or Oligonucleotide Spotted Array Method
A second microarray method involves the use of robots to place or “spot” cDNA or oligonucleotides of characterized genes or ESTs (expressed sequence tags known to be expressed in the tissue but not yet characterized as genes) nucleotide sequences to a slide or membrane. The genetic material to be identified (cDNA or oligonucleotides) is washed over and allowed to hybridize to the spotted arrays, after which it is excited with lasers to activate a fluorescent signal. Scanning confocal microscopes measure the signal intensities of the hybridization. The measurements are then translated into ratios to provide relative comparisons of mRNA from different samples. The strength of the spotted arrays is that they can be customized to measure different mRNA variants.
Robots are used to control the position and spotting of the cDNA or oligonucleotides. This produces accurate high-density arrays. With this method, experimental and reference samples are typically labeled with red or green fluorochrome. Both are hybridized on the same microarray, and a measurement is obtained from each DNA site on the array. The intensity differences of the two fluorescent images are read out as differences in gene transcript abundance between the experimental and reference tissue (patient brain tissue and healthy comparison tissue). Radioactively labeled targets may also be used (40). Several companies such as CodeLink (41) have developed spotted oligonucleotide microarrays consisting of nucleotide (50–80-nucleotide) probes.
Strengths of Microarrays
The strength of microarrays is that they provide the means to repeatedly measure the expression levels of a large number of genes at a time. Relatively small amounts of total RNA can be analyzed.
Limitations of Microarrays
Microarrays are primarily a screening tool. Although traditional methods that measure gene expression (e.g., Northern blotting, RNase protection assays) are relatively labor intensive, they provide high resolution and can be used to validate or extend microarray data. Several limitations to microarrays are noted. A major limitation is a decreased sensitivity of the arrays to the detection of genes with low expression levels (low-abundance genes). Another disadvantage is that microarrays do not measure posttranslational modifications (e.g., phosphorylation) (21). Still another drawback is that it is possible to confound microarray results through a process of cross-hybridization in which specific components of the arrays will cross-hybridize because of sequence similarity of the probes as defined by Affymetrix. This is actually more of a problem with spotted DNA arrays since there is no attempt to spot onto the arrays only the portions of genes that are different from their family members. Affymetrix can, in principle, avoid this problem by using oligos corresponding to only the regions that differ in sequence between closely related genes. Finally, tissue heterogeneity remains a persistent challenge for microarray studies, particularly in brains in which there are multiple densely packed cell types. This is also true for Northern blots, SAGE, and any other non-in-situ method. Microarray measures of heterogeneous cell expression may decrease the sensitivity of microarrays by masking changes in gene expression (42). To overcome this problem, laser-capture microdissection techniques are used that can measure the expression of single cells, providing the capability of isolating homogenous samples from heterogeneous blocks of tissue (42). Microarrays and laser-capture microdissection, used in parallel, provide complementary information concerning cell-specific gene expression changes representative of larger blocks of tissue.
Verification of Quality of mRNA
It is necessary to optimize the integrity of RNA, especially in studies of the postmortem brain. In this regard, pre- and postagonal status should be recorded. It has been generally agreed that the preservation of mRNA is affected by its preagonal state. Coma, pyrexia, and hypoxia are considered to affect specific mRNA. mRNA is preserved for long periods in postmortem tissue, and the postmortem interval (time from death until freezing of the tissue) has little effect on the stability of RNA for at least 48 hours. Since the preservation of mRNA correlates with brain pH, measurement of brain tissue pH is considered to be a useful initial screening procedure in the assessment of samples (43, 44). Longer postmortem intervals do not appear to affect brain pH (data in preparation).
The evaluation of RNA sample quality is essential for interpreting microarray results. In experiments using Affymetrix GeneChips, 3′:5′ ratios (ratios of signal intensities of probes designed specifically for each end region of a gene) of housekeeping genes (genes whose expression is essential for cell function) are useful as indicators of mRNA integrity in the genes. The percentage of present call (percentage of genes detected as present in samples of total genes on the microarray) can also be used in evaluating RNA integrity in microarray experiments. When there is a problem in either RNA integrity or in another part of the microarray experiment, the percent of present call is detected as low. Correlation between arrays can be a particularly sensitive indicator for RNA integrity (data in preparation). On the basis of our analyses, arrays from samples with better RNA integrity correlate better with each other.
Additional variables need to be considered in microarray methods. Repeated freezing and thawing of RNA samples leads to degradation of the sample. Storage of RNA samples at below –70°C is essential. Conversion of samples to cDNA, rather than maintaining samples as RNA for a long time, will aid in the preservation of samples rather than maintaining samples as RNA for a long time.
Other microarray quality-control parameters include the use of multiple array experiments to eliminate noise in the data (e.g., technical duplicates in which the sample is relabeled and hybridized to a new chip) or biological replicates. Similarity of expression profiles of replicate experiments helps to validate the quality of the study. All samples not meeting rigorous standards for high-quality data should be rerun.
Validation and Localization
Microarray methods are essentially for screening, and results obtained from them need to be validated. In situ hybridization (ISH) histochemistry provides one of the important confirmations of the expression of genes in the brain and can be used at multiple levels of resolution to confirm the presence of relevant mRNA in a region of the CNS, its localization to subnuclei or layers, and the classes of cells in which it is expressed. In determining cell class, it is important to have tissue in a sufficiently well-preserved state to permit immunocytochemistry. Radioactive in situ hybridization histochemistry can be applied in a quantitative manner to confirm expression levels demonstrated by array studies and can be used to quantify numbers of neurons in cases in which the concentration of signal over cell somata is sufficiently dense and well localized (see examples of both in references 45 and 46). The limiting factor for in situ hybridization studies is the time taken to prepare oligonucleotide or complementary RNA probes for novel mRNA and the concentrated effort required to do in situ runs on multiple candidates.
Real-Time Polymerase Chain Reaction
Real-time polymerase chain reaction (RT-PCR) is another relatively high-throughput technique used for the quantification of steady-state mRNA levels. It provides high sensitivity so that rare sequences can be detected. It may also be used to detect messages from small sections of tissue so that subsections of the brain can be examined independently. Real-time polymerase chain reaction involves polymerase chain reaction amplification of a segment of the gene from mRNA that has been turned into cDNA and measurement by fluorescence of the polymerase chain reaction product formed by interactions of a green dye with the double-stranded DNA product. This method is sensitive and inexpensive.
Other real-time polymerase chain reaction methods, such as the TaqMan probe assay (Applied Biosystems, Foster City, Calif.) with florescent-labeled probes, have been developed. These technologies increase specificity of real-time polymerase chain reaction detections by way of mechanisms that activate the fluorescent signal only when the fluorescent-labeled probe is specifically bound to a target sequence.
SAGE: An Alternative to Microarray Methods
In psychiatry, there is a strong incentive to use SAGE to complement microarrays, both in terms of dealing with the sensitivity limitations of microarrays and the need to identify novel transcripts. The SAGE method is designed to produce estimates of the relative concentration of the mRNA pool in a tissue. This high-throughput strategy uses sequencing of short fragments of mRNA on a large scale (many tens of thousands to hundreds of thousands of such RNA pieces are thereby uniquely identified). It is largely seen as a means of gene expression profiling for a tissue both to determine if a tissue makes an mRNA and in the quantification of each RNA (36, 47). The SAGE method can be used to quantify various mRNAs in a tissue; however, it can require pooling tissue blocks across individuals (in order to be able to build a library large enough to detect rare mRNAs). SAGE is also very expensive. Advantages include that it does not require knowing all the transcripts beforehand, as in the case of microarrays. In one recent study, SAGE was used to evaluate the sensitivity of Affymetrix U95a human chips. It is estimated that GeneChips reliably detect 30% of hippocampal transcriptome when a gross hippocampal dissection is used as the source tissue (47).
Bioinformatics
Defining Criteria for Significance of Identified Genes
New methods of data analysis are being developed to efficiently process the massive amount of data produced by microarray studies. Systematic mathematical strategies that can be applied to large numbers of research designs become critical to correctly handle the extraordinarily large data sets. There are three algorithms in current use for oligonucleotide microarray expression analysis: MAS5 (Microarray Suite version 5, Affymetrix), dCHIP (48), and RMA (Robust Microarray Analysis) (49). These software packages condense the 20 Affymetrix probe pairs of a set, corresponding to each gene, into one value. Whatever package is used, the resulting condensed value can then be used for later statistical analyses.
With a simple two-group comparison, a t test or a Wilcoxon test is commonly used as a statistical indicator of the effect size. However, both tests have limitations in that multiple tests (thousands of observed genes) are usually performed for each sample, thus raising the possibility of false discovery, and the t test must be repeated for multiple group comparisons, increasing the number of statistical tests performed. To minimize the false positive and false negative discovery of candidate genes in a microarray, other selection criteria can be implemented, such as coupling a fold change (ratio of experimental gene expression divided by comparison gene expression) and statistical requirement together. Often investigators use signal intensity, assuming some proportionality to gene abundance, as another criterion for selection of genes to follow up for validation, functional, or structural studies.
A regression approach can be useful when evaluating differences between group means for gene expression (especially when more than two groups are being compared) and when there is consideration of variables such as diagnosis, gender, and brain region. Covariates can be built into regression analyses by using age, family history, agonal factors, and tissue factors such as pH, postmortem interval, and time to cooling of the tissue. During evaluation of more than two groups, a simple regression approach through an analysis of variance procedure is useful for incorporating repeated measurements obtained from the same sample (technical duplicate) and from different brain regions of the same patient. Currently, microarray statistical analysis software is freely available through academic ventures such as BioConductor (http://www. bioconductor.org).
Interpretation of Changes in Gene Expression
Microarrays have traditionally used fold change (the ratio of experimental gene expression divided by comparison gene expression) as an index of the magnitude of differences in gene expression between samples (50). Many factors, including data standardization and the abundance of genes, may confound fold change; therefore, other rigorous statistical approaches (see Bioinformatics) are necessary in addition to fold-change measurements (48, 50, 51). When a set of genes is identified by microarray experiments (i.e., stringently and significantly differentiated from matched comparison subjects), it is useful to describe each gene in terms of its chromosomal locus, functions, effects of psychoactive drugs, and significance in psychiatric disorders. Also needed is information about the similarity of gene sequences between human and animal genomes. Perhaps most important is the issue of whether the gene is involved in specific known metabolic or signaling pathways. What other genes are interacting with the gene of interest? Are other genes in the pathway also differentially expressed? Most microarrays contain a specific number of genes that can be categorized in 40 or more defined metabolic or signaling pathways.
Additional information is gained from microarray analysis of multiple brain regions, including data concerning whether classes of genes are globally dysregulated in many areas or only in a particular region. Analyzing multiple brain regions in two independent laboratories can serve to reduce false experiment-wide error rates, since the entire experiment is essentially replicated with multiple biological samples.
Functional Significance of Genes in Terms of Metabolic and Signaling Pathways
Once the task of identifying candidate genes is completed, the process of delineating the biological significance of the observed differential gene expression patterns begins. It involves identifying the function of individual genes or their products, clustering them to reveal their relation to each other and predicting functions of gene clusters with previously unknown functions, deducing their causal relationship to the disease under study, and defining the biochemical mechanism/pathway they could likely disrupt or through which they exert their influence and/or participate in the disease process (GO project [http://www.geneontology.org]). The functional attributes of each known gene or gene product (protein) fall into three basic categories: 1) molecular function (e.g., growth factor), 2) cellular components (cellular location) (e.g., cytoskeleton), and 3) biological process (physiological pathway) (e.g., energy metabolism) (Gene Ontology Consortium 2000). Many additional sources of relevant information are available, including the National Center for Biotechnology Information (NCBI) (http://www.ncbi. nlm.nih.gov), the NINDS/NIMH Microarray Consortium (http://arrayconsortium.cnmcresearch.org), and the German Genome Resource Center (http://www.rzpd.de).
Changes in Gene Expression Due to Medication and Epigenetic Factors
Psychoactive medication can have a significant influence on genes associated with signaling and metabolic pathways. It is important to determine which medications patients have received, their dose, lifetime exposure, and the medications taken at the time of death. The potential alterations in gene expression in postmortem brain tissue due to psychoactive drugs can be evaluated with microarray studies in rodents and nonhuman primates receiving long-term doses of medications. Epigenetic processes can be also evaluated in terms of their impact on expression changes for a given gene.
Identifying Candidate Vulnerability Genes
The top section of Figure 1 summarizes a strategy for discovering candidate vulnerability genes. Microarrays provide a unique high-throughput methodology for identifying a set of significant genes that are differentially expressed in psychiatric subjects in relation to matched comparison subjects. These genes can be validated with real-time polymerase chain reactions and their cellular location identified by in situ hybridization studies. One can then review replicated genome-wide survey-identified “hot spots” and genes located in these regions of interest. Although a number of genes occur at these hot-spot loci, the microarray-identified genes that are found at these loci may be of particular interest. A third source of candidate genes comes from the use of microarrays in animal models of psychiatric disease. For example, behavioral paradigms such as learned helplessness and the forced swim test (52) and drug treatment models in which animals are administered phencyclidine (53), amphetamine (40, 54, 55), or long-term treatment with antidepressants, mood stabilizers (56–58), or typical or atypical neuroleptics (20) provide important resources for microarray studies in psychiatric illness. It is possible to develop Venn diagrams to define genes that are similarly differentially expressed, for example, in all three classes of mood stabilizers (e.g., lithium, valproate, or carbamazepine). Finally, candidate vulnerability genes can be derived from our knowledge of the pathophysiology of circuits, neurotransmitter systems, and the pharmacology of the disease. Genes become candidates of major interest when they are 1) identified by microarray screens in patient postmortem brain tissue, 2) occur on replicated whole genome-wide hot spots, 3) are implicated in diseased rodent or nonhuman primate models, and 4) relate to metabolic or signaling pathways known to be involved in the disease.
Investigative Analyses of Candidate Vulnerability Genes
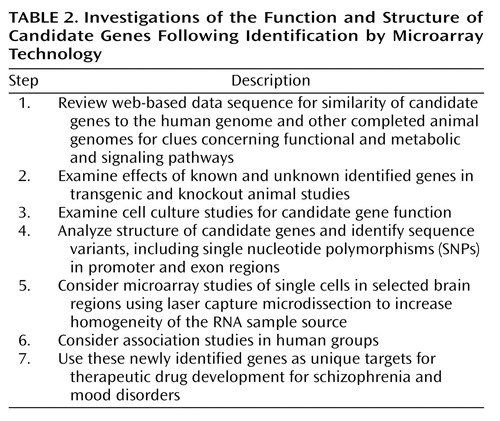
When a gene is identified as a potential candidate, studies move to the next stage of biological validation (Figure 1, bottom section). Further efforts in the investigation involve multiple strategies for studying structure and gene function. In some cases, the gene in question is a well-known one, and the fundamental question is whether it is contributing to the disease process because of alterations of its structure or in its level of expression. In other cases, the gene is either totally unknown or can be assigned to a general class of gene families but without direct evidence of its biological role. In such cases, beyond addressing the potential structural questions, one needs to begin to address its function. One approach involves tissue culture strategies. Ascertaining the functional role of a given gene by using transgenic or knockout animal models represents an ultimate test of its hypothesized role.
Gene-sequence analysis can be conducted in an attempt to identify single nucleotide polymorphisms (SNPs), variations that occur in human DNA, in the coding or in the promoter domain of the gene, splice variations, or actual mutations. By using BLAST (Basic Local Alignment Search Tool, National Center for Biotechnology Information, Bethesda, Md.), one can search the existing databases for genes with sequence similarity in human and other published animal genomes. This information may greatly help identify important functions of the gene (59).
Tissue culture strategies
Cell culture studies have been heavily used to evaluate the function of mRNA that is seen as interesting in microarray studies. This approach to understanding the biology of mRNA has considerable value, yet can be expensive, limited to certain cell types, and may reveal only a fraction of that mRNA’s function across cells or in an organ. However, a careful analysis may open many doors to a functional view of the effects of activation or inhibition of a gene, its mRNA, and the protein derived from it. This is especially true if the functions of the gene and its products are not known except for their sequences. The tissue culture expression of an mRNA and its derived protein is a good step into biology and may then lead to other studies, such as transgenic animals, knockins, and knockouts of this mRNA’s gene.
Animal models
Using microarrays to learn the pattern of gene expression in the brain (and other tissues) is a first and critical step. Substantially different hypotheses can then evolve from in situ hybridization studies, revealing a pattern that demonstrates expression in every cell versus a subset of cells. For example, a gene that is neuronal and is primarily expressed in the extended amygdala may lead us to hypotheses about a role in emotional reactivity, whereas a gene that is present at all synapses may lead to hypotheses relating to signaling or synaptic plasticity. The neuronal site expression pattern will then guide the choice of animal models to be pursued. For example, a gene highly expressed in emotional circuits will call for studies using models of anxiety-like behaviors (the elevated-plus maze, light-dark box, fear conditioning). By contrast, a gene highly expressed in the hippocampus might suggest a possible role in learning and memory (e.g., the radial-arm maze or Morris water maze).
A powerful strategy for investigating the function of a given gene is the use of transgenic and knockout mice. These approaches involve artificial interference with the level of expression of a gene in an organism, ranging from completely eliminating expression (knockout) to significant overexpression by using a transgenic approach. These tools are intrinsically very demanding in that they require the production, characterization, and maintenance of novel lines of mice. However, these approaches, if properly used, can reveal gene functions that cannot be elucidated by means of any of the nongenetic approaches. There have been significant improvements of these techniques that have resulted in enhanced control over the regional specificity of the gene expression as well as the timing of the altered expression (60–62). Control over timing and spatial expression substantially increases the ability to deduce the functions of the candidate gene. Together, this combination of tools allows a group of investigators to move a particular gene from a candidate with altered expression associated with an illness to a specific target with much better characterization of patterns of neural expression, regulation, and function. Table 2 summarizes postarray investigations, including the function and structure of identified candidate genes.
Future Developments
| 1. | In the near future, DNA microarrays will provide a method for simultaneously monitoring levels of nearly every gene transcript in the human genome. This is particularly useful in the mammalian brain, which is divided into many anatomically distinct regions. Affymetrix has used information from the draft of the human genome to design arrays (U133) that contain 39,000 gene transcripts. | ||||
| 2. | Advances in spotted DNA arrays include the greater availability and quality of full-length cDNA clones for spotting on chips. Longer oligonucleotides are also starting to be used with standard spotting technology. | ||||
| 3. | Other new applications of microarrays involve the study of binding sites for transcription factors on a genome-wide level (8). | ||||
| 4. | New discoveries in combinatorial chemical processing promise to advance microarray technology. These include new digital light processors and simplified synthesis of nucleic acids (25). | ||||
In summary, data from microarray experiments can provide powerful information to help determine the causes of psychiatric illness, the mechanisms by which psychoactive drugs work, and what gene products may be unique targets for therapy in these disorders.
 |
 |
From the Department of Psychiatry, University of California, Irvine; the Stanford Human Genome Center, Department of Genetics, Stanford University School of Medicine, Stanford, Calif.; the Mental Health Research Institute, University of Michigan, Ann Arbor; and the Center for Neuroscience, University of California, Davis. Address request reprints to Dr. W.E. Bunney, Department of Psychiatry, Med Sci I, Rm. D438, University of California, Irvine, Irvine, CA 92697; [email protected] (e-mail). The authors’ laboratories are supported by NIMH grants MH-54844, NS-21377, and NS-30109 (the latter two from the National Institute of Neurological and Communicative Disorders and Stroke), the W.M. Keck Foundation (to Dr. Jones), Silvio O. Conte Center grant MH-60398 (to Dr. W.E. Bunney), the Pritzker Family Philanthropic Fund, the William Lion Penzner Foundation (Dr. W.E. Bunney), and Program Project 5 MH-42251 (to Drs. Watson and Dr. Akil).
 |

Figure 1. Process for Discovery of Candidate Vulnerability Genes and Their Biological Investigationa
aThe top section of Figure 1 summarizes a strategy for discovering candidate vulnerability genes. When a gene is identified as a potential candidate, studies move to the next stage of biological validation (bottom section).
1. Sawa A, Snyder SH: Schizophrenia: diverse approaches to a complex disease. Science 2002; 296:692-695Crossref, Medline, Google Scholar
2. Mowry BJ, Nancarrow DJ: Molecular genetics of schizophrenia. Clin Exp Pharmacol Physiol 2001; 28:66-69Crossref, Medline, Google Scholar
3. Nemeroff CB, Owens MJ: Treatment of mood disorders. Nat Neurosci 2002; 5(Nov suppl):1068-1070Google Scholar
4. Tandon R, Jibson MD: Efficacy of newer generation antipsychotics in the treatment of schizophrenia. Psychoneuroendocrinology 2003; 28(suppl 1):9-26Google Scholar
5. Kato C, Petronis A, Okazaki Y, Tochigi M, Umekage T, Sasaki T: Molecular genetic studies of schizophrenia: challenges and insights. Neurosci Res 2002; 43:295-304Crossref, Medline, Google Scholar
6. Avissar S, Schreiber G: Toward molecular diagnostics of mood disorders in psychiatry. Trends Mol Med 2002; 8:294-300Crossref, Medline, Google Scholar
7. Johnston-Wilson NL, Bouton CM, Pevsner J, Breen JJ, Torrey EF, Yolken RH: Emerging technologies for large-scale screening of human tissues and fluids in the study of severe psychiatric disease. Int J Neuropsychopharmacol 2001; 4:83-92Crossref, Medline, Google Scholar
8. Shoemaker DD, Linsley PS: Recent developments in DNA microarrays. Curr Opin Microbiol 2002; 5:334-337Crossref, Medline, Google Scholar
9. Novak G, Kim D, Seeman P, Tallerico T: Schizophrenia and Nogo: elevated mRNA in cortex, and high prevalence of a homozygous CAA insert. Brain Res Mol Brain Res 2002; 107:183-189Crossref, Medline, Google Scholar
10. Mimmack ML, Ryan M, Baba H, Navarro-Ruiz J, Iritani S, Faull RL, McKenna PJ, Jones PB, Arai H, Starkey M, Emson PC, Bahn S: Gene expression analysis in schizophrenia: reproducible up-regulation of several members of the apolipoprotein L family located in a high-susceptibility locus for schizophrenia on chromosome 22. Proc Natl Acad Sci USA 2002; 99:4680-4685Crossref, Medline, Google Scholar
11. Middleton FA, Mirnics K, Pierri JN, Lewis DA, Levitt P: Gene expression profiling reveals alterations of specific metabolic pathways in schizophrenia. J Neurosci 2002; 22:2718-2729Crossref, Medline, Google Scholar
12. Vawter MP, Barrett T, Cheadle C, Sokolov BP, Wood WH III, Donovan DM, Webster M, Freed WJ, Becker KG: Application of cDNA microarrays to examine gene expression differences in schizophrenia. Brain Res Bull 2001; 55:641-650Crossref, Medline, Google Scholar
13. Mirnics K, Middleton FA, Lewis DA, Levitt P: Analysis of complex brain disorders with gene expression microarrays: schizophrenia as a disease of the synapse. Trends Neurosci 2001; 24:479-486Crossref, Medline, Google Scholar
14. Mirnics K, Middleton FA, Stanwood GD, Lewis DA, Levitt P: Disease-specific changes in regulator of G-protein signaling 4 (RGS4) expression in schizophrenia. Mol Psychiatry 2001; 6:293-301Crossref, Medline, Google Scholar
15. Vawter MP, Crook JM, Hyde TM, Kleinman JE, Weinberger DR, Becker KG, Freed WJ: Microarray analysis of gene expression in the prefrontal cortex in schizophrenia: a preliminary study. Schizophr Res 2002; 58:11-20Crossref, Medline, Google Scholar
16. Hakak Y, Walker JR, Li C, Wong WH, Davis KL, Buxbaum JD, Haroutunian V, Fienberg AA: Genome-wide expression analysis reveals dysregulation of myelination-related genes in chronic schizophrenia. Proc Natl Acad Sci USA 2001; 98:4746-4751Crossref, Medline, Google Scholar
17. Hof PR, Haroutunian V, Copland C, Davis KL, Buxbaum JD: Molecular and cellular evidence for an oligodendrocyte abnormality in schizophrenia. Neurochem Res 2002; 27:1193-1200Crossref, Medline, Google Scholar
18. Wurmbach E, Gonzalez-Maeso J, Yuen T, Ebersole BJ, Mastaitis JW, Mobbs CV, Sealfon SC: Validated genomic approach to study differentially expressed genes in complex tissues. Neurochem Res 2002; 27:1027-1033Crossref, Medline, Google Scholar
19. Bezchlibnyk YB, Wang JF, McQueen GM, Young LT: Gene expression differences in bipolar disorder revealed by cDNA array analysis of post-mortem frontal cortex. J Neurochem 2001; 79:826-834Medline, Google Scholar
20. Mirnics K, Middleton FA, Marquez A, Lewis DA, Levitt P: Molecular characterization of schizophrenia viewed by microarray analysis of gene expression in prefrontal cortex. Neuron 2000; 28:53-67Crossref, Medline, Google Scholar
21. Luo Z, Geschwind DH: Microarray applications in neuroscience. Neurobiol Dis 2001; 8:183-193Crossref, Medline, Google Scholar
22. Lockhart DJ, Winzeler EA: Genomics, gene expression and DNA arrays. Nature 2000; 405:827-836Crossref, Medline, Google Scholar
23. Watson SJ, Meng F, Thompson RC, Akil H: The “chip” as a specific genetic tool. Biol Psychiatry 2000; 48:1147-1156Crossref, Medline, Google Scholar
24. Watson SJ, Akil H: Gene chips and arrays revealed: a primer on their power and their uses. Biol Psychiatry 1999; 45:533-543Crossref, Medline, Google Scholar
25. Pongrac J, Middleton FA, Lewis DA, Levitt P, Mirnics K: Gene expression profiling with DNA microarrays: advancing our understanding of psychiatric disorders. Neurochem Res 2002; 27:1049-1063Crossref, Medline, Google Scholar
26. Cowan WM, Kopnisky KL, Hyman SE: The human genome project and its impact on psychiatry. Annu Rev Neurosci 2002; 25:1-50Crossref, Medline, Google Scholar
27. Shilling PD, Kelsoe JR: Functional genomics approaches to understanding brain disorders. Pharmacogenomics 2002; 3:31-45Crossref, Medline, Google Scholar
28. Akbarian S, Kim JJ, Potkin SG, Hetrick WP, Bunney WE Jr, Jones EG: Maldistribution of interstitial neurons in prefrontal white matter of the brains of schizophrenic patients. Arch Gen Psychiatry 1996; 53:425-436Crossref, Medline, Google Scholar
29. Dunn RT, Kimbrell TA, Ketter TA, Frye MA, Willis MW, Luckenbaugh DA, Post RM: Principal components of the Beck Depression Inventory and regional cerebral metabolism in unipolar and bipolar depression. Biol Psychiatry 2002; 51:387-399Crossref, Medline, Google Scholar
30. Bunney WE, Bunney BG: Evidence for a compromised dorsolateral prefrontal cortical parallel circuit in schizophrenia. Brain Res Brain Res Rev 2000; 31:138-146Crossref, Medline, Google Scholar
31. Ketter TA, George MS, Kimbress TA, Willis MW, Benson BE, Post RM: Neuroanatomical models and brain imaging studies, in Bipolar Disorder: Biological Models and Their Clinical Applications. Edited by Young LT, Joffe RT. New York, Marcel Dekker, 1997, pp 179-217Google Scholar
32. Wu J, Buchsbaum MS, Gillin JC, Tang C, Cadwell S, Keator D, Fallon JH, Wiegand M, Najafi A, Klein E, Hazen K, Bunney WE Jr: Prediction of antidepressant effects of sleep deprivation by metabolic rates in the ventral anterior cingulate and medial prefrontal cortex. Am J Psychiatry 1999; 156:1149-1158; correction, 156:1666Abstract, Google Scholar
33. Mayberg HS: Limbic-cortical dysregulation: a proposed model of depression. J Neuropsychiatry Clin Neurosci 1997; 9:471-481Crossref, Medline, Google Scholar
34. Tamminga CA, Vogel M, Gao X, Lahti AC, Holcomb HH: The limbic cortex in schizophrenia: focus on the anterior cingulate. Brain Res Brain Res Rev 2000; 31:364-370Crossref, Medline, Google Scholar
35. Jones EG, Hendry SH, Liu XB, Hodgins S, Potkin SG, Tourtellotte WW: A method for fixation of previously fresh-frozen human adult and fetal brains that preserves histological quality and immunoreactivity. J Neurosci Methods 1992; 44:133-144Crossref, Medline, Google Scholar
36. Velculescu VE: Essay: Amersham Pharmacia Biotech and Science Prize: tantalizing transcriptomes—SAGE and its use in global gene expression analysis. Science 1999; 286:1491-1492Crossref, Medline, Google Scholar
37. Sutcliffe JG, Foye PE, Erlander MG, Hilbush BS, Bodzin LJ, Durham JT, Hasel KW: TOGA: an automated parsing technology for analyzing expression of nearly all genes. Proc Natl Acad Sci USA 2000; 97:1976-1981Crossref, Medline, Google Scholar
38. Brenner S, Johnson M, Bridgham J, Golda G, Lloyd DH, Johnson D, Luo S, McCurdy S, Foy M, Ewan M, Roth R, George D, Eletr S, Albrecht G, Vermaas E, Williams SR, Moon K, Burcham T, Pallas M, DuBridge RB, Kirchner J, Fearon K, Mao J, Corcoran K: Gene expression analysis by massively parallel signature sequencing (MPSS) on microbead arrays. Nat Biotechnol 2000; 18:630-634Crossref, Medline, Google Scholar
39. Lipshutz RJ, Fodor SP, Gingeras TR, Lockhart DJ: High-density synthetic oligonucleotide arrays. Nat Genet 1999; 21(1 suppl):20-24Google Scholar
40. Barrett T, Xie T, Piao Y, Dillon-Carter O, Kargul GJ, Lim MK, Chrest FJ, Wersto R, Rowley DL, Juhaszova M, Zhou L, Vawter MP, Becker KG, Cheadle C, Wood WH III, McCann UD, Freed WJ, Ko MS, Ricaurte GA, Donovan DM: A murine dopamine neuron-specific cDNA library and microarray: increased COX1 expression during methamphetamine neurotoxicity. Neurobiol Dis 2001; 8:822-833Crossref, Medline, Google Scholar
41. Ramakrishnan R, Dorris D, Lublinsky A, Nguyen A, Domanus M, Prokhorova A, Gieser L, Touma E, Lockner R, Tata M, Zhu X, Patterson M, Shippy R, Sendera TJ, Mazumder A: An assessment of Motorola CodeLink microarray performance for gene expression profiling applications. Nucleic Acids Res 2002; 30(7):e30Google Scholar
42. Torres-Munoz J, Stockton P, Tacoronte N, Roberts B, Maronpot RR, Petito CK: Detection of HIV-1 gene sequences in hippocampal neurons isolated from postmortem AIDS brains by laser capture microdissection. J Neuropathol Exp Neurol 2001; 60:885-892Crossref, Medline, Google Scholar
43. Kingsbury AE, Foster OJ, Nisbet AP, Cairns N, Bray L, Eve DJ, Lees AJ, Marsden CD: Tissue pH as an indicator of mRNA preservation in human post-mortem brain. Brain Res Mol Brain Res 1995; 28:311-318Crossref, Medline, Google Scholar
44. Barton AJ, Pearson RC, Najlerahim A, Harrison PJ: Pre- and postmortem influences on brain RNA. J Neurochem 1993; 61:1-11Medline, Google Scholar
45. Akbarian S, Kim JJ, Potkin SG, Hagman JO, Tafazzoli A, Bunney WE Jr, Jones EG: Gene expression for glutamic acid decarboxylase is reduced without loss of neurons in prefrontal cortex of schizophrenics. Arch Gen Psychiatry 1995; 52:258-266Crossref, Medline, Google Scholar
46. Akbarian S, Sucher NJ, Bradley D, Tafazzoli A, Trinh D, Hetrick WP, Potkin SG, Sandman CA, Bunney WE Jr, Jones EG: Selective alterations in gene expression for NMDA receptor subunits in prefrontal cortex of schizophrenics. J Neurosci 1996; 16:19-30Crossref, Medline, Google Scholar
47. Evans SJ, Datson NA, Kabbaj M, Thompson RC, Vreugdenhil E, De Kloet ER, Watson SJ, Akil H: Evaluation of Affymetrix Gene Chip sensitivity in rat hippocampal tissue using SAGE (serial analysis of gene expression) analysis. Eur J Neurosci 2002; 16:409-413Crossref, Medline, Google Scholar
48. Li C, Hung Wong W: Model-based analysis of oligonucleotide arrays: model validation, design issues and standard error application. Genome Biol 2001; 2(8):RESEARCH0032Google Scholar
49. Irizarry RA, Hobbs B, Collins F, Beazer-Barclay YD, Antonellis KJ, Scherf U, Speed TP: Exploration, normalization, and summaries of high-density oligonucleotide array probe level data. http://biosun01.biostat.jhsph.edu/~ririzarr/papers/affy1.pdfGoogle Scholar
50. Draghici S: Statistical intelligence: effective analysis of high-density microarray data. Drug Discov Today 2002; 7:S55-S63Google Scholar
51. Yang YH, Speed T: Design issues for cDNA microarray experiments. Nat Rev Genet 2002; 3:579-588Crossref, Medline, Google Scholar
52. Nestler EJ, Gould E, Manji H, Buncan M, Duman RS, Greshenfeld HK, Hen R, Koester S, Lederhendler I, Meaney M, Robbins T, Winsky L, Zalcman S: Preclinical models: status of basic research in depression. Biol Psychiatry 2002; 52:503-528Crossref, Medline, Google Scholar
53. Joo A, Shibata H, Ninomiya H, Kawasaki H, Tashiro N, Fukumaki Y: Structure and polymorphisms of the human metabotropic glutamate receptor type 2 gene (GRM2): analysis of association with schizophrenia. Mol Psychiatry 2001; 6:186-192Crossref, Medline, Google Scholar
54. Niculescu AB III, Segal DS, Kuczenski R, Barrett T, Hauger RL, Kelsoe JR: Identifying a series of candidate genes for mania and psychosis: a convergent functional genomics approach. Physiol Genomics 2000; 4:83-91Crossref, Medline, Google Scholar
55. Niculescu AB III, Kelsoe JR: The human genome: genetic testing and animal models (image, neuro). Am J Psychiatry 2001; 158:1587Link, Google Scholar
56. Bosetti F, Seemann R, Bell JM, Zahorchak R, Friedman E, Rapoport SI, Manickam P: Analysis of gene expression with cDNA microarrays in rat brain after 7 and 42 days of oral lithium administration. Brain Res Bull 2002; 57:205-209Crossref, Medline, Google Scholar
57. Yamada M, Yamazaki S, Takahashi K, Nara K, Ozawa H, Yamada S, Kiuchi Y, Oguchi K, Kamijima K, Higuchi T, Momose K: Induction of cysteine string protein after chronic antidepressant treatment in rat frontal cortex. Neurosci Lett 2001; 301:183-186Crossref, Medline, Google Scholar
58. Manji HK, Chen G: PKC, MAP kinases and the bcl-2 family of proteins as long-term targets for mood stabilizers. Mol Psychiatry 2002; 7(suppl 1):S46-S56Google Scholar
59. Pennacchio LA, Olivier M, Hubacek JA, Cohen JC, Cox DR, Fruchart JC, Krauss RM, Rubin EM: An apolipoprotein influencing triglycerides in humans and mice revealed by comparative sequencing. Science 2001; 294:169-173Crossref, Medline, Google Scholar
60. Tsien JZ, Chen DF, Gerber D, Tom C, Mercer EH, Anderson DJ, Mayford M, Kandel ER, Tonegawa S: Subregion- and cell type-restricted gene knockout in mouse brain. Cell 1996; 87:1317-1326Crossref, Medline, Google Scholar
61. Mayford M, Bach ME, Huang YY, Wang L, Hawkins RD, Kandel ER: Control of memory formation through regulated expression of a CaMKII transgene. Science 1996; 274:1678-1683Crossref, Medline, Google Scholar
62. DePrato Primeaux S, Holmes PV, Martin RJ, Dean RG, Edwards GL: Experimentally induced attenuation of neuropeptide-Y gene expression in transgenic mice increases mortality rate following seizures. Neurosci Lett 2000; 287:61-64Crossref, Medline, Google Scholar