A Comparison of Three Scales for Assessing Social Functioning in Primary Care
Abstract
OBJECTIVE: Assessment of functional status is increasingly important in clinical trials and outcome research. Although several scales for assessing functioning are widely used, they vary in coverage, and direct comparisons among them are rare. Comparative information is useful in guiding selection of appropriate scales for research applications. METHOD: Results from three scales that measure functioning—the Medical Outcomes Study 36-item Short-Form Health Survey, the Social Adjustment Scale Self-Report, and the Social Adaptation Self-Evaluation Scale—were compared in a consecutively selected sample of 211 patients coming to primary care. Patients also received psychiatric assessments. RESULTS: All three scales were acceptable to patients, showed few significant correlations with demographic variables, and were able to differentiate psychiatrically ill and well patients. Correlations among scales, even among scale items that assessed similar domains of functioning, were modest. CONCLUSIONS: Although all three scales are presumed to assess functional status, their item content and coverage differ. Selection of a scale requires a review of the scale items and consideration of research priorities and the characteristics of the study group. If functional status is a critical outcome measure, use of more than one scale may be necessary.
It is widely recognized that the major mental illnesses impair daily functioning (1–4). Therefore, new psychopharmacologic and psychosocial treatments are often evaluated for their effects on symptoms, as well as functional status (5–7). These latter assessments are increasingly important in cost-effectiveness projections.
Official classifications also reflect an increasing interest in functional assessment. The APA’s DSM first included an assessment of functioning on axis V in 1980 (DSM-III) and subsequently added a separate Global Assessment of Functioning scale in 1994 (DSM-IV). The World Health Organization has developed a separate classification system for impairments, disabilities, and social consequences of diseases (8, 9). A recent report from the National Institute of Mental Health (NIMH) recommended continuing the development of tools to assess functioning as a means of measuring the economic and social burden of mental disorders (10).
In clinical research, self-administered scales are widely used to survey patients directly about their functional status. Despite the popularity of self-administered scales, surprisingly little attention has been given to the issue of scale selection. Scales vary in breadth and in the variety of covered dimensions, item content within each dimension, and the range of function represented. Some definitions of health implicit in functional scales emphasize the level of impairment or functional disturbance (11), while others conceive of health not simply as the absence of disease or disability, but as the presence of affirmative capacities and well-being (12, 13).
Because functional scales vary in coverage and content, it is important to describe how response patterns on individual scales differ from one another. Unfortunately, direct comparisons are rare. To our knowledge, no published study has compared scores on any two of the three functional scales included in the study reported here: the Medical Outcomes Study 36-item Short-Form Health Survey (14) and the Social Adjustment Scale Self-Report (15)—both of which have been widely used in clinical trials and outcomes research—and the more recently developed Social Adaptation Self-Evaluation Scale (12, 13). The latter scale has been used in European clinical trials (16, 17) and is currently being studied in the United States.
In the study reported here, we first assessed the acceptability of the three scales in an adult primary care population. Then we examined the demographic correlates of scale scores and intercorrelations among the three scales. Finally, we evaluated the ability of each scale to differentiate patients with acute psychiatric symptoms from asymptomatic patients.
Method
Patient Recruitment and Diagnostic Assessment
This study was conducted at the Associates in Internal Medicine at the College of Physicians and Surgeons of Columbia University. The clinic provides approximately 54,000 medical visits annually to 18,000 patients from an ethnically and racially diverse community. Between October 1998 and April 1999, a systematically selected sample of primary care patients with scheduled appointments were approached in the waiting room and invited to participate. To be eligible for the study, patients had to be 1) between 18 and 70 years of age, 2) scheduled for face-to-face contact with a primary care physician, 3) not a first-time visitor to the clinic, 4) able to understand Spanish or English, 5) of a general health status that did not preclude survey completion, and 6) not actively homicidal or suicidal. The latter patients were given appropriate emergency care. The institutional review board of the Departments of Medicine and Psychiatry approved the protocol. All participants provided signed informed consent.
Of the approximately 3,400 patients who were prescreened, 1,266 met eligibility criteria for phase 1 of the study. The most common reasons for exclusion were age (44%) and not having a scheduled visit with a primary care physician (31%). Four patients were excluded because of active suicidal plans. Of the 1,266 who met eligibility criteria, 1,007 (79.5%) consented to participate. Consenters were similar to nonconsenters in gender and race/ethnicity; however, nonconsenters were slightly older (mean=55.5 years, SD=11.3, versus mean=53.2 years, SD=12.2) (t=2.40, df=1, 1188, p=0.02).
Of the 1,007 patients who participated in phase 1, a random subsample (N=271) was invited to participate in the second phase. Those who were selected for phase 2 and those who were not selected did not differ significantly in age, gender or racial/ethnic distribution, educational level, or household income. Of the subsample of 271, consenters (N=223, 82.3%) did not differ from nonconsenters (N=48, 17.7%) in age, gender or racial/ethnic distribution, or household income. However, consenters were somewhat more educated (median attainment of “ninth to 11th grade” versus “eighth grade or below” for nonconsenters, Mann-Whitney U=4024.50, z=2.81, p=0.005). Interview data for 12 subjects were lost because of computer malfunction, resulting in a final phase 2 sample of 211 subjects. These 211 subjects did not differ from the remainder of the original sample eligible for phase 1 (N=1,055) in age, gender, or race/ethnicity.
During phase 1, demographic, screening, treatment utilization, and some social functioning data, described elsewhere (18), were obtained. The second phase included a diagnostic assessment with the Composite International Diagnostic Interview, version 2.1 (19) (for DSM-IV), conducted by experienced mental health professionals (psychologists or social workers) who had completed training in the use of this instrument. All assessments were translated from English to Spanish and back-translated by a bilingual team of mental health professionals. The Composite International Diagnostic Interview was conducted within a week of screening for 77% of the sample (range=0–39 days, median=4). The Social Adaptation Self-Evaluation Scale was completed during phase 1, and the 36-item Short-Form Health Survey and Social Adjustment Scale Self-Report were completed during phase 2.
Social Functioning Scales
Medical Outcomes Study 36-Item Short-Form Health Survey
The 36-item Short-Form Health Survey is a self-report scale constructed to collect data on health status, functioning, and well-being for the Medical Outcomes Study (3, 14, 20, 21). The time period covered by most items is 4 weeks. The number of response choices varies across items, from two (yes/no) to six (anchored by “all of the time” and “none of the time”). Eight health concepts are assessed: physical functioning and limitations in physical activities because of health problems; social functioning and limitations in social activities because of physical or emotional problems; role—physical, and limitations in usual role activities because of physical health problems; bodily pain; mental health and psychological distress and well-being; role—emotional, and limitations in usual role activities because of emotional problems; vitality, energy, and fatigue; and perceptions of one’s general health.
In the current study, scores for the eight subscales and the physical and mental component summary scales were calculated by using official Short-Form Health Survey algorithms (20, 21). The summary scales are computed by aggregating subscale scores according to the factor structure of the subscales in the general U.S. population. Unlike the eight subscales, the two summary scale scores have norms based on the general U.S. population (mean=50, SD=10) (21).
Social Adjustment Scale Self-Report
The Social Adjustment Scale Self-Report (15, 22) is a self-report scale with 54 questions that measure instrumental and expressive role performance over the past 2 weeks. It includes questions on work for pay, unpaid work, and work as a student; social and leisure activities, relationships with the extended family, the marital partner, one’s children, and relationships within the family unit; and perception of economic functioning. The questions within each area cover performance at expected tasks, friction with people, finer aspects of interpersonal relationships, and feelings and satisfactions. Each item is scored on a 5-point scale with higher scores indicating poorer functioning. The Social Adjustment Scale Self-Report contains skip-outs, so that nonapplicable items are omitted. Scores for each role area are calculated by averaging the scores for all answered items within that area. The total Social Adjustment Scale Self-Report score is calculated by averaging all applicable items (however, only the work items pertaining to the primary work role are included).
Social Adaptation Self-Evaluation Scale
The Social Adaptation Self-Evaluation Scale is a 21-item self-rating scale developed to detect presumed treatment differences in social motivation and behavior that may not be discernible in psychiatric assessment (13). The scale was developed by Pharmacia-Upjohn as a tool for determining differential effects of a selective noradrenaline reuptake inhibitor, which was presumed to have an increased effect on drive and motivation toward action, as compared to selective serotonin reuptake inhibitors (SSRIs) (17, 23). The Social Adaptation Self-Evaluation Scale focuses on the patient’s self-perception and motivation toward action rather than on objective performance. The scale was validated in a large general population survey, and its external and internal validity, test-retest reliability, and sensitivity to change have been described (13). The time period assessed is “now.” The first two items (interest in one’s occupation and one’s home-related activities) are mutually exclusive for scoring purposes. If the respondent endorses having an occupation, the occupation item is used, otherwise the home-related item is used. A total of 20 items are summed for a possible total score of 0 to 60. Higher scores indicate higher functioning. Only data on total scores have been published.
Statistical Analyses
Statistical analyses were performed with SPSS for Windows, version 9.0 (SPSS, Inc., Chicago). Feasibility of the three scales was assessed by 1) the number of patients who refused to fill out the scales and 2) the number of patients who answered all the items. Skipped items on the Social Adjustment Scale Self-Report were not considered missing if the corresponding role area did not apply to the patient.
Pearson product-moment correlations were used to measure associations among continuous variables, including age and all of the social functioning scores. Student’s t test and analysis of variance were used, where appropriate, to compare functioning scores among groups on the basis of gender, language of choice, race/ethnicity, and diagnostic status. When group variances were significantly different (p<0.05), we used the corrected degrees of freedom (df). In such cases, the df is reported with two decimal places and the nominal df is provided in brackets. All tests were two-tailed with an alpha of 0.05. To help control the rate of type I error, we did multiple group comparisons only when the omnibus F was significant at p<0.05.
Results
Subjects
The 211 patients were primarily female (N=161, 76.3%). The mean age of the overall group was 54 years (SD=12, range=21–70); 69.7% were Hispanic (N=147), 23.7% were non-Hispanic African American (N=50), and 6.6% were non-Hispanic white or other (N=14). Most of the Hispanic subjects (N=122, 83.0%) selected the Spanish version of the survey. Only 30.8% of the subjects (N=65) were married or living with a partner, 37.0% (N=78) were separated or divorced, 12.8% (N=27) were widowed, and 19.4% (N=41) had never been married. A majority (N=180, 85.3%) reported that their household income over the past year was less than $12,000; 52.1% (N=110) had not graduated from high school, 23.2% (N=49) were high school graduates, and 24.6% (N=52) had attended at least some college.
Acceptability of Scales
Acceptability as measured by the patients’ completion of questions was excellent for all three scales. The percentage of patients who filled out all questions was 96.2% (N=203) for the Short-Form Health Survey, 88.2% (N=186) for the Social Adjustment Scale Self-Report, and 98.6% (N=208) for the Social Adaptation Self-Evaluation Scale. In most cases, the number of questions left unanswered was between one and three. Only a few patients left all scale items blank. Four patients each refused to answer the Short-Form Health Survey (1.9%) and the Social Adjustment Scale Self-Report (1.9%), and no patients refused to answer the Social Adaptation Self-Evaluation Scale (0%).
Correlations With Demographic Variables
Gender
There were no significant gender differences in the Short-Form Health Survey physical component summary scale or the Social Adaptation Self-Evaluation Scale scores. However, women were significantly more impaired than men according to their total scores on the Social Adjustment Scale Self-Report (t=2.00, df=205, p<0.05) and their scores on the Short-Form Health Survey mental component summary scale (t=3.61, df=94.48 [201], p=0.0005). The significantly greater impairment of women was largely accounted for by their scores on social (t=2.14, df=205, p<0.05), marital (t=2.16, df=65, p<0.05), and parental (t=2.70, df=91.47 [92], p<0.01) roles on the Social Adjustment Scale Self-Report, and by scores on the vitality (t=2.60, df=204, p=0.01), role—emotional (t=3.65, df=102.78 [204], p<0.0005), and mental health (t=2.83, df=204, p=0.005) subscales of the Short-Form Health Survey.
Age
There were no significant correlations between age and the total score or role area scores on the Social Adjustment Scale Self-Report (total score: r=0.02, work: r=0.04, social and leisure: r=0.08, extended family: r=–0.02, marital: r=–0.05, parental: r=0.12, family unit: r=–0.06, economic: r=–0.02, df=65–205, all n.s.); or scores on the mental health-oriented Short-Form Health Survey subscales (mental health: r=–0.03, role—emotional: r=0.05, social functioning: r=0.02, vitality: r=–0.05, df=204–205, all n.s.) or the Social Adaptation Self-Evaluation Scale (r=–0.05, df=209, n.s.). However, age was significantly associated with the physical health-oriented Short-Form Health Survey subscales (physical functioning: r=–0.28, df=204, p<0.0001; role—physical: r=–0.14, df=203, p<0.05; bodily pain: r=–0.14, df=205, p<0.05; general health: r=–0.16, df=203, p=0.02) and physical component summary scale scores (r=–0.31, df=201, p<0.0001), with older subjects rating themselves as more impaired.
Race/ethnicity
There were few racial/ethnic differences in scores on the Short-Form Health Survey or the Social Adjustment Scale Self-Report. Differences across the three scales were significant only for the Social Adjustment Scale Self-Report family unit role (F=3.20, df=2, 181, p<0.05) and the mental health subscale of the Short-Form Health Survey (F=6.05, df=2, 203, p<0.005). Multiple comparisons indicated that Hispanics had worse ratings than the rest of the sample on mental health and worse ratings than African Americans on family unit role. Social Adaptation Self-Evaluation Scale scores differed by race/ethnicity (F=6.92, df=2, 208, p=0.001), with Hispanics and African Americans rating themselves as significantly more impaired than patients in the group of non-Hispanic whites and others.
Language of choice
Respondents on the English and Spanish versions of the instruments differed significantly on five indices. English speakers rated themselves as significantly less impaired than Spanish speakers on the Short-Form Health Survey mental health subscale and mental component summary scale, the Social Adjustment Scale Self-Report family unit and economic roles, and the Social Adaptation Self-Evaluation Scale. However, Spanish-speaking respondents had lived significantly less time in the United States than English-speaking respondents (mean=24 years, SD=11, versus mean=47 years, SD=17) (t=10.38, df=126.88 [207], p<0.0001). To control for possible acculturative effects, we covaried for years lived in the United States on these five indices, and significant differences remained for only two, the Short-Form Health Survey mental health subscale (F=8.89, df=1, 201, p<0.005) and the Social Adaptation Self-Evaluation Scale (F=7.06, df=1, 206, p<0.01).
Correlations Among Scales
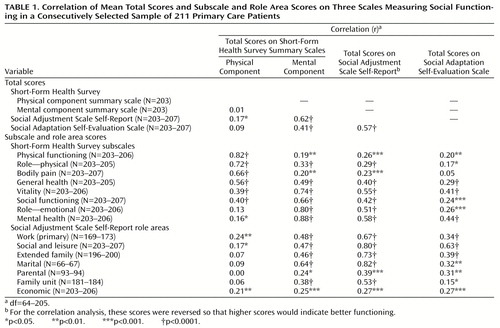
Correlations among the three scales were statistically significant but modest for the Social Adjustment Scale Self-Report and Social Adaptation Self-Evaluation Scale total scores and for ratings of social functioning or mental symptoms on the Short-Form Health Survey. Correlations between ratings of physical symptoms on the Short-Form Health Survey and ratings of mental symptoms or social functioning on the three scales were generally lower or not statistically significant (Table 1).
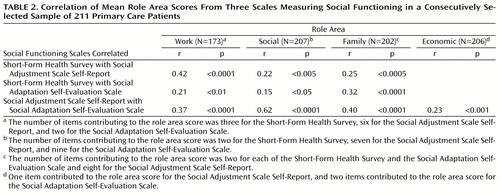
Items measuring the same areas among the three scales were compared. These areas included work, social, family, and economic functioning (Table 2). Although all of the correlations within each area among the assessments were statistically significant, the overall correlations were still modest (r=0.15–0.42) except for the higher correlation between the Social Adjustment Scale Self-Report and Social Adaptation Self-Evaluation Scale for social functioning (r=0.62).
Differentiating Between Ill and Well Patients
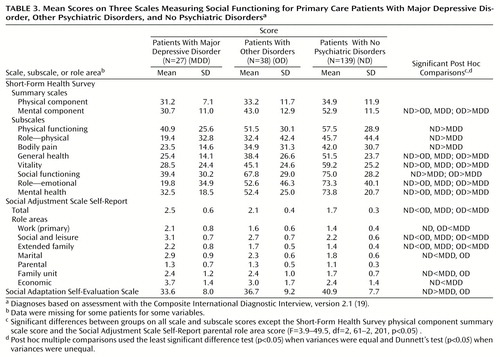
We next determined whether the scales differentiated between some diagnostic groups. Because of the extensive literature on the association between depression and functional impairment (3, 4), we hypothesized that depressed patients would exhibit the most impairment. The group of patients with current major depressive disorder was compared to the group without major depressive disorder but with at least one other current Composite International Diagnostic Interview disorder, and with a comparison group of patients with no current Composite International Diagnostic Interview disorders. Seven of the 211 subjects were excluded from the analysis because of missing diagnostic data. The three groups did not differ significantly in gender (χ2=5.63, df=2, p=0.06), age (F=0.58, df=2, 201, p=0.56), or race/ethnicity (χ2=5.78, df=4, p=0.22).
Across nearly all of the scores there was a consistent pattern of greater impairment from the normal comparison group to the major depressive disorder group (Table 3). Formal tests revealed that the Short-Form Health Survey scores for all three groups were significantly different on four subscales (general health, vitality, role—emotional, and mental health) and the mental component summary scale. In addition, the major depressive disorder group rated themselves as more impaired on the social functioning subscale than both the group with other psychiatric disorders and the normal comparison group. The major depressive disorder group was significantly more impaired than the normal comparison group on the physical functioning, role—physical, and bodily pain subscales, and there were no significant group differences in scores on the Short-Form Health Survey physical component summary scale. On the Social Adjustment Scale Self-Report, all three groups were significantly different on total scores, social and leisure role, and extended family role. The major depressive disorder group was significantly more impaired than normal comparison subjects on all role areas of the Social Adjustment Scale Self-Report except the parental role. On the Social Adaptation Self-Evaluation Scale, those with any diagnosis were more impaired than those with no diagnosis. The social functioning scales were also able to differentiate groups based on the number of current Composite International Diagnostic Interview diagnoses (none, 1, or 2 or more). (Data available on request.)
Discussion
Psychiatric clinical efficacy, effectiveness, and outcome studies increasingly include measures of functional status. We present the first direct comparison of three scales: the Short-Form Health Survey, the Social Adjustment Scale Self-Report, and the Social Adaptation Self-Evaluation Scale. The Short-Form Health Survey and the Social Adjustment Scale Self-Report have been used together in a large drug trial with dysthymic patients. The results were reported as parallel outcome measures or in comparison to published norms (5). One other study compared the reading levels of the Short-Form Health Survey and the Social Adjustment Scale Self-Report and showed they were comparable (24).
In our study all three scales were acceptable to patients, in that patients were able to complete the forms. The Social Adjustment Scale Self-Report and the Short-Form Health Survey were sensitive to gender differences, probably because they include assessments of family and marital functioning. The Short-Form Health Survey was more sensitive to age differences on items assessing physical health. There were few race/ethnicity or language differences on any of the scales.
Correlations among scales were statistically significant but modest. However, the physical component summary scale of the Short-Form Health Survey had little correlation with the other scales or with the mental health-oriented subscales of the same scale. It is no surprise that the Short-Form Health Survey physical and mental components did not correlate, since they were originally created from an orthogonal rotation of factor scores. The fact that the physical component does not correlate with the other scales suggests that this component is measuring a unique domain. All scales were able to differentiate psychiatrically ill from well subjects. The correlations between scales were modest even in the areas covering similar domains. A comparison of the questions used for work assessment shows how the approaches of the three scales differ (Figure 1). The Short-Form Health Survey focuses on work performance; the Social Adjustment Scale Self-Report differentiates between work roles and assesses the actual number of days lost, affective performance, and interpersonal relations; and the Social Adaptation Self-Evaluation Scale emphasizes interest and motivation for work.
The original purpose for which the scales were designed is well represented in their content. The Short-Form Health Survey was designed to determine outcomes of psychiatric and medical conditions in a medical setting. It is the most widely used of the three scales, and it is the only one of the three that includes measures of physical functioning and physical activities (lifting, climbing, bending, etc.). It also includes assessment of depressive symptoms. There is an effort to separate work limitation due to physical as compared to emotional problems. Work role (e.g., homemaker, student) and actual time lost from work are not differentiated. Two questions deal with social activities with friends and family. Marital and parental roles and perception of economic functioning are not assessed.
The Social Adjustment Scale Self-Report was originally developed as an assessment tool for a clinical trial with drugs and psychotherapy for depressed patients in their child-rearing years. This background is reflected in the item content, in which instrumental and affective functioning in the extended family, with the spouse or partner, and with children are assessed separately. Work roles are differentiated so that a person who does not work for pay is also assessed on work. However, it is the longest of the three scales and, like the Social Adaptation Self-Evaluation Scale, does not assess physical functioning or general health status.
The Social Adaptation Self-Evaluation Scale is the newest of the scales and was designed for testing the efficacy of a new selective noradrenaline reuptake inhibitor, which is hypothesized to have an additional effect on drive and motivation, as compared to an SSRI. Like the Short-Form Health Survey, the Social Adaptation Self-Evaluation Scale does not include work role or actual time lost from work and does not differentiate family roles.
These findings provide general guidelines for instrument selection. For studies that include elderly subjects or that are being conducted in a primary care setting, researchers may find the Short-Form Health Survey’s coverage of physical, as well as mental, functioning useful. Also, the Short-Form Health Survey is now so widely used that it has become a standard, enabling comparison between studies. The Social Adjustment Scale Self-Report covers instrumental role performance and different family roles, which may be useful in economic projections. The Social Adjustment Scale Self-Report may be appropriate for investigations of effects on marital and parental functioning, which may include homemakers and students, for whom a different concept of work role functioning may apply, or may require estimates of actual days lost from work. Studies including noradrenergic drugs with specific hypothesis about target of action might use the Social Adaptation Self-Evaluation Scale (16).
The limitations of this study include the modest sample size. Although the sample was representative of primary care clinic patients, it was not representative of the U.S. population. Finally, we did not report data on the ability of these scales to differentially predict treatment effectiveness or clinical course.
A recent NIMH workgroup on translating behavioral science into action concluded that impaired functioning cuts across the range of mental illness and creates substantial economic burden (10). The workgroup noted a need for new standardized assessments, so that health care costs can be accurately estimated. They called for an integration of basic behavioral science theory and methods in the development of scales. Until this is achieved, our data suggest that investigators selecting a functional status scale should carefully review the content of available scales. If functional status is a critical outcome measure, more than one scale should be included in the study.
 |
 |
 |
Received April 25, 2000; revision received Aug. 22, 2000; accepted Sept. 6, 2000. From the Division of Clinical and Genetic Epidemiology, New York State Psychiatric Institute; the College of Physicians and Surgeons of Columbia University, New York; and the Department of Psychology, Montclair State University, Upper Montclair, N.J. Address reprint requests to Dr. Weissman, New York State Psychiatric Institute, 1051 Riverside Dr., Unit 24, New York, NY 10032; [email protected] (e-mail). Supported by investigator-initiated grants from Eli Lilly & Co. and Pharmacia-Upjohn. Dr. Weissman developed the Social Adjustment Scale Self-Report and receives royalties from its sale. The authors thank Dr. Carlos Blanco and Dr. Raz Gross for their comments.

Figure 1. Questions Assessing Work Functioning From Three Scales Measuring Social Functioning
1. Broadhead WE, Blazer DG, George LK, Tse CK: Depression, disability days, and days lost from work in a prospective epidemiologic survey. JAMA 1990; 264:2524–2528Google Scholar
2. Greenberg PE, Stiglin LE, Finkelstein SN, Berndt ER: The economic burden of depression in 1990. J Clin Psychiatry 1993; 54:405–418Medline, Google Scholar
3. Wells KB, Stewart A, Hays RD, Burnam MA, Rogers W, Daniels M, Berry S, Greenfield S, Ware J: The functioning and well-being of depressed patients: results from the Medical Outcomes Study. JAMA 1989; 262:914–919Crossref, Medline, Google Scholar
4. Murray CJL, Lopez AD (eds): The Global Burden of Disease: A Comprehensive Assessment of Mortality and Disability From Diseases, Injuries, and Risk Factors in 1990 and Projected. Geneva, World Health Organization, 1996Google Scholar
5. Miller IW, Keitner GI, Schatzberg AF, Klein DN, Thase ME, Rush AJ, Markowitz JC, Schlager DS, Kornstein SG, Davis SM, Harrison WM, Keller MB: The treatment of chronic depression, part 3: psychosocial functioning before and after treatment with sertraline or imipramine. J Clin Psychiatry 1998; 59:608–619Crossref, Medline, Google Scholar
6. Mintz J, Mintz LI, Arruda MJ, Hwang SS: Treatments of depression and the functional capacity to work. Arch Gen Psychiatry 1992; 49:761–768Crossref, Medline, Google Scholar
7. Kocsis JH, Zisook S, Davidson J, Shelton R, Yonkers K, Hellerstein DJ, Rosenbaum J, Halbreich U: Double-blind comparison of sertraline, imipramine, and placebo in the treatment of dysthymia: psychosocial outcomes. Am J Psychiatry 1997; 154:390–395Link, Google Scholar
8. ICIDH: International Classification of Impairments, Disabilities, and Handicaps: A Manual Relating to Classification of Consequences of Disease. Geneva, World Health Organization, 1980Google Scholar
9. ICIDH-2: Beta-1 Draft for Field Trials: International Classification of Impairments, Activities, and Participation: A Manual of Dimensions of Functioning and Disablement. Geneva, World Health Organization, 1997Google Scholar
10. National Institute of Mental Health: Translating Behavioral Science Into Action: Report of the National Advisory Mental Health Council Behavioral Science Workgroup: NIH Publication 00-4699. Rockville, Md, NIMH, 2000Google Scholar
11. Leon AC, Olfson M, Portera L, Farber L, Sheehan DV: Assessing psychiatric impairment in primary care with the Sheehan Disability Scale. Int J Psychiatry Med 1997; 27:93–105Crossref, Medline, Google Scholar
12. Bosc M: Assessment of social functioning in depression. Compr Psychiatry 2000; 41:63–69Crossref, Medline, Google Scholar
13. Bosc M, Dubini A, Polin V: Development and validation of a social functioning scale, the Social Adaptation Self-Evaluation Scale. Eur Neuropsychopharmacol 1997; 7(suppl 1):S57–S70Google Scholar
14. Ware JE Jr, Sherbourne CD: The MOS 36-Item Short-Form Health Survey (SF-36), I: conceptual framework and item selection. Med Care 1992; 30:473–483Crossref, Medline, Google Scholar
15. Weissman MM, Bothwell S: Assessment of social adjustment by patient self-report. Arch Gen Psychiatry 1976; 33:1111–1115Google Scholar
16. Healy D, Healy H: The clinical pharmacologic profile of reboxetine: does it involve the putative neurobiological substrates of wellbeing? J Affect Disord 1998; 51:313–322Google Scholar
17. Dubini A, Bosc M, Polin V: Noradrenaline-selective versus serotonin-selective antidepressant therapy: differential effects on social functioning. J Psychopharmacol 1997; 11(4 suppl):S17–S23Google Scholar
18. Olfson M, Shea S, Feder A, Fuentes M, Nomura Y, Gameroff MJ, Weissman MM: Prevalence of anxiety, depression, and substance use disorders in an urban general medicine practice. Arch Fam Med 2000; 9:876–883Crossref, Medline, Google Scholar
19. World Health Organization: Composite International Diagnostic Interview (CIDI), version 2.1 Geneva, WHO, 1997Google Scholar
20. Ware JE, Snow KK, Kosinski M, Gandek B: SF-36 Health Survey Manual and Interpretation Guide. Boston, Health Institute, New England Medical Center, 1993Google Scholar
21. Ware JE, Kosinski M, Keller SD: SF-36 Physical and Mental Health Summary Scales: A User’s Manual. Boston, Health Assessment Laboratory, 1994Google Scholar
22. Weissman MM, Prusoff BA, Thompson WD, Harding PS, Myers JK: Social adjustment by self-report in a community sample and in psychiatric outpatients. J Nerv Ment Dis 1978; 166:317–326Crossref, Medline, Google Scholar
23. Dubini A, Bosc M, Polin V: Do noradrenaline and serotonin differentially affect social motivation and behaviour? Eur Neuropsychopharmacol 1997; 7(suppl 1):S49–S55Google Scholar
24. Beckman HT, Lueger RJ: Readability of self-report clinical outcome measures. J Clin Psychol 1997; 53:785–789Crossref, Medline, Google Scholar