Attenuated Frontal Activation During a Verbal Fluency Task in Patients With Schizophrenia
Abstract
OBJECTIVE: Functional magnetic resonance imaging was used to study changes in cerebral blood oxygenation in schizophrenic patients during a verbal fluency task. METHOD: Five right-handed male schizophrenic patients and five volunteers matched on demographic variables and verbal fluency performance participated in the study. Echoplanar images were acquired over 5 minutes at 1.5 T while the subjects performed two tasks. The first involved paced silent generation of words beginning with an aurally presented cue letter. This task alternated with paced silent repetition of the aurally presented word “rest.” Generic brain activation maps were constructed from individual images by sinusoidal regression and nonparametric hypothesis testing. Between-group differences in the mean power of experimental response were identified on a voxelwise basis by an analysis of covariance that controlled for between-group differences in stimulus-correlated motion. RESULTS: The comparison group showed significant responses in the left prefrontal cortex, the insula bilaterally, the midline supplementary motor area, and the medial parietal cortex. Compared to those subjects, the schizophrenic subjects showed significantly reduced power of response in the left dorsal prefrontal cortex, the inferior frontal gyrus, and the insula but significantly increased power of response in the medial parietal cortex. In both groups frontal and parietal responses were negatively correlated. CONCLUSIONS: Schizophrenic patients displayed attenuated power of response in several frontal regions during word generation but greater power of response in the medial parietal cortex during word repetition. (Am J Psychiatry 1998; 155:1056–1063)
Verbal fluency involves the generation of words from letter cues. Deficits in verbal fluency performance are associated with frontal lobe lesions (1–3), although functional imaging studies suggest that the task engages a distributed network of cortical areas (4–6). The task can be presented in a variety of forms—auditory or visual, paced or unpaced, overt or covert, and with random or constrained output. Task performance depends on multiple cognitive processes, including sensory processing of the cue, retrieval of words from memory, the selection of a word appropriate for the cue, and covert or overt articulation of the word.
Despite variability in study design, the results from verbal fluency experiments carried out with use of positron emission tomography (PET) have been reasonably consistent (4–6). In normal subjects, cued generation of words compared to word repetition or rest has repeatedly been associated with changes in regional cerebral blood flow (CBF) in the left prefrontal cortex and left or bilateral superior temporal gyri (7). Some studies have also found that the pattern of blood flow change over time is negatively correlated between frontal and temporal regions; i.e., regional CBF is increased frontally during word generation but increased in the temporal cortex during word repetition (6). However, others have found positively correlated frontal and temporal blood flow changes, with both regions showing increased regional CBF during word generation (7). These differences in frontotemporal correlation or “functional connectivity” may reflect differences between studies in the details of experimental design; in particular, negative correlations between frontal and temporal regional CBF changes have been most consistently observed under conditions of overt vocalization.
PET has also been used to investigate CBF changes during verbal fluency tasks in patients with schizophrenia. A series of studies in acutely ill, drug-free (8), and chronically ill patients with distinct symptom profiles (9) has suggested that schizophrenic patients demonstrate abnormally correlated regional CBF changes in frontal and temporal regions in comparison with control subjects. Specifically, when scanned under identical conditions, schizophrenic subjects have demonstrated small, positive frontotemporal correlations in regional CBF, compared to relatively large, negative correlations in control subjects. These findings have contributed to the notion that frontotemporal dysconnectivity (or “sejunction,” to use Wernicke's term [10]) may be a central pathophysiological feature of schizophrenia (11, 12).
It is interesting that these studies have not found differences between control subjects and schizophrenic subjects in the magnitude of frontal blood flow change during verbal fluency tasks. This is in contrast to long-standing observations of attenuated frontal (hypofrontal) blood flow response in patients with schizophrenia when they are performing other tasks, such as the Wisconsin Card Sorting Test, that reliably induce large regional CBF changes in the dorsolateral prefrontal regions of control subjects (13). Although these two forms of abnormality (frontotemporal dysconnectivity and hypofrontality) have previously been reported separately, they need not be mutually exclusive. Indeed, if experimental variance in the frontal cortex is normally determined in large part by an effective or causal connection from the temporal cortex (14), then it is easy to see that hypofrontality and frontotemporal dysconnectivity might coexist.
The development of echoplanar (functional) magnetic resonance imaging (MRI) provides a relatively new method for studying the neural correlates of verbal fluency. Increased activity in a brain region induces a local increase in blood flow that exceeds the metabolic demand for oxygen, increasing the ratio of oxyhemoglobin to deoxyhemoglobin and thereby increasing the apparent transverse relaxation time (T2*)-weighted magnetic resonance signal. This biophysical phenomenon (blood-oxygen-level-dependent contrast [15]) provides an indirect measure of neural activation that can be used to investigate cognitive processing. Although functional MRI has the advantages that it does not entail exposure to radioactivity and provides a theoretically greater spatial and temporal resolution than is possible with use of PET, it does have the limitation of being exquisitely sensitive to subjects' motion, both biological motion (e.g., cardiorespiratory pulsation) and head movement in response to task demands.
To our knowledge, there has only been one previous functional MRI study of paced verbal fluency in schizophrenia (16). That study used a region of interest analysis to demonstrate decreased magnitude of left prefrontal blood flow and increased magnitude of left temporal cortical blood flow in a schizophrenic group. In common with that study, our experimental design was chosen to resemble that of previous PET studies (17), except that it involved a covert rather than an overt articulatory response. A covert design was selected because overt speech is often associated with relatively large head movements that could confound functional MRI time series analysis. In addition, covert or subvocal designs may have particular relevance to schizophrenia, since some psychotic phenomena, such as auditory hallucinations, may be derived from the patient's own inner (as opposed to overt) speech (18). Because previous studies have suggested that the presence of thought disorder and negative symptoms (particularly alogia) may influence verbal fluency performance of persons with schizophrenia (19), we chose to recruit relatively high-functioning schizophrenic patients in clinical remission who had few symptoms at the time of scanning.
On the basis of the existing literature, we sought to test two hypotheses: 1) that patients with schizophrenia would demonstrate abnormally correlated (connected) responses between frontal and temporal regions and 2) that patients with schizophrenia would demonstrate reduced magnitude of prefrontal activation during word generation.
METHOD
Five male patients with schizophrenia (DSM-IV criteria) and five male volunteers were recruited from the patients and staff at the Maudsley and Bethlem Royal Hospitals, London. All subjects were right-handed according to the Annett scale (20). The mean age of the comparison subjects was 31.6 years (SD=3.4), and that of the schizophrenic subjects was 29.6 years (SD=9.1). There was no significant difference between the groups in terms of age (t=0.4, df=8, p=0.70).
On the day of scanning, before the scan, each subject was assessed by the same rater (V.A.C.) using a standardized diagnostic interview schedule (Schedule for Affective Disorders and Schizophrenia—Lifetime Version [21]) and measures of psychopathology (Scale for the Assessment of Positive Symptoms [SAPS] [22] and Scale for the Assessment of Negative Symptoms [SANS] [23]) and verbal IQ (combined score on the National Adult Reading Test/Schonnell [24]). The patients had been unwell for a mean of 10.8 years (SD=3.6), during which time they had all been hospitalized on at least one occasion and had experienced positive symptoms. At the time of the study, the patients had low scores on standard symptom measures (SAPS mean score=20.8, SD=7.8; SANS mean score=23.2, SD=11.3) and were receiving stable doses of atypical antipsychotic medication. The mean IQ of the comparison subjects was 120.0 (SD=3.4), and that of the schizophrenic subjects was 116.8 (SD=6.8), a nonsignificant difference (t=1.4, df=8, p=0.20).
At the same assessment, all subjects performed the FAS test (25) of verbal fluency (three 30-second epochs of unpaced word generation in response to a cue letter). There was no significant difference between the two groups in their ability to generate words: comparison group mean=38 words (SD=7); schizophrenic group mean=40 words (SD=8) (t=0.4, df=8, p=0.70).
Since training affects the neural correlates of cognitive tasks (26, 27), the experimental procedure was explained in a standardized way. A written instruction sheet was provided on the day of scanning, and the same instructions were repeated verbally three times (during the assessment, before the subject went into the scanner, and just before the task began). All subjects clearly understood the task requirements. Permission was obtained from the ethics committee of the Bethlem and Maudsley National Health Service Trust. After complete description of the study to the subjects, written informed consent was obtained.
We used a periodic design involving presentation of a baseline condition for 30 seconds followed by an activation condition for 30 seconds. This cycle was repeated five times over the course of 5 minutes. During the activation condition, subjects were cued by auditory presentation of a letter (e.g., “F”) every 3 seconds to generate a word beginning with that letter and to internally (subvocally) articulate the word. During the baseline condition, subjects were cued by auditory presentation of the word “rest” every 3 seconds to internally articulate that word. At the end of the acquisition period, subjects were questioned about their ability to perform the task. All members of both groups reported that they were able to perform the task in the scanner without difficulty.
Image Acquisition and Motion Estimation and Correction
Functional MRI data were acquired at the Maudsley Hospital, London, on a GE Signa 1.5-T system (General Electric, Milwaukee) with an ANMR operating console (Advanced Nuclear Magnetic Resonance, Woburn, Mass.) for gradient echo echoplanar imaging. One hundred T2*-weighted images depicting blood-oxygen-level-dependent contrast (15) were acquired at each of 14 noncontiguous near axial planes (7 mm thick with 0.7-mm slice skip; in-plane resolution=3 mm) parallel to the anterior commissure-posterior commissure (AC-PC) line (TE=40 msec, TR=3 seconds, number of signal averages=1). To facilitate later registration of individual functional MRI data sets in standard space, a T1-weighted echo echoplanar imaging data set was acquired during the same session at 43 contiguous near axial planes (3 mm thick with 0.3-mm slice skip; in-plane resolution=1.5 mm) parallel to the AC-PC line (TE=80 msec, TI=180 msec, TR=16 seconds, number of signal averages=8). The AC-PC line was anatomically identified on scout images in the sagittal plane before echo echoplanar imaging data acquisition.
Rigid body motion in three spatial dimensions during functional MRI data acquisition was estimated by a multidimensional search with use of the Fletcher-Davidon-Powell algorithm, and images were realigned by tricubic spline interpolation (28–30). The time series at each voxel of the realigned images was then regressed on the time series of concomitant and lagged positional displacements in three dimensions (31). We did not need to discard any data because of evident motion artifact in the residuals of this regression. However, this second stage of movement correction will attenuate the periodic power in a functional MRI time series if the subject's head moves periodically at the frequency of baseline condition-activation condition alternation during data acquisition. In other words, correction of stimulus-correlated motion entails a risk of reduced power to detect activation.
Image Analysis
Periodic change in signal intensity at the angular frequency of the periodic baseline condition-activation condition input function (2π/60 radians per second in these data) was estimated by pseudogeneralized least squares fit of a sinusoidal regression model to the movement-corrected time series observed at each voxel. Pseudogeneralized least squares fitting involved modeling the residuals of an ordinary least squares fit of the sinusoidal regression model by a first-order autoregressive process (32, 33), transforming the terms of the regression model by the estimated first-order autoregressive coefficient, and refitting the transformed model by ordinary least squares. The model included sine and cosine waves at the fundamental baseline condition-activation condition frequency of the experimental input function, parameterized by coefficients γ and δ. The power of periodic response to the input function was estimated by (γ2+δ2), and this fundamental power divided by its standard error yielded a standardized test statistic, the fundamental power quotient (FPQ), at each voxel (34). Parametric maps representing FPQ observed at each intracerebral voxel were constructed. In order to sample the distribution of FPQ under the null hypothesis that observed values of FPQ were not determined by the experimental design (with few theoretical assumptions), the 99 images observed in each anatomical plane were randomly permuted, and FPQ was estimated exactly as above in each permuted time series. This process was repeated 10 times, resulting in 10 randomization parametric maps of FPQ at each plane for each subject. (See reference 35 for a general introduction to randomization tests, and references 36 and 37 for applications to PET data analysis.)
Observed and randomization FPQ maps were transformed into the standard space of Talairach and Tournoux (38) and smoothed by a two-dimensional Gaussian filter (full width at half maximum=7 mm). The median observed FPQ at each intracerebral voxel in standard space was then tested against a critical value of the randomization distribution for median FPQ ascertained from the randomization FPQ maps. For a one-tailed test of size α, the critical value is the 100*(1–α)th percentile value of the randomization distribution. Voxels for which the observed median FPQ exceeded this critical value were considered to be activated with a voxelwise probability of type I error equal to α.
The sign γ indicates the timing of signal increase relative to the input function (37). If γ is greater than 0, then the modeled response to the experimental function will be relatively increased during the first (baseline) condition; whereas if γ is less than 0, the modeled response will be relatively increased during the second (activation) condition. In the context of this experiment, therefore, negative values of median γ indicated generically increased signal intensity during word generation, and positive values of median γ indicated generically increased signal intensity during word repetition.
Activated voxels with signal maximum during word generation were colored red; activated voxels with signal maximum during word repetition were colored yellow. Activated voxels were displayed against the gray scale background of the template image used for spatial normalization to form a generic brain activation map (30).
To estimate the difference between the comparison and schizophrenic groups in mean FPQ, we fitted the following analysis of covariance (ANCOVA) model at each intracerebral voxel in standard space:
FPQi,j=β0+β1Gj+β2ΔFPQi,j+ei,j,
where FPQi,j is the observed FPQ at the ith voxel in the jth subject, G is a factor coding group membership for each subject (Gj=1 for comparison subjects and Gj=–1 for schizophrenic subjects), and ei,j is an error term. The covariate δFPQi,j is the difference in FPQ estimated at each voxel before and after movement-correcting regression (see above). In other words, δFPQi,j will be large and negative at a voxel where correction for stimulus-correlated motion has substantially attenuated the standardized power at the frequency of the input function. The purpose of including this covariate in the model is to control for between-group differences in the extent of stimulus-correlated motion when one is estimating between-group differences in mean FPQ. The null hypothesis of no between-group difference in mean FPQ was tested by comparing the coefficient β1 to critical values of its nonparametrically ascertained null distribution. To do this, the elements of G were randomly permuted 10 times at each voxel, β1 was estimated at each voxel after each permutation, and these estimates were pooled over all intracerebral voxels in standard space to sample the randomization distribution of β1. Critical values for a two-tailed test of size α were the 100*(α/2)th and 100*(1–α/2)th percentile values of this distribution (39, 40)
RESULTS
Generic Brain Activation Mapping
For the comparison group, median FPQ was tested against the null hypothesis at 22,927 voxels, with the probability of type I error for each test at α=0.0002. For a test of this size, we expect no more than five false positive voxels over the search volume under the null hypothesis. In total, 1,034 voxels were activated. For the schizophrenic group, median FPQ was tested against the null hypothesis at 21,976 voxels, with the probability of type I error for each test also at α=0.0002. For a test of this size, we expect no more than five false positive voxels over the search volume under the null hypothesis. In total, 253 voxels were activated.
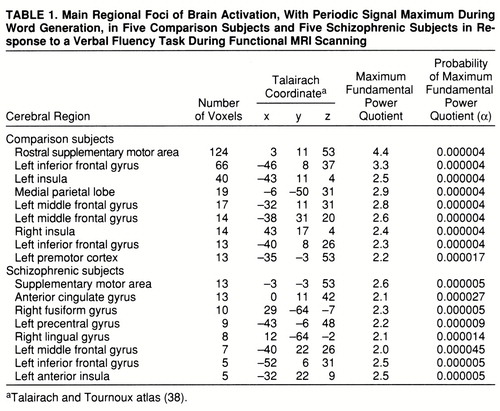
Both groups demonstrated significant power of periodic response, with maximum signal intensity during word generation in the supplementary motor area, the left inferior frontal gyrus, the middle frontal gyrus, and the left insula. The comparison group also showed responses in the right insula and left premotor cortex, while the schizophrenic group showed additional responses in the left precentral gyrus and right fusiform and lingual gyri (table 1 and figure 1, row A).
Both groups demonstrated significant power of periodic response with maximum signal intensity during word repetition in the medial parietal cortex and rostral portions of the anterior cingulate gyrus. The comparison group showed additional responses in the caudal supplementary motor area (table 2 and figure 1, row B).
Between-Group Differences in Power of Periodic Response
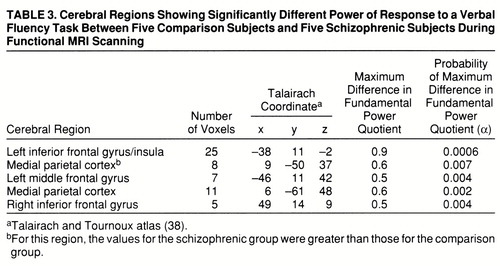
A qualitative comparison of the power of response in the two groups would suggest that the comparison group demonstrated more extensive activations, especially in the frontal cortex, than the schizophrenic group. However, this does not allow us to measure voxelwise differences in power of response between groups. A more formal test of the null hypothesis of no between-group difference in mean FPQ was provided by an ANCOVA at each voxel (see equation), which controlled for the possible confounding effect of a between-group difference in stimulus-correlated motion. This null hypothesis was tested at the 1,082 voxels that were significantly activated in one or both of the generic brain activation maps, with probability of type I error for each test at α=0.01. For a test of this size, we expect no more than 11 false positive voxels over the search volume under the null hypothesis. In total, 147 voxels demonstrated a significant difference in mean FPQ. Most of these were located in frontal regions (left middle and inferior frontal gyri, left insula, and right inferior frontal gyrus) and demonstrated significantly greater power of response in the comparison subjects than in the schizophrenic subjects (table 3 and figure 1, row C). These regions were characterized by maximum signal intensity during word generation in both groups. Another cluster of voxels, located in the medial posterior parietal cortex, demonstrated significantly greater power of response in the schizophrenic subjects than in the comparison subjects and was characterized by maximum signal intensity during word repetition in both groups. The schizophrenic group therefore showed an alteration of the power of regional response (relative “hypofrontality” and “hyperparietality”) without showing the differences in phase of response that would suggest differences in functional connectivity between frontal and parietal cortexes (figure 2).
DISCUSSION
This study examined the functional neuroanatomy of verbal fluency in a group of patients with long-standing and stable schizophrenia who were compared with a group matched for age, handedness, IQ, and ability to perform the FAS test of verbal fluency. To the best of our knowledge, this is the first functional MRI study of verbal fluency in schizophrenia to explore the temporal characteristics of cortical responses to a periodic design and to use linear modeling techniques to assess between-group differences at the single-voxel level.
Although there are many methodological differences (in task presentation, image acquisition, and data analysis) between PET and functional MRI (41), this study was designed to closely resemble previous PET work. An overt articulation design, as used in PET, would have allowed for on-line monitoring, but the likely consequent increase in movement during articulation would have increased the risk of a confounding effect on functional MRI time series analysis, particularly since psychiatric patients may not always move in the same way or to the same extent as comparison subjects. In particular, there may be systematic differences between patient and comparison groups in movements that coincide with the experimental stimulus, such as (overtly or covertly) vocalizing a response. We were able to reduce the impact of such stimulus-correlated motion—which would otherwise have exaggerated the between-group difference in frontal response—by use of ANCOVA (40).
The results enabled us to address our two original hypotheses. We are unable to confirm or refute previous PET findings of exaggerated temporal lobe activation in schizophrenia, since our subjects showed little evidence of either temporal lobe activations or altered phase of response. The left temporal lobe is known to be activated by tasks that entail analysis of external speech (42–44), as well as during verbal self-monitoring and auditory verbal imagery (45), and so may be involved in the internal perception of speech. However, neuronal activity in the temporal cortex is reduced in both humans and primates when the subjects vocalize (17, 27). This suppression of temporal activity during overt speech is thought to be effected by inputs from the frontal areas that generate speech and so may serve to inform regions concerned with speech perception that the acoustic signals are of self-origin (46). A possible explanation for the lack of this temporal suppression in our experiment is the requirement for a covert articulatory response, so that subjects are not required to process the sound of their own overt speech.
We did find evidence of an attenuated frontal response in the schizophrenic group, although unlike previous studies using the Wisconsin Card Sorting Test (12), this was not limited to the dorsolateral portion of the prefrontal cortex. Debate about the role of frontal lobe blood flow dates back to the first functional neuroimaging study of patients with schizophrenia (47). Since then a large number of studies have investigated this finding with the use of differing experimental conditions and methods and have broadly found that hypofrontality is most consistently seen in response to “executive” tasks, which patients tend to perform poorly (for a review, see reference 48). Frith (49) has suggested that such hypofrontality may be explained by this poor performance alone, but nonpsychotic elderly volunteers, who also show impaired performance on the Wisconsin Card Sorting Test, have been shown to have frontal regional CBF changes of the same magnitude as control subjects (50). In the present study, since there was no on-line monitoring of task performance, we cannot directly exclude the possibility that between-group differences in response were affected by differences in task performance. However, subjects' ability to perform the task before scanning did not differ significantly between groups, nor did comparison subjects and schizophrenic subjects report the use of different strategies to execute the task.
Another potential confounding factor is that all patients (and no comparison subjects) were taking antipsychotic medication, which could be responsible for a global attenuation of CBF. However, the atypical antipsychotics (which our patients were receiving) appear to have a minimal effect on frontal blood flow (51), and there was an exaggerated medial parietal response during the word repetition task in the patient group.
The schizophrenic patients and the comparison subjects displayed similar reciprocal phase relationships between activity in the prefrontal and medial parietal cortexes. These regions are anatomically interconnected (52, 53), and the medial parietal cortex has been implicated in visuospatial processing, memory-related imagery, and attention (54–56). Animal studies of working memory have implicated a cortical circuit involving the dorsolateral prefrontal cortex and parietal, temporal, and thalamic regions in working memory, and it is possible that disruption of this circuit could give rise to the executive function failures that are seen in schizophrenia (57, 58). Tasks involving the generation of inner speech have been associated with medial parietal “deactivation” (59, 60), implying a reduction of neural activity in regions specialized for functions that are of little relevance to linguistic task performance.
In summary, while this study did not demonstrate evidence of altered frontotemporal relationships in schizophrenia, it provided new evidence of attenuated frontal activation during performance of a verbal fluency task.
 |
 |
 |
Presented at the Third International Conference on Functional Mapping of the Human Brain, Copenhagen, May 20–23, 1997. Received June 5, 1997; revision received Nov. 12, 1997; accepted Feb. 26, 1998. From the Department of Psychological Medicine, Institute of Psychiatry. Address reprint requests to Dr. Curtis, Department of Psychological Medicine, Institute of Psychiatry, De Crespigny Park, London, SE5 8AF, United Kingdom; [email protected] (e-mail). Supported by a Margaret Temple Fellowship, British Medical Association (Dr. Curtis), and the Wellcome Trust (Dr. Bullmore and Dr. Wright). The authors thank Chris Andrew and the neuroimaging staff at the Maudsley Hospital for technical support.

FIGURE 1. Generic Brain Activation Maps for Functional MRI Data of a Comparison Group and a Schizophrenic Group and a Map of Significant Between-Group Differences in Power of Periodic Response During a Verbal Fluency Taska
aTalairach z coordinates (38) are shown at the top of each column. The left side of each map represents the right side of the brain. (A) Generic brain activation map for comparison subjects. Red voxels are activated with maximum signal during word generation, and yellow voxels are activated with maximum signal during word repetition. Voxelwise probability of type I error=0.0002. (B) Generic brain activation map for schizophrenic subjects. Red voxels are activated with maximum signal during word generation, and yellow voxels are activated with maximum signal during word repetition. Voxelwise probability of type I error=0.0002. (C) ANCOVA map showing areas of significant between-group differences. Yellow voxels have greater power of response in comparison subjects; red voxels have greater power of response in schizophrenic subjects. Voxelwise probability of type I error=0.01.

FIGURE 2. Regional Mean Fitted Time Series for Voxels in the Left Inferior Frontal Gyrus and Medial Posterior Parietal Cortex in Response of Comparison Subjects and Schizophrenic Subjects During a Verbal Fluency Taska
aSolid lines represent the comparison group's response, dotted lines represent the schizophrenic group's response, and dashed lines represent the periodic baseline condition-activation condition input function.
1 Milner B: Some aspects of the frontal lobe in man, in The Frontal Granular Cortex and Behavior. Edited by Warren JM, Akert K. New York, McGraw-Hill, 1964, pp 313–331Google Scholar
2 Benton AL: Differential behavioural effects in frontal lobe disease. Neuropsychologia 1968; 6:53–60Crossref, Google Scholar
3 McCarthy RA, Warrington EJ: Auditory word comprehension, in Cognitive Neuropsychology—A Clinical Introduction. Edited by McCarthy RA, Warrington EJ. San Diego, Calif, Academic Press, 1990, pp 122–151Google Scholar
4 Peterson SE, Fox PT, Posner MI, Minton M, Raichle ME: Positron emission tomographic studies of the cortical anatomy of single word processing. Nature 1988; 331:585–589Crossref, Medline, Google Scholar
5 Wise R, Chollet F, Hadar U, Friston K, Hoffner E, Frackowiak RSJ: Distribution of cortical networks involved in word comprehension and retrieval. Brain 1991; 114:1803–1817Crossref, Medline, Google Scholar
6 Frith CD, Friston KJ, Liddle PF, Frackowiak RSJ: A PET study of word finding. Neuropsychologia 1991; 29:137–148Crossref, Google Scholar
7 Warburton E, Wise RJS, Price CJ, Weller C, Hadar U, Ramsay S, Frackowiak RSJ: Noun and verb retrieval by normal subjects: studies with PET. Brain 1996; 229:159–179Crossref, Google Scholar
8 Grasby PM, Fletcher P, Frith CD, Liddle PF, Frackowiak RSJ, Dolan RJ: Anterior cingulate rCBF responses in volunteers and schizophrenic patients (abstract). Schizophr Res 1994; 11:70Google Scholar
9 Frith CD, Friston KJ, Herold S, Silbersweig D, Fletcher P, Cahill C, Dolan RJ, Frackowiak RSJ, Liddle PF: Regional brain activity in chronic schizophrenic patients during the performance of a verbal fluency task. Br J Psychiatry 1995; 167:343–349Crossref, Medline, Google Scholar
10 Wernicke C: Grundriss der Psychiatrie in klinschen Vorslungen. Leipzig, Verlag von Georg Thieme, 1894Google Scholar
11 McGuire PK, Frith CD: Disordered functional connectivity in schizophrenia. Psychol Med 1996; 26:663–667Crossref, Medline, Google Scholar
12 Bullmore ET, Frangou S, Murray RM: The dysplastic net hypothesis: an integration of developmental and dysconnectivity theories of schizophrenia. Schizophr Res 1997; 28:143–156Crossref, Medline, Google Scholar
13 Weinberger DR, Berman KF: Prefrontal function in schizophrenia: confounds and controversies. Philos Trans R Soc Lond 1996; 351:1495–1503Crossref, Medline, Google Scholar
14 Bullmore ET, Horwitz B, Curtis VA, Morris RGT, McGuire PK, Sharma TS, Williams SCR, Murray RM, Brammer MJ: A neurocognitive network for reading, semantic decision and inner speech: path analysis of fMRI data in normal and schizophrenic subjects (abstract). Proceedings of the Society for Neuroscience 1997; 23:2227Google Scholar
15 Ogawa S, Lee T, Kay A, Tank D: Brain magnetic resonance imaging with contrast dependent on blood oxygenation. Proc Natl Acad Sci USA 1990; 87:9868–9872Crossref, Medline, Google Scholar
16 Yurgelun-Todd DA, Waternaux CM, Cohen BM, Gruber SA, English CD, Renshaw PF: Functional magnetic resonance imaging of schizophrenic patients and comparison subjects during word production. Am J Psychiatry 1996; 153:200–205Link, Google Scholar
17 Fletcher PC, Frith CD, Grasby PM, Friston KJ, Dolan RJ: Local and distributed effects of apomorphine on fronto-temporal function in acute unmedicated schizophrenics. J Neurosci 1996; 16:7055–7062Crossref, Medline, Google Scholar
18 McGuire PK, Silbersweig DA, Wright I, Murray RM, David AS, Frackowiak RSJ, Frith CD: Abnormal perception of inner speech: a physiological basis for auditory hallucinations. Lancet 1995; 346:596–600Crossref, Medline, Google Scholar
19 Allen HA, Liddle PF, Frith CD: Negative features, retrieval processes and verbal fluency in schizophrenia. Br J Psychiatry 1993; 163:769–775Crossref, Medline, Google Scholar
20 Annett MA: A classification of hand preference by association analysis. Br J Psychiatry 1970; 61:303–321Google Scholar
21 Spitzer RL, Endicott J: Schedule for Affective Disorders and Schizophrenia—Lifetime Version, 3rd ed. New York, New York State Psychiatric Institute, Biometrics Research, 1979Google Scholar
22 Andreasen NC: Scale for the Assessment of Positive Symptoms (SAPS). Iowa City, University of Iowa, 1983Google Scholar
23 Andreasen NC: Scale for the Assessment of Negative Symptoms (SANS). Iowa City, University of Iowa, 1981Google Scholar
24 Nelson HE: National Adult Reading Test (NART): Test Manual. Windsor, England, National Foundation for Educational Research, 1992Google Scholar
25 Spring O, Benton AL: Neurosensory Centre for Comprehensive Examination of Aphasia (NCCEA), revised ed. Victoria, BC, Canada, University of Victoria, Neuropsychological Laboratory, 1977Google Scholar
26 Raichle ME, Fiez JA, Videen KTO, Macleod AM, Pardo JV, Fox PT: Practice related changes in human functional brain activity during non motor learning. Cereb Cortex 1994; 4:8–26Crossref, Medline, Google Scholar
27 Jenkins IH, Brooks DJ, Nixon PD, Frackowiak RSJ, Passingham R: Motor sequence learning: a study with positron emission tomography. J Neurosci 1994; 14:3775–3790Crossref, Medline, Google Scholar
28 Lange N: Some computational and statistical tools for paired comparisons of digital images. Stat Methods Med Res 1994; 3:23–41Crossref, Medline, Google Scholar
29 Press WH, Teukolsky SA, Vetterling WT, Flannery BP: Numerical Recipes in C: The Art of Scientific Computing. Cambridge, England, Cambridge University Press, 1992Google Scholar
30 Brammer MJ, Bullmore ET, Simmons A, Williams SCR, Grasby PM, Howard RJ, Woodruff PWR, Rabe-Hesketh S: Generic brain activation mapping in fMRI: a nonparametric approach. Magn Reson Imaging 1997; 15:763–770Crossref, Medline, Google Scholar
31 Friston KJ, Williams SCR, Howard RJ, Frackowiak RSJ, Turner R: Movement-related effects in fMRI time series. Magn Reson Med 1996; 35:346–355Crossref, Medline, Google Scholar
32 Jones RH: Longitudinal Data With Serial Correlations: A State-Space Approach. New York, Chapman & Hall, 1993Google Scholar
33 Bloomfield P: Time series methods, in Statistical Theory and Modelling: In Honour of Sir David Cox FRS. Edited by Hinkley DV, Reid N, Snell EJ. London, Chapman & Hall, 1991, pp 152–176Google Scholar
34 Bullmore ET, Brammer MJ, Williams SCR, Rabe-Hesketh S, Janot N, David AS, Mellers JDC, Howard R, Sham P: Statistical methods of estimation and inference for functional MR image analysis. Magn Reson Med 1996; 35:261–277Crossref, Medline, Google Scholar
35 Edgington ES: Randomization Tests. New York, Marcel Dekker, 1980Google Scholar
36 Arndt S, Cizadlo T, Andreasen NC, Heckel D, Gold S, O'Leary DS: Tests for comparing images based on randomization and permutation methods. J Cereb Blood Flow 1996; 16:1271–1279Crossref, Medline, Google Scholar
37 Holmes AP, Blair RC, Watson JDG, Ford I: Nonparametric analysis of statistic images from functional mapping experiments. J Cereb Blood Flow Metab 1996; 16:7–22Crossref, Medline, Google Scholar
38 Talairach J, Tournoux P: Co-Planar Stereotaxic Atlas of the Human Brain. New York, Thieme Medical, 1988Google Scholar
39 Bullmore ET, Rabe-Hesketh S, Morris RG, Williams SCR, Gregory L, Gray JA, Brammer MJ: Functional magnetic resonance image analysis of a large scale neurocognitive network. NeuroImage 1996; 4:16–33Crossref, Medline, Google Scholar
40 Bullmore ET, Brammer MJ, Rabe-Hesketh S, Curtis VA, Morris RG, Williams SCR, Sharma T, Murray RM, McGuire PK: Methods for diagnosis and treatment of stimulus correlated motion in generic brain activation studies using fMRI. Human Brain Mapping (in press)Google Scholar
41 Cohen MS, Bookheimer SY: Localization of brain function using magnetic resonance imaging. Trends Neurosci 1994; 17:268–277Crossref, Medline, Google Scholar
42 Demmonet JF, Chollet F, Ramsay S, Cardebat D, Nespoulous JL, Wise R, Rascol A, Frackowiak RSJ: The anatomy of phonological and semantic processing in normal subjects. Brain 1992; 115:1753–1768Crossref, Medline, Google Scholar
43 Zatorre RJ, Halpern AR: Effect of unilateral temporal lobe excision on perception and imagery of songs. Science 1993; 256:846–849Crossref, Google Scholar
44 Price C, Wise R, Ramsay S, Friston K, Howard D, Patterson K: Regional response differences within the human auditory cortex when listening to words. Neurosci Lett 1992; 146:179–182Crossref, Medline, Google Scholar
45 Frith CD, Done DJ: Towards a neuropsychology of schizophrenia. Br J Psychiatry 1987; 153:437–443Crossref, Google Scholar
46 Muller-Press P, Ploog D: Inhibition of auditory cortical neurons during phonation. Brain Res 1981; 215:61–76Crossref, Medline, Google Scholar
47 Ingvar DH, Franzen G: Abnormalities of cerebral blood flow distribution in patients with chronic schizophrenia. Acta Psychiatr Scand 1974; 50:425–462Crossref, Medline, Google Scholar
48 Chua SE, McKenna PJ: Schizophrenia—a brain disease? a critical review of structural and functional cerebral abnormality in the disorder. Br J Psychiatry 1995; 166:562–582Crossref, Google Scholar
49 Frith CD: The role of the prefrontal cortex in self-consciousness: the case of auditory hallucinations. Philos Trans R Soc Lond 1996; 351:1505–1512Crossref, Medline, Google Scholar
50 Esposito G, Kirkby BS, Van Horn JD, Weinberger DR, Berman KF: Different pathophysiological mechanisms of altered Wisconsin card sort performance in schizophrenics and elderly subjects. Abstracts of the Society for Neuroscience 1995; 21:747Google Scholar
51 Molina Rodr¡guez V, Montz Andrée R, Pérez Castej¢n MJ, Capdevila Garc¡a E, Carreras Delgado JL, Rubila Vila FJ: SPECT study of regional cerebral perfusion in neuroleptic-resistant schizophrenic patients who responded or did not respond to clozapine. Am J Psychiatry 1996; 153:1343–1346Link, Google Scholar
52 Petrides M, Pandya DN: Projections to the frontal cortex from the posterior parietal region in the rhesus monkey. J Comp Neurol 1984; 228:105–116Crossref, Medline, Google Scholar
53 McGuire PK, Bates JF, Goldman-Rakic PS: Interhemispheric integration, I: symmetry and convergence of the subcortical connections of the left and right principal sulcus and the left and right supplementary motor area in the rhesus monkey. Cereb Cortex 1991; 1:390–407Crossref, Medline, Google Scholar
54 Cavada C, Goldman-Rakic PS: Posterior parietal cortex in rhesus monkey, I: parcellation of areas based on distinctive limbic and sensory cortico-cortical connections. J Comp Neurol 1989; 287:393–422Crossref, Medline, Google Scholar
55 Fletcher PC, Frith CD, Baker SC, Shallice T, Frackowiak RSJ, Dolan RJ: The mind's-eye activation of the precuneus in memory related imagery. NeuroImage 1995; 2:196–200Crossref, Google Scholar
56 Dolan RJ, Fink GR, Rolls E, Booth M, Holmes A, Frackowlak RSJ, Friston KJ: How the brain learns to see objects and faces in an impoverished context. Nature 1997; 389:596–599Crossref, Medline, Google Scholar
57 Goldman-Rakic PS: Topography of cognition. Annu Rev Neurosci 1988; 11:137–156Crossref, Medline, Google Scholar
58 Corbetta M, Mezin FM, Shulman GL, Peterson SE: A PET study of visuospatial attention. J Neurosci 1993; 13:1202–1226Crossref, Medline, Google Scholar
59 Goldman Rakic PS: Working memory dysfunction in schizophrenia. J Neuropsychiatry Clin Neurosci 1994; 6:348–357Crossref, Medline, Google Scholar
60 Andreasen NC: Linking mind and brain in the study of mental illnesses: a project for a scientific psychopathology. Science 1997; 275:1586–1593Crossref, Medline, Google Scholar