Auditory Hallucinations and the Temporal Cortical Response to Speech in Schizophrenia: A Functional Magnetic Resonance Imaging Study
Abstract
OBJECTIVE: The authors explored whether abnormal functional lateralization of temporal cortical language areas in schizophrenia was associated with a predisposition to auditory hallucinations and whether the auditory hallucinatory state would reduce the temporal cortical response to external speech. METHOD: Functional magnetic resonance imaging was used to measure the blood-oxygenation-level-dependent signal induced by auditory perception of speech in three groups of male subjects: eight schizophrenic patients with a history of auditory hallucinations (trait-positive), none of whom was currently hallucinating; seven schizophrenic patients without such a history (trait-negative); and eight healthy volunteers. Seven schizophrenic patients were also examined while they were actually experiencing severe auditory verbal hallucinations and again after their hallucinations had diminished. RESULTS: Voxel-by-voxel comparison of the median power of subjects' responses to periodic external speech revealed that this measure was reduced in the left superior temporal gyrus but increased in the right middle temporal gyrus in the combined schizophrenic groups relative to the healthy comparison group. Comparison of the trait-positive and trait-negative patients revealed no clear difference in the power of temporal cortical activation. Comparison of patients when experiencing severe hallucinations and when hallucinations were mild revealed reduced responsivity of the temporal cortex, especially the right middle temporal gyrus, to external speech during the former state. CONCLUSIONS: These results suggest that schizophrenia is associated with a reduced left and increased right temporal cortical response to auditory perception of speech, with little distinction between patients who differ in their vulnerability to hallucinations. The auditory hallucinatory state is associated with reduced activity in temporal cortical regions that overlap with those that normally process external speech, possibly because of competition for common neurophysiological resources. (Am J Psychiatry 1997; 154:1676–1682)
Most structural imaging studies in schizophrenia emphasize left-sided temporal lobe abnormalities in addition to more diffuse brain abnormalities (1–3). The association between reduced left temporal lobe volume and hallucinations (4, 5) and theories linking temporal lobe asymmetry with the illness (6) have rekindled interest in abnormal asymmetry of temporal lobe structures in schizophrenia. One such region is the planum temporale, part of the superior temporal gyrus, which is usually larger on the left and which has a critical role in supporting language functions in humans (7). Evidence both for and against reduction of left planum temporale size (and hence reduced asymmetry) in schizophrenia has been presented (8, 9). One possible explanation for this inconsistency is that a left-sided decrease in the volume of temporal lobe language areas is confined to schizophrenic patients who have a strong predisposition to auditory hallucinations. This decrease could account for a number of alterations in functional asymmetry in hallucination-prone schizophrenic individuals, such as reduced right ear (left hemisphere) advantage on dichotic listening tasks (10) and reduced left temporal cortical activation when listening to single words (11) or when monitoring inner speech.
Auditory hallucinations are a core feature of schizophrenia (12). Neuroimaging studies using positron emission tomography (13–16) and single photon emission tomography (17, 18) indicate that auditory association and language cortexes are active in schizophrenic patients with auditory hallucinations. However, only a minority of these studies (16–18) have examined brain activity during the hallucinations. Moreover, most studies have limited their measurements to predefined regions, often within a single brain slice, rather than examining activity across the whole temporal cortex. Silbersweig et al. (16), while avoiding this problem, found that temporal cortical activity coincident with hallucinations in individual scans did not reach accepted levels of significance on averaged group images. This, the authors argued, may have been due to intersubject variation in the functional anatomy of the temporal cortex.
Functional magnetic resonance imaging (MRI) is sensitive to changes in cerebral blood oxygenation related to neural activity. The lack of a requirement for administration of radioactive isotopes makes functional MRI particularly suitable for studies of patients. We have previously used functional MRI to show that in a single schizophrenic patient, auditory hallucinations were associated with activation in the right middle temporal gyrus, one of the regions that normally responds to external speech (19). In the present study, we examined the functional anatomy of the cortical response to speech in schizophrenic subjects with a history of hallucinations, schizophrenic subjects without a history of hallucinations, and healthy comparison subjects. We predicted that the patients with a history of hallucinations would exhibit a less left-lateralized response to auditory perception of externally presented speech than both the healthy comparison subjects and the patients without a history of hallucinations. We also predicted that auditory hallucinations would specifically reduce the responsivity of the right temporal cortex to external speech. We tested this hypothesis by comparing severely hallucinating patients before and after improvement.
METHOD
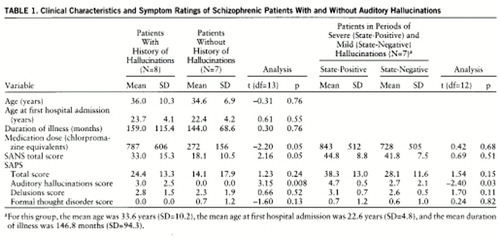
Functional MRI data on eight right-handed (20) male schizophrenic patients (DSM-III-R diagnosis) who had a history of auditory hallucinations but were not actively hallucinating (trait-positive) were compared with eight healthy male subjects recruited from the Institute of Psychiatry (mean age=35.3 years, SD=6.3) and seven male schizophrenic patients (DSM-III-R diagnosis) who had never experienced auditory hallucinations (trait-negative, as defined by McGuire et al. [21]) (table 1). Clinical ratings of the patients were made with the Scale for the Assessment of Positive Symptoms (SAPS) (22) and the Scale for the Assessment of Negative Symptoms (SANS) (23); these were recorded on the day of scanning. The normal comparison subjects were not taking medications and had neither smoked nor taken alcohol on the morning before being scanned.
A further group of seven right-handed male schizophrenic subjects underwent functional MRI studies on two separate consecutive occasions: 1) during a period of severe ongoing auditory verbal hallucinations (hallucinatory-state-positive) and 2) after these had diminished (hallucinatory-state-negative) (table 1). Four patients were common to both the group that was studied during severe and less severe hallucinatory states and the trait-positive group. The mean time interval between the two scanning sessions was 80.3 days (SD=29.4, range=34–118). The severity of auditory hallucinations was assessed on the day of each scanning session. Subjective ratings of hallucination severity (0=no hallucinations; 10=worst ever experienced) were obtained for any hallucinations that occurred immediately before or during scanning.
After complete description of the study to the subjects, written informed consent was obtained.
Image Acquisition
At each of 10 noncontiguous 5-mm-thick oblique slices through fronto-temporo-occipital regions, 100 T2*-weighted echoplanar magnetic resonance images depicting blood-oxygenation-level-dependent contrast (TE=40 msec, TR=3,000 msec) were acquired with use of a 1.5-T GE Signa system (retrofitted with an advanced nuclear magnetic resonance operating console). In the same scanning session, 43 3-mm-thick inversion recovery echoplanar anatomic images were acquired parallel to the anterior-posterior commisure line (TE=80 msec, TI=180 msec, TR=16 seconds, in-plane resolution=3 mm, eight signal averages).
Each 5-minute experiment followed a repeating A-B design. Auditory stimulation consisted of an identical prerecorded continuous story presented binaurally through headphones for epochs of 39 seconds, alternating with 39 seconds of blank tape. Scanner noise was constant throughout the experiment. All subjects were instructed to keep their eyes open and lie still. Head movement was restricted by using padding and a strap across the forehead.
Image Analysis
Each individual data set was corrected for the effects of the subject's motion during image acquisition by means of a two-step procedure: realignment of the images by tricubic spline interpolation followed by regression of each realigned functional MRI time series on a second-order polynomial function of estimated positional displacements at that voxel over the course of the experiment (24). The power of periodic signal change at the fundamental frequency of alternation between the A and B conditions was estimated by fitting a sinusoidal regression model to the motion-corrected time series at each voxel of all images. The model comprised three pairs of sine and cosine waves at the fundamental frequency and the first two harmonic frequencies. One advantage of this model over some alternative techniques for estimating a periodic experimental effect in functional MRI time series, such as cross-correlation with the square wave or boxcar input function, is that it accommodates voxelwise variability in hemodynamic delay and waveform of response (25). The model is fitted by a pseudogeneralized least squares method (26, 27); that is, the model is initially fitted by ordinary least squares, a first-order autoregressive process is fitted to the ordinary least squares residual series, the estimated first-order autoregressive coefficient is used to transform the terms of the original model, and the transformed model is fitted by ordinary least squares. This iterative fitting procedure is necessary to ensure that the residuals ultimately satisfy criteria of independence and normality and that the estimates of model parameters and their standard errors are valid. At each voxel, the sum of squared amplitudes of the sine and cosine waves at the fundamental frequency yields an estimate of experimentally determined power in the time series, and this is divided by its standard error to yield an estimate of the fundamental power quotient. The fundamental power quotient is represented at each voxel by a parametric map. The observed time series are then randomly permuted 10 times, and the fundamental power quotient is estimated at each voxel after each permutation, exactly as described above. This results in 10 parametric maps of randomized fundamental power quotients at each anatomical plane of each individual data set (28).
To identify voxels that were activated “on average” within each group, the observed and randomized fundamental power quotient maps computed for each individual were registered in standard space (29) and identically smoothed with a Gaussian filter (full width at half maximum=7 mm) to accommodate individual variability in functional anatomy and error in registration. The registration process involved 1) finding the three-dimensional translations, rotations, and linear rescaling factors that minimized the difference in total gray scale intensity between each functional echoplanar image data set and the same individual's structural echoplanar image data set with the use of the Fletcher-Davidon-Powell multidimensional search algorithm (30); 2) registering each individual's structural echoplanar image data set with a histogram-matched template image in standard space by affine transformation; and 3) serially applying the transformation vectors defining steps 1 and 2 to each (observed or randomized) fundamental power quotient map. We then computed the observed median fundamental power quotient at each voxel where the images overlapped sufficiently and compared this with a randomization distribution of median fundamental power quotients ascertained from the randomized fundamental power quotient maps. Because we had previously permuted each time series 10 times to create the randomized fundamental power quotient maps, we were able to sample at least 200,000 estimates of the median fundamental power under the null hypothesis over a search volume of at least 20,000 voxels. We previously found that this size of randomization distribution is sufficient to ascertain stable critical values for significance tests with p values of 0.0001 or greater (31, 32). The null hypothesis of no generic response to the experimental design was refuted at a given voxel if the observed median fundamental power quotient exceeded the critical value of the randomization distribution corresponding to a one-tailed test with a p value of 0.0005. Such generically activated voxels were colored and overlaid on the gray scale intensity of the template image to form a generic brain activation map, and regions of activation were identified by reference to the brain atlas of Talairach and Tournoux (24, 29).
To identify voxels that demonstrated a significantly different power of periodic response between groups, the following procedures were adopted. The median fundamental power quotient observed at each voxel was estimated separately for each group (as above), and the observed between-group difference in median fundamental power quotient was computed and represented in a parametric map. Individual subjects were then randomly reassigned to one of two groups, and the between-group difference in median fundamental power quotient at each voxel was computed after each random reassignment. For the comparison of the hallucinatory-state-negative and -positive groups, individuals were reassigned in such a way that if the hallucinatory-state-positive image of a given individual was randomly assigned to one group, the hallucinatory-state-negative image of that individual was assigned to the other group. Random reassignment was repeated 10 times at each voxel, and differences in median fundamental power quotient after each random reassignment were pooled to sample the randomization distribution over the whole image. The observed between-group difference in median fundamental power quotient at the voxels that were generically activated within one or both of the groups was then compared to critical values of the randomization distribution corresponding to a two-tailed test with a p value of 0.005. Voxels at which the null hypothesis was refuted were colored and overlaid on the gray scale template image.
RESULTS
Trait-Dependent Response to Speech
All patients and comparison subjects in the trait-positive/trait-negative part of the study were Caucasian except for two Afro-Caribbean patients in the trait-negative group. The mean age, mean antipsychotic medication dosage, and mean clinical ratings of the trait-positive and trait-negative patient groups on the day of scanning are given in table 1. In addition to antipsychotic medication, three trait-positive patients were taking anticholinergics, one trait-positive and one trait-negative patient were taking a serotonergic antidepressant, one trait-positive patient was taking a tricyclic antidepressant, and another trait-positive patient was taking lithium.
Relative to the healthy comparison subjects, the schizophrenic patients (trait-positive and trait-negative groups combined) showed significantly less powerful and extensive activation of the left superior temporal gyrus (Brodmann's area 22) (p<0.005, N=26 voxels, randomization test) and the auditory association cortex (Brodmann's area 42) (p<0.005, N=3 voxels, randomization test) but more powerful and extensive response of the right middle temporal gyrus (Brodmann's area 21) (p<0.005, N=10 voxels, randomization test) (figure 1, top and second rows). The median power of response of the comparison subjects significantly exceeded that of the schizophrenic patients in the left superior temporal gyrus (Talairach coordinates [mm]: x=–52, y=–17, z=4; maximum between-group difference in maximum median fundamental power quotient=3.3) (p<0.005, randomization test) and in the left auditory association cortex (x=–61, y=–17, z=9; maximum between-group difference in maximum median fundamental power quotient=2.7) (p<0.005, randomization test). The median power of response of the schizophrenic patients exceeded that of the healthy comparison subjects in the right middle temporal gyrus (x=61, y=–8, z=–2; maximum between-group difference in maximum median fundamental power quotient=1.2) (p<0.005, randomization test).
There were minimal overall between-group differences in temporal cortical activations between the trait-positive and trait-negative groups. Six voxels bilaterally distributed in the temporal cortex demonstrated a more powerful response in the trait-positive than in the trait-negative patients; 11 voxels demonstrated a more powerful response in the trait-negative than in the trait-positive patients. The total number of differentially activated voxels (N=17) was not much greater than the number of false positives (N=4) expected for a test with a p value less than 0.005 and a search volume of 760 voxels.
State-Dependent Response to Speech
All patients in the state-positive/state-negative part of the study were Caucasian. Their mean age, mean antipsychotic medication dosage, and clinical ratings in the hallucinatory-state-positive and hallucinatory-state-negative conditions on the days of the two scanning sessions are given in table 1. The means of the two hallucination severity ratings (scale of 0–10) immediately before and during scanning in the two sessions (state-positive and state-negative) were 5.80 (SD=2.0) and 1.64 (SD=1.8), respectively (t=–4.10, df=12, p=0.001). Medication other than antipsychotics taken by the patients included anticholinergics (two state-positive subjects and one state-negative subject), serotonergic antidepressants (two state-positive subjects and one state-negative subject), lithium (one state-positive and state-negative subject), diazepam and sodium valproate (one state-positive subject), and ranitidine (one state-positive subject).
External speech activated the temporal cortex significantly more powerfully and extensively in the hallucinatory-state-negative condition than in the hallucinatory-state-positive condition (figure 1, third and fourth rows). The greatest between-group differences in response were in the right middle temporal gyrus (Brodmann's area 21; N=24 voxels) (Talaraich x=61, y=–6, z=4; maximum between-group difference in maximum median fundamental power quotient=1.2) (p<0.005, randomization test) and in the left superior temporal gyrus (Brodmann's area 22; N=20 voxels) (x=–58, y=–6, z=4; maximum between-group difference in maximum median fundamental power quotient=1.2) (p<0.005, randomization test). There were seven voxels (from a total of 66 voxels) in which the power of response in the state-negative patients exceeded that in the state-positive patients.
DISCUSSION
Our conclusions are confined to measurements of temporal cortical activations because of the limited spatial coverage.
The combined groups of schizophrenic patients with and without a history of hallucinations showed less left-sided auditory cortical response to speech than the healthy comparison subjects. This relative hyporesponsivity to speech is consistent with evidence that schizophrenic patients have smaller left-sided superior temporal gyrus volumes than healthy comparison subjects (33).
In addition, external speech activated more right temporal cortex volume in the schizophrenic patients than in the healthy comparison subjects. This could be interpreted as an intrinsic hyperresponsivity of the right temporal cortex, if it were performing linguistic processing to a greater extent than it did in the healthy comparison subjects. Alternatively, a compensatory increase in right temporal cortical activity could be due to dysfunction in the left. Both interpretations are consistent with theories of normal lateralized brain development (6) and hypotheses of early damage to left hemisphere structures in schizophrenia. In the context of the finding by Barta et al. (5) of significantly greater than normal right planum temporale area (but not volume) in schizophrenic patients, our results support the testable hypothesis that a right-sided shift in activation in this region in schizophrenia is related to underlying surface area rather than volume.
The functional implications of reversed laterality in schizophrenia have been hitherto largely unexplored. If, as has been proposed by Crow (6), this phenomenon has its origins in early brain development, it might be possible to detect abnormally lateralized auditory processes in children who will later develop schizophrenia.
No observable difference in either spatial extent or power of response between the trait-positive and trait-negative patients was found. In view of the presence of significant group differences in SANS scores and antipsychotic medication dosage, we cannot be certain that these factors did not obscure true group differences in temporal cortical activation.
Our results indicate that there is reduced response of the temporal cortex to external speech, particularly in the right middle temporal gyrus, during periods of increased auditory hallucinations. The intrasubject design overcomes many potential confounding factors that complicate functional neuroimaging research, such as intersubject variations in brain anatomy. The within-group comparison also enabled the detection of significant group differences in cortical response at lower maximum fundamental power quotient values than was possible for the intersubject comparisons.
The present findings are consistent with the hypothesis that auditory hallucinations “compete” with external speech for processing sites within the temporal cortex (19, 34, 35). This notion of competition is consistent with the use of listening to music or speech as a means of alleviating auditory hallucinations (12, 36). The narrative of a story may invoke more complex cognitive processes than those required to process the single words or simple sentences of auditory hallucinations. It is likely, therefore, that any competition between the two sets of stimuli for neurophysiological resources would be restricted to auditory cortex that subserves processing of the shared, simpler elements of speech.
Because we have not shown activity during auditory hallucinations, we cannot verify that this competition, if it exists, coincides exactly with the hallucinations themselves. Reduced auditory cortical response in the positive hallucinatory state might occur if hallucinations occurred only, or with greater frequency, during the nonauditory task intervals rather than during the listening intervals of the A-B design; however, no patients reported this when debriefed after scanning.
It is possible that the relative right-sided bias in modulation of the temporal cortex between the two hallucinatory states reflects the underlying functional anatomy of the schizophrenic patients who were also subjects in the trait-dependent part of the study. We can only infer that auditory hallucinations activate the right temporal cortex in these patients. However, this idea would be consistent with some studies (13) that have demonstrated a predominance of right-sided temporal lobe activation in schizophrenic patients with auditory hallucinations, although most studies report bilateral or left-sided activity (15–18). This might reflect a selection bias, since many studies (e.g., McGuire et al. [17]) restricted their analysis to the left side. Alternatively, it may be that hallucinatory activity competes with normal auditory processing only in regions responsible for processing both external speech and the hallucinatory experience.
Hallucinating schizophrenic patients are sometimes able to modulate the voices they hear by shifting attention to or away from them (12), and the greater the meaning of the stimuli (and attention to it), the more effective is the reduction in auditory hallucinations (36). Recent electrophysiological and neuroimaging evidence suggests that these attentional processes modulate activity at the auditory sensory cortical level (37, 38). Directing attention to an unexpected auditory stimulus leads to a greater temporal cortical response on the right than on the left (38–40). Thus, auditory hallucinations, which are usually unexpected, may modulate the response to speech more in the right temporal cortex than in the left. The right laterality of the effect might also be related to the emotional and prosodic qualities of auditory hallucinations, which are usually derogatory in content and tone (12)—features of speech associated with activity in the right temporal lobe (39). Future experiments that link sensory cortical activity to symptom-relieving attentional strategies could form the basis for assessing specific therapeutic interventions for hallucinations.
CONCLUSIONS
The normal response (left side greater than right) to external speech was reversed in schizophrenic patients (reduced on the left and increased on the right), but this effect did not distinguish those predisposed to auditory hallucinations from those not so predisposed. Periods of intense auditory hallucinations were associated with reduced power and spatial extent of temporal cortical response to external speech, particularly in the right middle temporal gyrus.
 |
Preliminary results presented at the Second International Conference on Functional Mapping of the Human Brain, Boston, June 17–21, 1996. Received Dec. 18, 1996; revision received Aug. 8, 1997; accepted Aug. 25, 1997. From the Departments of Psychological Medicine, Biostatistics and Computing, and Old Age Psychiatry, Institute of Psychiatry and King's College School of Medicine and Dentistry, London. Address reprint requests to Dr. Woodruff, Neuroscience and Psychiatry Unit, G801 Stopford Bldg., University of Manchester, Oxford Rd., Manchester M13 9PT, United Kingdom. Supported by Glaxo, British Telecom, and the Wellcome Trust. The authors thank Mr. C. Andrew, Dr. A. Simmons, Mr. M. Allin, and Miss C. Andrews for technical support and Dr. J. Mellers for comments and advice.

FIGURE 1. Brain Activation Mapsa
aEach row shows four axial slices through the auditory cortex from the middle temporal gyrus (left) to the posterior superior temporal gyrus (right); Talairach z coordinates in millimeters (inferior-superior) are shown below the bottom row. Each map is oriented with the right side of the brain represented on the left side of the map. Top row: Generic brain activation maps separately computed for eight healthy comparison subjects and 15 schizophrenic patients with a history of auditory hallucinations (trait-positive) and without (trait-negative) are superimposed. Blue indicates brain regions generically activated in both groups (339 voxels), yellow indicates brain regions generically activated within the comparison group only (349 voxels), and red indicates regions activated in the schizophrenic group only (430 v oxels). The comparison subjects activated the left temporal cortex more extensively than the schizo phrenic patients, whereas the patients activated the right temporal cortex more extensively than the comparison subjects. The voxelwise probability of false positive activation in each generic brain activation map was p<0.0005, uncorrected (expected number of false positive tests per map=10). Second row: Maps show brain regions that demonstrated a significant difference in median power of response between the comparison group and the schizophrenic patients (trait-positive and trait-negative). Yellow indicates brain regions more powerfully activated in the comparison group (mainly located in the left temporal cortex) (29 voxels); red indicates brain regions more powerfully activated in the schizophrenic group (located in the right temporal cortex) (14 voxels). The voxelwise probability of a false positive difference between groups was p<0.005, uncorrected (search volume=1,029 voxels; expected number of false positive tests per map=5). Third row: Generic brain activation maps separately computed for seven individuals with severe hallucinations (state-positive) and when hallucinations had diminished (state-negative) have been superimposed. Blue indicates brain regions generically activated at both times (109 voxels), yellow indicates brain regions activated only in the hallucinatory-state-positive group (122 voxels), and red indicates regions activated only in the hallucinatory-state-negative group (506 voxels). There was more extensive activation of the temporal cortex bilaterally in the state-negative group. The v oxelwise probability of false positive activation in each generic brain activation map was p<0.0005 , uncorrected (error pixels per image=10; expected number of false positive tests per map=10). Fourth row: Maps show brain regions that demonstrated a significant difference in median power of response between the state-positive and state-negative conditions. Yellow indicates brain regions more powerfully activated in the state-positive condition (seven voxels); red indicates brain regions more powerfully activated in the state-negative condition (59 voxels, mostly in the right temporal cortex). The voxelwise probability of a false positive difference was p<0.005, uncorrected (search volume=737 voxels; expected number of false positive tests per map=4).
1. Harvey I, Ron MA, DuBoulay G, Wicks D, Lewis SW, Murray RM: Reduction of cortical volume in schizophrenia on magnetic resonance imaging. Psychol Med 1993; 23:591–604Crossref, Medline, Google Scholar
2. Zipursky RB, Lim KO, Sullivan EV: Widespread cerebral grey matter volume in schizophrenia. Arch Gen Psychiatry 1992; 49:195–205Crossref, Medline, Google Scholar
3. Woodruff PWR: Structural magnetic resonance imaging in psychiatry, in Neurobiology and Psychiatry, vol 3: Neuroimaging. Edited by Kerwin R, Dawbarn D, McCulloch J, Tamminga CA. New York, Cambridge University Press, 1995, pp 1–24Google Scholar
4. Barta PE, Pearlson GD, Powers RE, Richards SS, Tune LE: Auditory hallucinations and smaller superior temporal gyrus volume in schizophrenia. Am J Psychiatry 1990; 147:1457–1462Google Scholar
5. Barta PE, Pearlson GD, Brill LB II, Royall R, McGilchrist IK, Pulver AE, Powers RE, Casanova MF, Tien AY, Frangou S, Petty RG: Planum temporale asymmetry reversal in schizophrenia: replication and relationship to gray matter abnormalities. Am J Psychiatry 1997; 154:661–667Link, Google Scholar
6. Crow TJ: Temporal lobe asymmetries as the key to the etiology of schizophrenia. Schizophr Bull 1990; 16:433–443Crossref, Medline, Google Scholar
7. Foundas AL, Leonard CM, Gilmore R, Fennell E, Heilman KM: Planum temporale asymmetry and language dominance. Neuropsychologia 1994; 32:1225–1231Google Scholar
8. Falkai P, Bogerts B, Schneider T, Greve B, Pfeiffer U, Pilz K, Gonsiorcyzk C, Majtenyi C, Ovary I: Disturbed planum temporale asymmetry in schizophrenia: a quantitative post-mortem study. Schizophr Res 1995; 14:161–176Crossref, Medline, Google Scholar
9. Kleinschmidt A, Falkai P, Huang Y, Schneider T, Furst G, Steinmetz H: In vivo morphometry of planum temporale asymmetry in first-episode schizophrenia. Schizophr Res 1994; 12:9–18Crossref, Medline, Google Scholar
10. Green MF, Hugdahl K, Mitchell S: Dichotic listening during auditory hallucinations in patients with schizophrenia. Am J Psychiatry 1994; 151:357–362Link, Google Scholar
11. O'Leary DS, Andreasen NC, Hurtig RR, Kesler ML, Rogers M, Arndt S, Cizadlo T, Watkins GL, Ponto LLB, Kirchner PT, Hichwa RD: Auditory attentional deficits in patients with schizophrenia: a positron emission tomography study. Arch Gen Psychiatry 1996; 53:633–641Crossref, Medline, Google Scholar
12. Nayani TH, David AS: The auditory hallucination: a phenomenological survey. Psychol Med 1996; 26:177–189Crossref, Medline, Google Scholar
13. Volkow ND, Wolf AP, Van Gelder P, Brodie JD, Overall JE, Cancro R, Gomez-Mont F: Phenomenological correlates of metabolic activity in 18 patients with chronic schizophrenia. Am J Psychiatry 1987; 144:151–158Link, Google Scholar
14. DeLisi LE, Buchsbaum MS, Holcomb HH, Langston KC, King AC, Kessler R, Pickar D, Carpenter WT Jr, Morihisa JM, Margolin R, Weinberger DR: Increased temporal lobe glucose use in chronic schizophrenic patients. Biol Psychiatry 1989; 25:835–851Crossref, Medline, Google Scholar
15. Cleghorn JM, Garnett ES, Nahmias C, Brown GM, Kaplan RD, Szechtman KH, Szechtman B, Franco S, Dermer SW, Cook P: Regional brain metabolism during auditory hallucinations in chronic schizophrenia. Br J Psychiatry 1990; 157:562–570Crossref, Medline, Google Scholar
16. Silbersweig DA, Stern E, Frith C, Cahill C, Holmes A, Grootoonk S, Seaward J, McKenna P, Chua SE, Schnorr L, Jones T, Frackowiak RSJ: A functional neuroanatomy of hallucinations in schizophrenia. Nature 1995; 378:176–179Crossref, Medline, Google Scholar
17. McGuire PK, Shah GMS, Murray RM: Increased blood flow in Broca's area during auditory hallucinations in schizophrenia. Lancet 1993; 342:703–706Crossref, Medline, Google Scholar
18. Suzuki M, Yuasa S, Minabe Y, Murata M, Kurachi M: Left superior temporal blood flow increases in schizophrenic and schizophreniform patients with auditory hallucination: a longitudinal case study using 123I-IMP SPECT. Eur Arch Psychiatry Clin Neurosci 1993; 242:257–261Crossref, Medline, Google Scholar
19. Woodruff PWR, Brammer M, Mellers J, Wright I, Bullmore ET, Williams S: Auditory hallucinations and perception of external speech (letter). Lancet 1995; 346:1035Crossref, Medline, Google Scholar
20. Annett M: A classification of hand preference by association analysis. Br J Psychol 1970; 61:303–321Crossref, Medline, Google Scholar
21. McGuire PK, Silbersweig DA, Wright I, Murray RM, Frackowiak RSJ, Frith CD: The neural correlates of inner speech and auditory imagery in schizophrenia: relationships to auditory hallucinations. Br J Psychiatry 1996; 169:148–159Crossref, Medline, Google Scholar
22. Andreasen NC: Scale for the Assessment of Positive Symptoms (SAPS). Iowa City, University of Iowa, 1984Google Scholar
23. Andreasen NC: Negative symptoms in schizophrenia: definition and reliability. Arch Gen Psychiatry 1982; 39:784–788Crossref, Medline, Google Scholar
24. Brammer MJ, Bullmore ET, Simmons A, Williams SCR, Grasby PM, Howard RJ, Woodruff PWR, Rabe-Hesketh S: Generic brain activation mapping in functional magnetic resonance imaging: a nonparametric approach. Magn Reson Imaging 1997; 15:763–770Crossref, Medline, Google Scholar
25. Rabe-Hesketh S, Bullmore ET, Brammer MJ: Analysis of functional magnetic resonance images. Stat Meth Med Res (in press)Google Scholar
26. Cochrane D, Orcutt GH: Application of least squares regression to relationships containing autocorrelated error terms. J Am Statistical Assoc 1949; 44:32–61Google Scholar
27. Bloomfield P: Time series methods, in Statistical Theory and Modelling: In Honour of Sir David Cox FRS. Edited by Hinkley DV, Reid N, Snell EJ. London, Chapman & Hall, 1991, pp 152–176Google Scholar
28. Bullmore E, Brammer M, Williams S, Rabe-Hesketh S, Janot N, David A, Mellers J, Howard R, Sham P: Statistical methods of estimation and inference for functional MR image analysis. Magn Reson Med 1996; 35:261–277Crossref, Medline, Google Scholar
29. Talairach J, Tournoux P: Co-Planar Stereotaxic Atlas of the Human Brain. New York, Thieme Medical, 1988Google Scholar
30. Press WH, Teukolsky SA, Vetterling WT, Flannery BP: Numerical Recipes in C: The Art of Scientific Computing. Cambridge, England, Cambridge University Press, 1992Google Scholar
31. Edgington ES: Randomization Tests. New York, Marcel Dekker, 1980Google Scholar
32. Manly BFJ: Randomisation and Monte Carlo Methods in Biology. London, Chapman & Hall, 1991Google Scholar
33. Pearlson GD, Barta PE, Powers RE, Menon RR, Richards SS, Aylward EH, Federman EB, Chase GA, Petty RG, Tien AY: Medial and superior temporal gyrus volumes and cerebral asymmetry in schizophrenia versus bipolar disorder. Biol Psychiatry 1997; 41:1–14Crossref, Medline, Google Scholar
34. Howard R, Williams S, Bullmore E, Brammer M, Mellers J, Woodruff P, David A: Cortical response to exogenous visual stimulation during visual hallucinations. Lancet 1995; 345:70Crossref, Medline, Google Scholar
35. David AS, Woodruff PWR, Howard R, Mellers JD, Brammer M, Bullmore E, Wright I, Andrew C, Williams SC: Auditory hallucinations inhibit exogenous activation of auditory association cortex. NeuroReport 1966; 7:932–936Crossref, Google Scholar
36. Gallagher AG, Dinan TG, Baker LJV: The effects of varying auditory input on schizophrenic hallucinations. Br J Med Psychol 1994; 67:67–75Crossref, Medline, Google Scholar
37. Woldorff MG, Gallen CC, Hampson SA, Hillyard SA, Pantex C, Sobel D, Bloom FE: Modulation of early sensory processing in human auditory cortex during auditory selective attention. Proc Natl Acad Sci USA 1993; 90:8722–8726Google Scholar
38. Woodruff PWR, Benson RR, Bandettini PA, Kwong KK, Howard RJ, Talavage T, Belliveau J, Rosen BR: Modulation of auditory and visual cortex by attention is modality-dependent. NeuroReport 1996; 12:1909–1913Google Scholar
39. McGuire PK, Silbersweig DA, Frith CD: Functional neuroanatomy of verbal self-monitoring. Brain 1996; 119:907–917Crossref, Medline, Google Scholar
40. Levanen S, Ahonen A, Hari R, McEvoy L, Sams M: Deviant auditory stimuli activate human left and right auditory cortex differently. Cereb Cortex 1996; 6:288–296Crossref, Medline, Google Scholar