Greater Loss of 5-HT2A Receptors in Midlife Than in Late Life
Abstract
OBJECTIVE: Earlier work has shown markedly lower density of serotonin 2A (5-HT2A) receptors in elderly subjects than in young healthy subjects. In this study the authors used positron emission tomography (PET) and [18F]altanserin, a ligand with high affinity for the 5-HT2A receptor, to examine the relationship between 5-HT2A receptor density and age in more detail. METHOD: The 22 subjects ranged in age from 21 to 69 years (mean=43.4, SD=13.3) and were healthy comparison subjects in a study of depression. Regions of interest were determined on magnetic resonance images and were transferred to coregistered PET data. The data were derived from dynamic PET scanning and arterial sampling with resulting plasma activity data corrected for labeled metabolites. Compartmental modeling was used to estimate the radioligand distribution volume. By comparing the distribution volume (DV) of different regions to the cerebellum distribution volume, DVratio–1, which is proportional to the binding potential, was calculated. RESULTS: The decrease in 5-HT2A binding was not linear but on average was approximately 17% per decade from age 20. The correlations between age and 5-HT2A DVratio–1 were significant for the global measure and for the medial gyrus rectus, anterior cingulate, posterior medial prefrontal cortex, hippocampus, and occipital cortex. Most of the falloff in receptor binding occurred up through midlife, and there was less decrease in late life. There were no decreases in regional brain volumes of corresponding magnitudes. CONCLUSIONS: 5-HT2A receptor binding decreases dramatically in a variety of brain regions up through midlife.
The serotonin (5-HT) neurotransmitter system is widely distributed in the central nervous system and is involved in modulating mood, appetite, sleep, sexual activity, aggression, and psychomotor activation. Studies of 5-HT2 binding density have shown age-related changes in rats (1) and in humans studied through postmortem examination (2, 3) and in vivo imaging studies (4–10). Studies using autoradiography have examined the effect of age on 5-HT2 receptors in human brain tissue postmortem, showing a marked decrease with age. All have shown decreased receptor levels, but they have pointed to different age relationships. Marcusson et al. (11) found the loss of 5-HT2 receptors to occur primarily after age 60, with an approximate 50% overall decrease by the 10th decade. In contrast, Gross-Isseroff et al. (3), using ketanserin binding, found a decrease in 5-HT2 receptors in prefrontal cortical homogenates that leveled off in later life.
Several in vivo studies originally identified a loss of 5-HT2A receptors with age (4–6). However, these studies were conducted with 11C-labeled 3-N-methylspiperone, a neuroleptic ligand that binds preferentially to both dopamine D2 and 5-HT receptors. Although the ratio of serotonin to dopamine receptors is high in the prefrontal cortex, and thus spiperone binding is thought to measure largely 5-HT receptors, the influence of D2 receptors on 5-HT2 binding in the prefrontal cortex is uncertain. Since these studies did not quantify D2 receptors separately from 5-HT receptors, it was difficult to know the specific relationship of age to 5-HT receptors. This led to later work that examined the effect of age on 5-HT2A binding with more selective 5-HT2 ligands. These studies using more selective ligands (7–10, 12) also showed age to be a significant covariate in imaging studies of 5-HT2A receptors. One study (8), however, examined only a single large prefrontal cortical region, another (9) examined a limited age range, with a mean age of only 32 years, and one (10) compared a younger group (mean age=23 years) to an elderly group (mean age=69 years) without the full age spectrum. Using a different ligand, 2-[123I]ketanserin, and single photon emission computed tomography, D’haenen et al. (12) also found age-related decreases in 5-HT2 uptake. In the current study we used [18F]altanserin to investigate the relationship between 5-HT2A receptor binding and age across a broad age range in a set of widely distributed brain regions. In addition, in some regions we made regional brain volumetric measurements in order to examine concomitant loss of brain volume.
Method
Subjects
This study was approved by the Washington University Human Subjects Committee. Twenty-two normal comparison subjects aged 21 to 69 years were recruited from the surrounding community. All were right-handed and screened to exclude acute physical illness or any acute or prior psychiatric disorder by review of systems, physical examination, medical records, laboratory testing, and structured interview. Written informed consent was obtained from all subjects. In addition, the Hamilton Depression Rating Scale was administered to exclude any subject with a current score of 8 or higher.
Imaging
A previously reported method (13) for synthesis of [18F]altanserin to image the 5-HT2A receptors was used. Synthesis of [18F]altanserin yielded batches up to 75 mCi with high radiochemical purity (>99%) and specific activity greater than 2000 mCi/mmol. Positron emission tomography (PET) images were obtained by using the Siemens 961HR PET scanner (Siemens/CTI, Knoxville, Tenn.). Head position was stabilized by use of a softened thermoplastic mold. The subject was placed such that the lowest imaging plane was approximately at the same level as and parallel to the canthomeatal line. A 10-minute transmission scan using rotating rods of 68Ge/68Ga was used.
PET imaging of 5-HT2A receptors was begun by using a 20-mCi intravenous injection of [18F]altanserin and initiating a 90-minute dynamic PET image collection (12 6-second images, eight 60-second images, and 16 300-second images). In addition, rapid hand-drawn 0.6-ml arterial blood samples were obtained and centrifuged to enable counting of plasma activity. Five additional 3-ml blood samples were obtained to allow determination of labeled metabolites. Metabolite corrections of the blood samples were performed by using thin-layer chromatography with methanol as the liquid phase.
Magnetic resonance imaging (MRI) studies were performed by using a standard protocol on a 1.5-T Sonata system (Siemens Medical Systems, Erlanger, Germany), as described elsewhere (14). Regions of interest were determined for the hippocampus, posterior medial prefrontal cortex, bilateral anterior medial gyrus rectus, anterior cingulate, occipital cortex, and cerebellum. The hippocampus was defined as described earlier (14). The posterior medial prefrontal cortex was defined on coronal slices ventrally as the cortex of the medial aspect of the gyrus rectus (also architectonic area 14) (15) that is continuous with the subgenual prefrontal cortex (also architectonic areas 24, 25, and 32m) (15). This region was defined as beginning anteriorly at the genu of the corpus callosum and extending to the third ventricle. The bilateral anterior medial gyrus rectus was defined on coronal slices; the left and right cortex of the medial aspect of the gyrus rectus began anteriorly at the frontal pole and extended to the genu of the corpus callosum. The anterior cingulate was defined as a representative portion of total cingulate cortex gray matter bounded superiorly by the roof of the lateral ventricles, inferiorly by the orbital cortex, posteriorly by the genu of the corpus callosum, and anteriorly by the posterior branch of the cingulate gyrus. For the occipital cortex, a 2×2×2-cm cube was positioned over the primary visual cortex at least 8 mm away from the cerebellum. The cerebellum was defined by a 4×4-cm-wide rectangle centered in the middle of the cerebellum and at least 8 mm from any cortical structure. Stereological techniques (14, 16) were used to determine volumes for the hippocampus, posterior medial prefrontal cortex, and medial gyrus rectus, which are anatomically discrete brain structures. Finally, a region of interest encompassing the whole brain (or global brain) was derived from all of the pixels on the MRI within the brain but excluding the cerebellum and brainstem.
PET image frames were coregistered to each other and then coregistered to the MR data set by using in-house software (17; Snyder, unpublished data). Data on the regions of interest were then extracted from the realigned high-resolution PET images.
Modeling
Values for the plasma metabolites were expressed as percentages of unchanged altanserin for each time, and the data were fitted to an exponential function. The resulting function was used to correct the plasma activity data to yield the unchanged [18F]altanserin activity curve.
A four-compartment kinetic analysis model was used to account for transport of the [18F]altanserin tracer into the brain, nonspecific binding to the brain tissue, and specific binding to the 5-HT2A receptor. The labeled metabolites of altanserin in the brain were modeled as well (23) (Figure 1) on the basis of evidence that one or more of the metabolites of [18F]altanserin can cross the blood-brain barrier. These metabolites show no binding to the 5-HT2A receptor (19–21).
While there is a small but finite number of 5-HT2A receptors in the cerebellum (22), the contribution from receptor binding is assumed to be negligible, and the cerebellum can be used to estimate the nonspecific binding. The cerebellum data were processed first, yielding estimates of the plasma volume, bidirectional transport rate constants, and nonspecific binding of [18F]altanserin and the metabolites (18). Thus, the cerebellum was modeled by using two single compartments simultaneously (labeled altanserin and labeled metabolites). This model fits the cerebellum very well (Figure 2). No receptor-bound component was needed in the cerebellum for adequate model fitting when metabolites were considered.
Next, assuming that the nonspecific binding of altanserin and the altanserin metabolites are relatively constant throughout the brain (13, 22), we held the ratios K1/k2 and K5/k6 fixed and analyzed the other individual regions, which resulted in estimates of K1, k3, and k4. The [18F]altanserin distribution volume (DV) is calculated by Equation 1:

The cerebellum distribution volume is used to correct for variations in nonspecific binding in plasma and is simply calculated as in Equation 2:

To express the number of receptors in the brain tissue, one uses DVratio–1, in which DVratio is calculated by Equation 3:

Note that with algebraic substitution of Equations 1 and 2 into Equation 3, DVratio–1 can also be calculated as in Equation 4:

in which k3 and k4 are derived from the model. Furthermore, the k3/k4 ratio is proportional to binding potential (24).
Statistical Analysis
Pearson correlations were calculated to determine the relationship between age and estimates of receptor binding, DVratio–1. Linear and quadratic relationships were fitted to the data. Visual inspection of the data suggested that a linear regression does not entirely explain the behavior of receptor binding changes over age. To explore this behavior we tested a quadratic relationship of age and receptor binding against a linear relationship. The statistical significance of the quadratic term was determined by t test. To further illustrate this potential nonlinear effect we divided the data at the midpoint of the age range (age 45) and plotted the two age groups separately. Then, using a method to compare slopes (see reference 25, pp. 292–295), we tested whether the slopes of receptor loss in the younger subjects were different from the slopes of the older subjects. The method for testing hypotheses about the equality of two population regression coefficients (slopes) involves the use of Student’s t test in a manner analogous to that for testing differences between two population means. It should be noted that these methods were used merely to characterize these apparent deviations from linearity but not to determine the exact relationship between age and receptor binding, which would require additional data and assumptions regarding the biological processes involved. In addition, the correlations between the brain structure volumes and age were determined by using Pearson coefficients.
Results
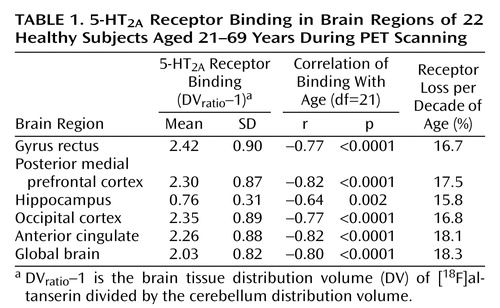
The subjects consisted of 16 women and six men. They ranged in age from 21 to 69 years (mean=43.4, SD=13.3). Among women only, the range was 25–69 (mean=46.3, SD=13.7), and among men the range was 21–44 (mean=35.7, SD=8.9). Values of DVratio–1 are displayed in Table 1. The distribution volume for the cerebellum was not correlated with age (r=0.33, df=21, p=0.14). The mean decrease in 5-HT2A binding per decade of age is shown in Table 1. For each brain region the coefficient for the correlation between binding potential and age is also displayed.
The proportion of variance accounted for (R2) was calculated for linear and quadratic fits of the 5-HT2A binding data with age (Figure 3). The relationship of receptor binding to age was significant with both the linear fit (r=0.80, df=21, p<0.0001) and the quadratic fit (r=0.89, df=21, p<0.0001) of the data. The addition of the quadratic term added significant information over the linear fit for the global data (linear R2=0.64, quadratic R2=0.79), occipital cortex (linear R2=0.59, quadratic R2=0.71), gyrus rectus (linear R2=0.59, quadratic R2=0.67), and posterior medial prefrontal cortex (linear R2=0.67, quadratic R2=0.85) but not for the anterior cingulate or hippocampus. Visually, this appears as a rapid fall in receptors during early adulthood and midlife followed by a leveling off of the decrease in 5-HT2A receptor binding with age (Figure 3). To test whether the additional quadratic term is significantly different from zero (i.e., the quadratic fit adds significant information over the linear fit) we performed a t test (see reference 25, p. 365). The quadratic term was significantly different from zero for the global data (t=3.83, df=19, p<0.001), occipital cortex (t=2.91, df=19, p<0.009), gyrus rectus (t=2.16, df=19, p<0.04), and posterior medial prefrontal cortex (t=4.68, df=19, p<0.001) but not the anterior cingulate (t=1.75, df=19, p=0.10) or hippocampus (t=1.16, df=19, p=0.26).
Figure 4 displays representative PET slices and the coregistered MRI scans for a 21-year-old subject and the same slices for a 68-year-old subject.
To illustrate the potential change in slopes over the life span more directly, the age-related decline in receptors was examined separately for young and old subjects. As shown in Figure 5, the decline in receptors was much greater for younger (age=20–45 years) than for older (age=46–70 years) subjects in the anterior cingulate (t=4.35, df=18, p<0.0001), gyrus rectus (t=4.33, df=18, p<0.0001), posterior medial prefrontal cortex (t=4.22, df=18, p<0.001), occipital cortex (t=3.65, df=18, p<0.002), hippocampus (t=4.31, df=18, p<0.001), and global brain (t=3.69, df=18, p<0.002).
To compare age-related receptor loss to age-related volume loss, the average percentage loss in volume per decade was calculated for each region. These losses were 8.9% for the gyrus rectus, 4.6% for the posterior medial prefrontal cortex, and 3.4% for the hippocampus. Some regions for which receptor data are given do not have corresponding volumetric data, since some regions (cerebellum, occipital cortex, and anterior cingulate cortex) were measured as cubic subvolumes rather than by meaningful anatomical boundaries (see Method section). PET methods do not currently allow complete correction of partial volume effect without assumptions regarding activity in the tissues surrounding the region of interest. Merely knowing the volume of a structure without detailed knowledge of the activity of surrounding tissue makes it difficult to determine partial volumes, although there have been various attempts at estimation (9, 26).
Discussion
In this study we found dramatic decreases in 5-HT2A receptors in normal healthy subjects across a broad range of ages and in widely distributed regions. The receptor loss was large—70% from the levels at age 20, progressive through the fifth decade and then leveling off. Our results extend previous findings that age was a significant covariate in imaging studies of 5-HT2A receptors. Our study fully modeled ligand behavior with full quantitative receptor kinetics, including metabolites, by using blood sampling. Unlike some investigators, we did not simplify receptor kinetics to tissue ratios or a Logan plot. The ligand we used, [18F]altanserin, binds specifically to the 5-HT2A receptor. We examined the relationship between 5-HT2A receptor binding in a variety of cortical and limbic regions. We looked across an age span of 21–69 years, although we had only two subjects under the age of 30 and few elderly subjects.
Like others (4–7, 9, 10, 12), we found receptor loss in widely scattered brain regions. In the posterior medial prefrontal cortex (areas 24, 25, and 32m), gray matter of the gyrus rectus (area 14), anterior cingulate, hippocampus, and occipital cortex the relationships between age and receptor density were similar. When a linear equation was used to fit the data, there was a slope of approximately 16%–18% per decade in these regions. Further analysis suggested that for most regions studied the loss of receptors is not a purely linear function. It appears to be greatest in midlife and to level off after age 50 years. A parabolic relationship with aging was first reported by Gross-Isseroff et al. (3), who used [3H]ketanserin specific binding to postmortem prefrontal cortex determined by autoradiography. They reported a progressive decrease in 5-HT2 receptors until age 60, followed by flattening out of the curve with no further loss in receptors (and actually a slight upswing after age 60). In comparing the fit of our data from a linear regression equation to the fit from a quadratic equation, the R2 value increased substantially for receptor binding in the whole brain and in the posterior medial prefrontal cortex, gyrus rectus, and occipital cortex but not in the hippocampus or anterior cingulate cortex. This suggests that in the former regions a nonlinear falloff of receptors is a better approximation, whereas in the latter regions the relationship appears to be more linear. It is unclear why the loss of receptors would occur more in midlife than late life.
The large changes in 5-HT2A receptor density were not associated with similar changes in brain volume. The literature on change in brain volume with age contains varied results based on a wide variety of study groups. Some studies have shown decreases in overall brain volume with age (27) or age-related atrophy in particular regions (28). In general, studies that have screened most carefully to exclude subjects with medical problems have shown the smallest decreases in brain volume (29).
We cannot examine quantitatively the relationship between receptor density and brain volumes in particular brain regions. The PET measure of radioactivity in the volume of interest receives an unknown contribution from all surrounding tissues because of the finite resolution of the scanner. However, it appears that the tissues we examined had a modest change in volume with age, much smaller than the corresponding receptor loss from age 20 to 70. While our data do not preclude neuronal dropout as an explanation for the decrease in 5-HT2A binding, they do imply that a general neuronal loss does not exist to a degree sufficient to explain the large decreases in 5-HT2A binding. Therefore, if the falloff in 5-HT2A receptor binding is due to neuronal loss, it would have to be a loss relatively specific to 5-HT2A cells.
The meaning of this age-related loss in 5-HT2A receptors is not clear. There is some evidence for decreased serotonergic function with age. In a comparison of prolactin responses to d,l-fenfluramine (a serotonin-releasing agent) in depressed and comparison subjects, Lerer et al. (30) found that the comparison subjects exhibited a significant age-by-challenge-by-time interaction. Peak minus baseline prolactin responses were negatively correlated with age in both women and men. In a group of subjects with major depression, Degl’Innocenti et al. (31) showed a correlation between prolactin response to d-fenfluramine and performance on four of five selected Wisconsin Card Sorting Test variables, which was also negatively correlated with age. These results further support a relationship between decreases in serotonergic activity and age. Since there appear to be losses in several neurotransmitter systems, including cholinergic systems as well as serotonergic and dopaminergic systems (32, 33), it is possible that functional deficits that occur in old age result from a combination of deficits in these systems. There also may be a large redundancy in these systems, such that loss of even a large number of receptors may not cause a detectable loss of function.
 |
Received July 28, 2000; revisions received March 5 and Aug. 17, 2001; accepted Aug. 29, 2001. From the Departments of Psychiatry and Radiology and the Mallinckrodt Institute of Radiology, Washington University School of Medicine. Address reprint requests to Dr. Sheline, Washington University School of Medicine, Campus Box 8134, 660 South Euclid Ave., St. Louis, MO 63110-1093; [email protected] (e-mail). Supported in part by NIMH grants MH-01370 and MH-58444 to Dr. Sheline, NIMH grant MH-54731 to Dr. Mintun, and grant RR-00036 from the NIH Division of Research Resources to the General Clinical Research Center at Washington University School of Medicine.

Figure 1. Compartmental Model Used to Estimate 5-HT2A Receptor Binding in Brain Regions During PET Scanninga
aDVratio–1 was used as the measure of receptor binding. It is the brain tissue distribution volume (DV) of [18F]altanserin divided by the cerebellum distribution volume. By using input functions comprising [18F]altanserin and its labeled metabolites, the rate constants were estimated by parameter estimation that fit the model-derived activity to the PET-measured activity for each region. As the cerebellum has minimal 5-HT2A receptors (see text for discussion), estimates of nonspecific binding for altanserin (K1/k2) and its labeled metabolites (K5/k6) are then fixed during analysis of other brain regions in the same subject.

Figure 2. Typical Model Fit of Binding of [18F]Altanserin and Metabolites to 5-HT2A Receptors in the Cerebellum of 22 Healthy Subjects During PET Scanning

Figure 3. Global Age-Related Decrease in 5-HT2A Receptor Binding in 22 Healthy Subjects During PET Scanning, According to Quadratic and Linear Formulasa
aDVratio–1 is the brain tissue distribution volume (DV) of [18F]altanserin divided by the cerebellum distribution volume.

Figure 4. 5-HT2A Receptor Binding Shown in PET Scans of 21-Year-Old and 68-Year-Old Subjectsa
aMRI and coregistered PET images were transformed to standard atlas space for the sake of illustration. The PET data consist of the summation of data collected between 60 and 90 minutes after injection of [18F]altanserin. The PET data were normalized for counts in the cerebellum, to scale the images to set equal activity levels in the nonreceptor region (cerebellum).

Figure 5. Decrease in 5-HT2A Receptor Binding in Brain Regions of Younger and Older Healthy Subjects During PET Scanninga
aDVratio–1 is the brain tissue distribution volume (DV) of [18F]altanserin divided by the cerebellum distribution volume.
bThe age range was divided in half to determine younger and older age groups.
1. Gozlan H, Daval G, Verge D, Spampinato U, Fattaccini CM, Gallissot C, El Mestikawy S, Hamon M: Aging associated changes in serotoninergic and dopaminergic pre- and postsynaptic neurochemical markers in the rat brain. Neurobiol Aging 1990; 11:437-449Crossref, Medline, Google Scholar
2. Arranz B, Eriksson A, Mellerup E, Plenge P, Marcusson J: Effect of aging in human cortical pre- and postsynaptic serotonin binding sites. Brain Res 1993; 620:163-166Crossref, Medline, Google Scholar
3. Gross-Isseroff R, Salama D, Israeli M, Biegon A: Autoradiographic analysis of age-dependent changes in serotonin 5-HT2A receptors of the human brain postmortem. Brain Res 1990; 519:223-227Crossref, Medline, Google Scholar
4. Wong D, Wagner H, Dannals R, Links J, Frost J, Ravert H, Wilson A, Rosenbaum A, Gjedde A, Douglass K: Effects of age on dopamine and serotonin receptors measured by positron emission tomography in living human brain. Science 1984; 226:1393-1396Crossref, Medline, Google Scholar
5. Iyo M, Yamasaki T: The detection of age-related decrease of dopamine D1, D2 and serotonin 5-HT2 receptors in living human brain. Prog Neuropsychopharmacol Biol Psychiatry 1993; 17:415-421Crossref, Medline, Google Scholar
6. Wang GJ, Volkow ND, Fowler JS, Ding Y-S, Logan J, Gatley SJ, MacGregor RR, Wolf AP: Comparison of two pet radioligands for imaging extrastriatal dopamine transporters in human brain. Life Sci 1995; 56:PL187-PL191Google Scholar
7. Baeken C, D’haenen H, Flamen P, Mertens J, Terriere D, Chavatte K, Boumon R, Bossuyt A: 123I-5-I-R91150, a new single-photon emission tomography ligand for 5-HT2A receptors: influence of age and gender in healthy subjects. Eur J Nucl Med 1998; 25:1617-1622Crossref, Medline, Google Scholar
8. Meyer JH, Kapur S, Houle S, DaSilva J, Owczarek B, Brown GM, Wilson AA, Kennedy SH: Prefrontal cortex 5-HT2 receptors in depression: an [18F]setoperone PET imaging study. Am J Psychiatry 1999; 156:1029-1034Abstract, Google Scholar
9. Rosier A, Dupont P, Peuskens J, Bormans G, Vandenberghe R, Maes M, de Groot T, Schiepers C, Verbruggen A, Mortelmans L: Visualisation of loss of 5-HT2A receptors with age in healthy volunteers using [18F]altanserin and positron emission tomographic imaging. Psychiatry Res Neuroimaging 1996; 68:11-22Crossref, Medline, Google Scholar
10. Meltzer CC, Smith G, Price JC, Reynolds CF III, Mathis CA, Greer P, Lopresti B, Mintun MA, Pollock BG, Ben-Eliezer D, Cantwell MN, Kaye W, DeKosky ST: Reduced binding of [18F]altanserin to serotonin type 2A receptors in aging: persistence of effect after partial volume correction. Brain Res 1998; 813:167-171Crossref, Medline, Google Scholar
11. Marcusson JO, Morgan DG, Winblad B, Finch CE: Serotonin-2 binding sites in human frontal cortex and hippocampus: selective loss of S-2A sites with age. Brain Res 1984; 311:51-56Crossref, Medline, Google Scholar
12. D’haenen H, Bossuyt A, Mertens J, Bossuyt-Piron C, Gijsemans M, Kaufman L: SPECT imaging of serotonin2 receptors in depression. Psychiatry Res Neuroimaging 1992; 45:227-237Crossref, Medline, Google Scholar
13. Lemaire C, Cantineau R, Guillaume M, Plenevaux A, Christiaens L: Fluorine-18-altanserin: a radioligand for the study of serotonin receptors with PET: radiolabeling and in vivo biologic behavior in rats. J Nucl Med 1991; 32:2266-2272Medline, Google Scholar
14. Sheline YI, Sanghavi M, Mintun MA, Gado MH: Depression duration but not age predicts hippocampal volume loss in women with recurrent depression. J Neurosci 1999; 19:5034-5043Crossref, Medline, Google Scholar
15. Carmichael S, Price J: Architectonic subdivisions of the orbital and medial prefrontal cortex in the macaque monkey. J Comp Neurol 1994; 346:366-402Crossref, Medline, Google Scholar
16. Gundersen HJG, Bendtsen TF, Korbo N: Some new, simple and efficient stereological methods and their use in pathological research and diagnosis. Acta Pathol Microbiol Scand 1988; 96:379-394Crossref, Google Scholar
17. Snyder AZ: Difference image versus ratio image error function forms in PET-PET realignment, in Quantification of Brain Function Using PET. Edited by Myer R, Cunningham VJ, Bailey DL, Jones T. San Diego, Academic Press, 1996, pp 131-137Google Scholar
18. Mintun MA, Price JP, Smith GS, Lopresti B, Hartman L, Simpson N, Mathis CA: Quantitative 5-HT2A receptor imaging in man using F-18 altanserin: a new model accounting for labeled metabolites (abstract). J Nucl Med 1996; 37:109PGoogle Scholar
19. Smith GS, Price JC, Lopresti BJ, Huang Y, Simpson N, Holt D, Mason NS, Meltzer CC, Sweet RA, Nichols T, Sashin D, Mathis CA: Test-retest variability of serotonin 5-HT2A receptor binding measured with positron emission tomography and [18F]altanserin in the human brain. Synapse 1998; 30:380-392Crossref, Medline, Google Scholar
20. Lopresti B, Holt D, Mason S, Huang Y, Ruszkiewicz J, Perevuznik J, Price J, Smith G, Mathis C: Characterization of the radiolabeled metabolites of [18F]altanserin: implications for kinetic modeling, in Quantitative Brain Imaging With Positron Emission Tomography. Edited by Carson R, Daube-Witherspoon M, Herscovitch P. San Diego, Academic Press, 1998, pp 293-298Google Scholar
21. Tan P, Baldwin R, Van Dyck C, Al-Tikriti M, Roth B, Khan N, Charney D, Innis R: Characterization of radioactive metabolites of 5-HT2A receptor PET ligand [18F]altanserin in human and rodent. Nucl Med Biol 1999; 26:601-608Crossref, Medline, Google Scholar
22. Pazos A, Probst A, Palacios JM: Serotonin receptors in the human brain, IV: autoradiographic mapping of serotonin-2 receptors. Neuroscience 1987; 21:123-139Crossref, Medline, Google Scholar
23. Biver F, Lotstra F, Monclus M, Dethy S, Damhaut P, Wikler D, Luxen A, Goldman S: In vivo binding of [18F]altanserin to rat brain 5HT2 receptors: a film and electronic autoradiographic study. Nucl Med Biol 1997; 24:357-360Crossref, Medline, Google Scholar
24. Mintun MA, Raichle ME, Kilbourn MR, Wooten GF, Welch MJ: A quantitative model for the in vivo assessment of drug binding sites with positron emission tomography. Ann Neurol 1984; 15:217-227Crossref, Medline, Google Scholar
25. Zar JH: Biostatistical Analysis, 2nd ed. Englewood Cliffs, NJ, Prentice-Hall, 1984Google Scholar
26. Rousset O, Ma Y, Evans AC: Correction for partial volume effects in PET: principle and validation. J Nucl Med 1998; 39:904-911Medline, Google Scholar
27. Murphy DGM, DeCarli C, McIntosh AR, Daly E, Mentis MJ, Pietrini P, Szxzepanik J, Schapiro MB, Grady CL, Horwitz B, Rapoport SI: Sex differences in human brain morphometry and metabolism: an in vivo quantitative magnetic resonance imaging and positron emission tomography study on the effect of aging. Arch Gen Psychiatry 1996; 53:585-594Crossref, Medline, Google Scholar
28. Raz N, Gunning FM, Head D, Dupuis JH, McQuain J, Briggs SD, Loken WJ, Thornton AE, Acker JD: Selective aging of the human cerebral cortex observed in vivo: differential vulnerability of the prefrontal gray matter. Cereb Cortex 1997; 7:268-282Crossref, Medline, Google Scholar
29. Mueller EA, Moore MM, Kerr DCR, Sexton G, Camicioli RM, Howieson DB, Quinn JF, Kaye JA: Brain volume preserved in healthy elderly through the eleventh decade. Neurology 1998; 51:1555-1562Crossref, Medline, Google Scholar
30. Lerer B, Gillon D, Lichtenberg P, Gorfine M, Gelfin Y, Shapira B: Interrelationship of age, depression, and central serotonergic function: evidence from fenfluramine challenge studies. Int Psychogeriatr 1996; 8:83-102Crossref, Medline, Google Scholar
31. Degl’Innocenti A, Agren H, Zachrisson O, Backman L: The influence of prolactin response to d-fenfluramine on executive functioning in major depression. Biol Psychiatry 1999; 46:512-517Crossref, Medline, Google Scholar
32. DeKosky ST, Palmer AM: Neurochemistry of aging, in Clinical Neurology of Aging, 2nd ed. Edited by Albert ML, Knoefel JE. New York, Oxford University Press, 1994, pp 79-101Google Scholar
33. Volkow ND, Gur RC, Wang G-J, Fowler JS, Moberg PJ, Ding Y-S, Hitzemann R, Smith G, Logan J: Association between decline in brain dopamine activity with age and cognitive and motor impairment in healthy individuals. Am J Psychiatry 1998; 155:344-349Link, Google Scholar