Lower Concentration of Hippocampal N-Acetylaspartate in Familial Bipolar I Disorder
Abstract
OBJECTIVE: Previous studies attempting to identify neuropathological alterations in the hippocampus in bipolar disorder have been inconclusive. The objective of this study was to determine if the concentration of N-acetylaspartate, a neuronal and axonal marker, was lower in subjects with familial bipolar I disorder than in healthy comparison subjects, suggesting possible neuronal loss, neuronal dysfunction, or neuropil reduction in bipolar I disorder. METHOD: N-acetylaspartate, choline, and creatine in the right and left hippocampus were measured in 15 euthymic male patients with familial bipolar I disorder and 20 healthy male comparison subjects by using proton magnetic resonance spectroscopy (1H-MRS). RESULTS: Relative to the comparison group, the patients with bipolar I disorder demonstrated significantly lower concentrations of N-acetylaspartate and creatine but normal choline concentration in both the right and left hippocampus. There were no group or lateralized differences in the percentages of different tissue types within the MRS voxels, suggesting that the hippocampal N-acetylaspartate and creatine alterations were not an artifact of variations in tissue types represented in the voxels. There was also a significant negative correlation between N-acetylaspartate concentration in the right hippocampus and illness duration, after adjustment for the effects of age. CONCLUSIONS: This preliminary study provides support for the existence of neuronal loss, neuronal metabolic dysfunction, or interneuronal neuropil reduction in the hippocampal region in male patients with familial bipolar I disorder. The finding of normal hippocampal choline levels in these patients does not provide support for ongoing myelin breakdown or glial cell proliferation in this brain region in familial bipolar I disorder. The significant association between illness duration and N-acetylaspartate concentration in the right hippocampus supports the idea that neuronal pathology may increase with disease progression and that this effect may be lateralized, involving the right but not the left hippocampus.
Evidence has been far from conclusive as to whether there are abnormalities of hippocampal structure and function in bipolar disorder. Whereas a smaller total number and smaller density and size of nonpyramidal hippocampal neurons have been reported by Benes and colleagues (1), six of the seven published volumetric magnetic resonance imaging (MRI) studies of bipolar disorder that we are aware of reported no differences in hippocampal volumes of bipolar disorder patients relative to comparison subjects (2–7). Only one study noted a smaller right hippocampus in the bipolar disorder group (8). However, three high-resolution MRI studies of recurrent major depression demonstrated significantly smaller hippocampal volumes (9–11). Furthermore, in one study, smaller hippocampal volumes were correlated with the longer duration of major depression, suggesting that recurrent episodes of depression may result in hippocampal neuronal loss (9). One question that arises from these studies of mood disorders is whether hippocampal pathology in bipolar disorder is more subtle than that observed in major depression, perhaps too subtle to be reliably detected by MRI volumetric techniques. Furthermore, MRI volumetric techniques are currently not able to differentiate between smaller gray matter tissue volumes resulting from neuronal loss or atrophy and smaller volumes resulting from reductions in glial cell number or density.
N-Acetylaspartate is the second most abundant amino acid in the central nervous system and is reliably measured by proton magnetic resonance spectroscopy (1H-MRS). N-Acetylaspartate is formed in mitochondria from acetyl coenzyme A and aspartate by the membrane-bound enzyme l-aspartate N-acetyltransferase, an enzyme selectively found in brain (12). In studies using immunohistochemical techniques, N-acetylaspartate has been shown to be predominantly localized to neurons, axons, and dendrites within the CNS (13). Animal models of neuronal injury have been shown to give good correlations between N-acetylaspartate levels as measured by 1H-MRS and neuronal counts as measured by histological techniques (14–16). Low N-acetylaspartate is thought to represent loss of neurons and/or axons, reduction of interneuronal neuropil, and neuronal or axonal metabolic dysfunction or damage (17–20). Our previous study of patients with schizophrenia (21) found low N-acetylaspartate bilaterally in the absence of smaller hippocampal volume as measured by MRI, supporting the idea that N-acetylaspartate may be a more sensitive marker of neuronal damage or loss than quantitative MRI measurements of tissue loss.
The choline signal measured by 1H-MRS is derived predominantly from constituents of membrane phospholipid metabolism (22, 23), such as glycerophosphocholine and phosphocholine, which account for more than 50% of the resonance, and glycerophosphoethanolamine and phosphoethanolamine, which account for between 10% (in adults) and 25% (in the newborn) of the resonance. The choline signal is known to be significantly higher in conditions where there is ongoing myelin breakdown and/or glial cell proliferation, such as multiple sclerosis, adrenoleukodystrophy, brain tumors, and reactive gliosis (24, 25). While two earlier studies (26, 27) reported that changes in dietary choline could affect the choline signal, more recent studies have demonstrated that neither short-term nor long-term administration of oral choline appears to alter the 1H-MRS choline resonance or the proton-decoupled phosphorous MRS glycerophosphorylcholine and phosphorylcholine resonances in cortical gray matter, cortical white matter, basal ganglia, thalamus, and cerebellum (28, 29).
To our knowledge, no published studies to date have used 1H-MRS to investigate hippocampal neuronal loss or dysfunction in bipolar disorder. Renshaw and colleagues (30) reported lower N-acetylaspartate measures bilaterally in the temporal lobe in 13 patients with first-episode psychosis, including six bipolar disorder patients; however, their findings were not specific to the hippocampus. Therefore, we used 1H-MRS to test the hypothesis that hippocampal N-acetylaspartate was lower in patients with bipolar I disorder, suggesting neuronal loss and/or dysfunction. A second objective was to determine if the choline level in this region was higher, suggesting possible myelin breakdown or significant glial cell proliferation. A third objective was to determine if lower measures of N-acetylaspartate in the hippocampus were associated with illness duration. To avoid the potential confounding effects of gender and clinical-state-dependent changes on N-acetylaspartate measures, and because emerging evidence has suggested that abnormalities in brain structure and function may be more prominent in familial mood disorders (31, 32), this study examined only euthymic male patients with familial bipolar I disorder.
Method
Subjects
Fifteen male patients who met the DSM-IV criteria for bipolar I disorder (mean age=39.3 years, SD=10.3) and 20 male comparison subjects (mean age=36.0 years, SD=10.7) gave written informed consent for participation in the study after the procedures had been fully explained. The procedures were approved by the University of California, San Francisco, Committee on Human Research. Subjects were recruited from the San Francisco Veterans Affairs Medical Center, local outpatient mental health clinics, and the local community by means of a newspaper advertisement. All subjects with bipolar I disorder were stable outpatients at the time of the study. The demographic and clinical characteristics of the patients are summarized in Table 1. The diagnosis of bipolar I disorder was confirmed by using the Structured Clinical Interview for DSM-IV (SCID) (33). The mean time since onset of illness was 18.7 years (SD=9.5). The mean number of years of education was 14.3 (SD=2.5) for the patients and 15.4 (SD=2.7) for the comparison subjects. To avoid the potential confounding effect of gender, only male subjects were included in the study. All of the patients had a family history of major mood disorder in first-degree relatives (parent, sibling, or offspring). The comparison subjects were also assessed by using the SCID to rule out any major axis I diagnoses. All subjects were right-handed, as assessed by the Annett Handedness Questionnaire (34). All but three of the patients were taking medication at the time of the study. The three patients who were not taking medication at the time of the study had elected to temporarily discontinue their medications several months before the study during a period of sustained euthymia. The patients had all been euthymic for at least 2 months before the study, as documented by clinical interview, history, and scores on the Young Mania Rating Scale (35) and Hamilton Depression Rating Scale (36) on the day of the 1H-MRS study. All patients achieved a score of 6 or less on each of these separate rating scales. None of the patients had a history of head injury, organic mental disorder, neurological disorder, cerebrovascular disease, schizophrenia, or anxiety disorder, and none had a history of clinically significant alcohol or substance abuse in the 12 months before the study. None of the comparison subjects had a history of significant medical illness, head injury, neurological disorder, psychiatric disorder, or alcohol or substance abuse, and none had a family history of psychiatric disorder. The patient and comparison groups had no significant differences in age (t=0.91, df=33, p=0.37), years of education (t=–1.19, df=33, p=0.24), or years of parental education (t=0.80, df=33, p=0.43).
MRI/1H-MRS Examinations
All MRI/1H-MRS studies were performed at the Magnetic Resonance Unit of the San Francisco Veterans Affairs Medical Center on a Siemens 1.5-T Magnetom VISION magnetic resonance imaging/spectroscopy (MRI/MRS) system (Siemens, New York) with a standard circularly polarized head coil. Each subject was assigned a numeric code to allow measurement and data processing by researchers who were blind to the subject’s group. MRI sequences included 1) T1-weighted scout views in the sagittal, coronal, and axial planes for positioning MRI and 1H-MRS slices, 2) axial T2-weighted images from double spin echo (TR=3000 msec, TE1=20 msec, TE2=80 msec, resolution=1×1.4 mm2, slice thickness=3 mm), oriented –10° off the planum sphenoidale, and 3) coronal T1-weighted images from three-dimensional magnetization-prepared rapid acquisition gradiant echo (MP-RAGE) (TR=10 msec, TI=250 msec, TE=4 msec, resolution 1×1 mm2 resolution, 1.4 mm slice thickness), orthogonal to the long axis of the hippocampus. The MRI scans from both the comparison subjects and the patients were evaluated by a board-certified neuroradiologist (R.F.) to determine if any abnormalities were present. 1H-MRS data were acquired by using a spin echo 1H-MRS sequence at TR=1800 msec and TE=135 msec with preselection of a region of interest for point-resolved spectroscopy. The point-resolved spectroscopy volume for the hippocampal region was angulated parallel to the long axis of the hippocampi as seen from the sagittal scout images and positioned on the axial plane to include both hippocampi in their entire length and adjacent sections of the midbrain and temporal lobe. The 1H-MRS field of view was 210×210 mm2 and was sampled by using a circular k-space scheme equivalent to a maximum of 24×24 phase encoding steps (37), resulting in a nominal voxel resolution of 1.1 ml. Spectral sweep width was 1000 Hz.
MRI Tissue Segmentation
The MRI tissue segmentation and volumetric methods have been previously described (38) and have been validated (39) by using an MRI simulator and digital brain phantoms developed by investigators at the Montreal Neurological Institute (40, 41), with percentage volume differences of less than 5% and spatial distribution overlaps greater than 0.94 (1.00 is perfect). The double spin echo study was in the axial plane with 3-mm interleaved slices. The three-dimensional T1 study used the Siemens MP-RAGE sequence, which gathers 1.4-mm thick coronal slices with an in-plane pixel size of 0.97×0.97 mm. Analysis began with the first-pass autosegmentation, which separated the brain into gray matter, white matter, and CSF. In-house software was used to 1) remove the skull and meninges from the images, 2) coregister each of the interleaves of the spin echo images to T1 images reformatted to the axial plane, 3) correct radio frequency inhomogeneity in three dimensions, 4) define seeds (based on peaks in the three-dimensional histogram of T1 pixel intensities) for the K-means cluster analysis, and 5) transfer the data to statistical software that performs the actual cluster analysis. The initial process was followed by computer-assisted editing of the data to separate cortical from subcortical gray matter, to separate ventricular CSF from sulcal CSF, and to reclassify white matter incorrectly classified in the first pass into a category of white matter with an abnormal MRI signal or of white matter signal hyperintensity. This was followed by manual delineation of the boundaries of the cortical regions, subcortical structures, the cerebellum, and the hippocampi. For the hippocampus, manual tracing of the boundaries on each coronal MP-RAGE slice where the hippocampus was visible was performed to create right and left hippocampal tissue volume masks. The tracing was verified by a neuroradiologist (R.F.). Creation of hippocampal tissue volume masks was necessary because the tissue segmentation method was not able to reliably differentiate gray matter and white matter within the hippocampus itself. Reliability studies for 10 healthy subjects on two separate occasions revealed 1) interoperator correlations of 0.99 for ventricular CSF, 0.98 for sulcal CSF, 0.95 for cortical gray matter, 0.92 for white matter, 0.94 for the percentage of white matter signal hyperintensity, 0.94 for the right hippocampal tissue volume mask, and 0.95 for the left hippocampal tissue volume mask, and 2) intraoperator correlations of 0.99 for ventricular CSF, 0.99 for sulcal CSF, 0.97 for cortical gray matter, 0.93 for white matter, 0.97 for percentage of white matter signal hyperintensity, 0.98 for the right hippocampal tissue volume mask, and 0.98 for the left hippocampal tissue volume mask.
MRI/MRSI Coanalysis
After acquisition, the 1H-MRS data were zero filled to a rectangular matrix of 32×32×1024 points, Fourier transformed, phase corrected, and baseline corrected by using software developed in house (42). Four-Hz Gaussian line broadening was used in the spectral direction, and mild Gaussian apodization was applied along the spatial directions to reduce Gibbs ringing effects, resulting in an effective volume of approximately 1.6 ml for the MRS voxels. By using spectroscopic imaging display software (42), a reference image of the total 1H signal was generated together with higher-resolution, spatially coregistered MR axial double spin echo images. A single operator who was blind to the subjects’ diagnostic group adjusted the coregistered MR axial image intensity and contrast to optimize visualization of the hippocampus and then selected three voxels each in the right and left hippocampus for each subject. Figure 1 (upper panel) illustrates three representative right hippocampal voxels. 1H spectra from these voxels were fit by an automated curve fitting software program developed in our laboratory (43). A typical spectrum from a single hippocampal MRS voxel is shown in Figure 1 (lower panel). Absolute integrals were corrected for differential head coil loading and receiver gain for each subject to obtain concentration estimates of N-acetylaspartate, choline, and creatine in institutional units. To help control for any motion artifacts, line widths for N-acetylaspartate, choline, and creatine were measured and found not to be significantly different between groups. N-Acetylaspartate, choline, and creatine concentration estimates were obtained, rather than metabolite peak ratios such as the ratio of N-acetylaspartate to creatine or of N-acetylaspartate to choline, because N-acetylaspartate metabolite ratios must account for alterations in the creatine reference peak that invalidate their usefulness as an internal reference for the other metabolite peaks of the proton spectrum (24).
To obtain tissue-volume-corrected N-acetylaspartate, choline, and creatine concentration estimates and to verify that any alterations in these metabolites were not an artifact of variations in the tissue composition of the MRS voxels, the tissue enclosed in each voxel was analyzed for amounts of hippocampus, surrounding white matter outside the hippocampus (extrahippocampal white matter), surrounding gray matter outside the hippocampus (extrahippocampal gray matter), and CSF. By using in-house software, the tissue composition of each MRS voxel was determined from MRI segmentation data, taking into account the point spread function, chemical shift offset due to use of slice-selective gradients in the presence of radio frequency pulses, the slice profile, and postacquisition spatial filtering functions used to reduce voxel bleeding. The tissue content, p, in each voxel was estimated with the following equation: p=(hippocampus + extrahippocampal white matter + extrahippocampal gray matter), where hippocampus, extrahippocampal white matter, and extrahippocampal gray matter represent the number of pixels from the segmented MR images of hippocampus as well as white matter and gray matter outside the hippocampus. With the assumption that metabolite resonances are not detected in CSF, tissue-volume-corrected metabolite intensities were computed according to the following equation: metabolite=metaboliteU × 1/p, where metaboliteU is the uncorrected intensity. The tissue composition in each voxel was characterized by computing an MRS voxel % hippocampus (% hippocampus=hippocampus/p×100), an MRS voxel % hippocampal white matter (% hippocampal white matter=extrahippocampal white matter/p×100), and an MRS voxel % extrahippocampal gray matter (% extrahippocampal gray matter=extrahippocampal gray matter/p×100). These tissue percentages were used as covariates for the statistical analysis to determine the extent to which the tissue composition contributed to any metabolite differences. Details of the MRI/1H-MRS coanalysis approach have been previously described (44, 45).
For each subject, a single tissue-volume-corrected mean N-acetylaspartate value, mean choline value, and mean creatine value were obtained for the right hippocampus by averaging the tissue-volume-corrected N-acetylaspartate, choline, and creatine concentration estimates, respectively, of the three selected MRS voxels in the right hippocampus; and for the left hippocampus by averaging the tissue-volume-corrected N-acetylaspartate, choline, and creatine concentration estimates, respectively, of the three selected MRS voxels in the left hippocampus. Similarly, a mean tissue content value, a mean MRS voxel % hippocampus value, a mean MRS voxel % extrahippocampal white matter value, and a mean MRS voxel % extrahippocampal gray matter value were calculated separately for the right and left hippocampus in each subject by averaging the tissue content, MRS voxel % hippocampus values, MRS voxel % extrahippocampal white matter values, and MRS voxel % extrahippocampal gray matter values, respectively, for the three right hippocampal and the three left hippocampal MRS voxels.
Statistical Analysis
Repeated-measures analysis of variance was used for data analysis. Mean N-acetylaspartate, choline, and creatine concentration estimates, mean MRS voxel % hippocampus, mean MRS voxel % extrahippocampal white matter, and mean MRS voxel % extrahippocampal gray matter were the dependent variables; group was the between-subjects factor; and side (left versus right) was the within-subjects factor. To test whether any group differences in N-acetylaspartate, choline, or creatine were independent of differences in voxel tissue composition, analysis of covariance (ANCOVA) was performed by using the MRS voxel % hippocampus, MRS voxel % extrahippocampal white matter, and the MRS voxel % extrahippocampal gray matter values as covariates. Finally, regression analysis was used to examine the association between illness duration and N-acetylaspartate concentration estimate. The criterion of significance level was set at p<0.05.
Results
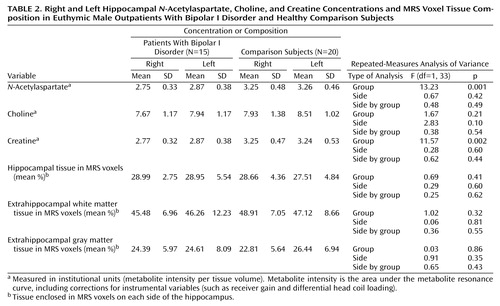
No abnormalities were noted on the MRI images of the bipolar I disorder patients or the comparison group. The mean N-acetylaspartate, choline, creatine, MRS voxel % hippocampus, MRS voxel % extrahippocampal white matter, and MRS voxel % extrahippocampal gray matter values for the two groups are shown in Table 2. Relative to the comparison group, the patients had significantly lower N-acetylaspartate and creatine concentrations in both the right and left hippocampi. There were no significant group or lateralized differences for choline, MRS voxel % hippocampus, MRS voxel % extrahippocampal white matter, or MRS voxel % extrahippocampal gray matter.
ANCOVA analysis revealed that neither variations of the MRS voxel % hippocampus, MRS voxel % extrahippocampal white matter, or MRS voxel % extrahippocampal gray matter contributed significantly to the group differences in N-acetylaspartate and creatine. These results suggest that the group differences in N-acetylaspartate and creatine are not simply an artifact of variations in the tissue composition of the selected voxels.
In the bipolar I disorder group, there was a significant negative correlation between right hippocampal N-acetylaspartate concentration and years of illness (r=–0.66, N=15, p=0.003) after adjusting for age (Figure 2). There was no significant correlation between left hippocampal N-acetylaspartate concentration and years of illness. With regard to mood stabilizing medications, there were no significant correlations between 1) N-acetylaspartate concentration and divalproex dose for either the right or left hippocampus or 2) N-acetylaspartate concentration and lithium dose for either the right or the left hippocampus.
Discussion
To our knowledge, this is the first published report of significantly lower N-acetylaspartate in both the right and left hippocampus in euthymic male patients with familial bipolar I disorder, relative to healthy comparison subjects. Previous 1H-MRS studies of other brain regions in bipolar disorder have reported lower N-acetylaspartate bilaterally in the dorsolateral prefrontal region (46), as well as normal N-acetylaspartate measures in the lenticular nuclei (47) and frontal lobes (48). Given that N-acetylaspartate is found only in neurons and axons but not mature glial cells, lower hippocampal N-acetylaspartate measures suggest loss of neurons and/or axons, reduction of interneuronal neuropil, neuronal or axonal metabolic dysfunction, or some combination of these processes. The finding of normal choline levels in the bipolar I disorder patients suggests that there is no biochemical evidence of myelin breakdown or glial cell proliferation in the hippocampus. A finding of lower hippocampal N-acetylaspartate is consistent with the smaller total number, cell density, and cell size of nonpyramidal hippocampal neurons observed in the postmortem study by Benes and colleagues (1).
Lower hippocampal N-acetylaspartate may be the result of stress-induced cellular changes mediated by higher levels of glucocorticoids. The two major structural changes in the hippocampus that occur as a result of stress are atrophy of CA3 pyramidal neurons (49) and reduced adult neurogenesis of granule cells in the dentate gyrus (50, 51). A number of studies over the years have demonstrated how stress and adrenal glucocorticoids directly cause hippocampal neuronal atrophy as well as reduce cellular resilience, thereby making neurons more vulnerable to ischemia, hypoglycemia, and excitatory amino acid toxicity (49, 52, 53). Since hypercortisolemia is a frequent finding during episodes of major depression, elevations in glucocorticoid levels may induce similar hippocampal neuronal alterations as a result of repeated episodes of depression; however, the evidence for this relationship at present remains indirect (53). Therefore, it is reasonable to hypothesize that glucocorticoid-induced cell damage or loss, thought to be responsible for the smaller hippocampal volumes observed by means of MRI in major depression, may also be occurring in bipolar I disorder, resulting in compromised neuronal function or loss and lower hippocampal N-acetylaspartate measures. However, it should be noted that none of the bipolar I disorder patients in this study were assessed for elevations in glucocorticoids.
Alterations in neurotrophic or neuroprotective factors may also underlie lower hippocampal N-acetylaspartate measures. Stress appears to decrease expression of brain-derived neurotrophic factor (BDNF) (54), which is critical for both the survival and function of neurons in the developing and adult brain (55). Thus, stress-induced reductions in BDNF could lead to damage and loss of hippocampal neurons. Another major neuroprotective and neurotrophic factor, B-cell lymphoma/leukemia-2 gene proteins (Bcl-2), inhibits programmed cell death (56, 57); yet, when overexpressed, Bcl-2 promotes regeneration of axons and regulates neurite sprouting (58). It is interesting to note that lithium and valproate appear to robustly increase Bcl-2 levels in both in vitro and in vivo experimental models (20). Both BDNF and Bcl-2 expression are regulated by the transcription factor cyclic adenosine monophosphate response element-binding protein (CREB), and recent studies have shown lower levels of CREB in the temporal cortex in depressed patients (59) and up-regulated CREB and hippocampal expression of BDNF in response to chronic antidepressant treatment (60–62). Findings such as these support the idea that major mood disorders could result from a failure or compromise of mechanisms that regulate neuronal plasticity. It is therefore conceivable that reductions in BDNF and/or Bcl-2 are occurring in bipolar I disorder, adversely affecting hippocampal neuronal plasticity and survival and resulting in a lower hippocampal N-acetylaspartate levels.
Alternatively, a lower hippocampal N-acetylaspartate may be a consequence of alterations in reelin, a secretory glycoprotein responsible for normal lamination of the brain. In the adult mammalian brain, reelin is localized to layer I cortical Cajal-Retzius cells, cortical and hippocampal interneurons, and cerebellar granule cells (63, 64). Reelin contributes to neuronal plasticity in the brains of adults by acting on integrin receptors expressed in spine postsynaptic densities. An important consequence of reelin signaling is the activation of the focal adhesion tyrosine kinase system, which is a component of a postsynaptic mechanism responsible for an increase in the number of synapses and alterations in postsynaptic structure in axons, dendrites, and the intermediate filament cytoskeleton of astrocytes (63, 65). The heterozygous reeler mouse, which expresses only 50% of the reelin protein levels seen in wild-type mice, exhibits reduced cortical neuropil expression, neuronal packing density, and dendritic spine density (66). Recent studies of patients with bipolar disorder have reported 1) lower blood levels of reelin and its isoforms (63), 2) lower reelin mRNA in prefrontal cortex and cerebellum (64, 67), and 3) lower reelin protein in the CA4 areas of the hippocampus (68). Therefore, lower levels of hippocampal reelin in bipolar disorder could result in lower hippocampal N-acetylaspartate, reflecting shrinkage of the interneuronal neuropil.
The second finding of this study was a lower concentration of hippocampal creatine bilaterally in the bipolar I disorder patients than in the comparison subjects. The creatine signal measures both creatine and phosphocreatine together, which are in rapid chemical enzymatic exchange in the human brain. In addition, the level of creatine in the brain can be significantly altered by osmotic forces as well as by extracerebral events due to the complex biosynthetic pathway through liver and kidney enzymes (24). Because of this complexity, it is difficult to attribute differences in creatine simply to local derangements of cellular energy metabolism. Nevertheless, since phosphocreatine is linked to ATP through the creatine-kinase equilibrium, alterations in creatine could be related to changes in hippocampal metabolism.
The third finding of this study was that lower hippocampal N-acetylaspartate and creatine concentrations cannot be attributed to differences in voxel tissue heterogeneity. This analysis was made possible by using information from coregistered MRI tissue segmentation data. This result is important because it documents that the observed alterations in hippocampal N-acetylaspartate and creatine are not merely a reflection of differences in the tissue composition of the MRS voxels. Furthermore, it emphasizes the value of using MRI-derived tissue segmentation information to improve the analysis of spectral metabolite data from 1H-MRS investigations.
The fourth finding of this study was the presence of a significant negative correlation between right hippocampal N-acetylaspartate concentration and illness duration. This finding supports the idea that neuronal atrophy, loss, or dysfunction may increase in this region with disease progression. To our knowledge, this is the first in vivo 1H-MRS study of bipolar disorder to report such a correlation. Furthermore, none of the 1H-MRS studies of schizophrenia have reported a significant negative correlation between illness duration and hippocampal or medial temporal lobe N-acetylaspartate measures (21, 69–77). This finding is consistent with previous findings of 1) a significant negative correlation between right temporal lobe volume and duration of illness in male patients with bipolar disorder (78), 2) a negative correlation between age at onset of bipolar I disorder and N-acetylaspartate measures in the right basal ganglia (47), and 3) negative correlations between illness duration and both right and left prefrontal N-acetylaspartate measures (46). Taken together, these findings suggest that illness progression may result in further neuropathological changes in multiple brain regions in bipolar disorder and may perhaps involve brain regions in the right hemisphere more than the left.
With regard to the limitations of the present study, the long-term effects of medications on the hippocampus, which are not known, may have influenced the results. Although no significant associations between N-acetylaspartate concentrations and either divalproex or lithium doses were found, it is conceivable that long-term exposure to neuroleptics, mood stabilizers, or antidepressants may be associated with alterations in both the structure and neuronal integrity of the hippocampus. Preliminary studies have suggested that both atypical and typical neuroleptics may increase previously low N-acetylaspartate levels toward more normative values in the anterior cingulate and dorsolateral prefrontal regions in schizophrenia (79, 80). Studies of healthy volunteers and bipolar disorder patients demonstrated that 4 weeks of lithium administration significantly increased N-acetylaspartate in the frontal, temporal, parietal, and occipital lobes (81), as well as significantly increased total gray matter content in the bipolar disorder patients (81, 82). There is also evidence that valproate activates pathways that regulate BDNF, robustly increases trophic factors such as Bcl-2 and growth cone associated protein, and promotes neurite outgrowth in as well as prolongs survival of human neuroblastoma cells (20). Although antidepressant effects on N-acetylaspartate measures have not been investigated, chronic administration of several different classes of antidepressants has been shown to increase neurogenesis in the adult rodent hippocampus (83–86), and this effect may be related to antidepressant-induced up-regulation of hippocampal CREB and BDNF (60–62). If chronic administration of antidepressants, lithium, and valproate can all potentially increase N-acetylaspartate by promoting neurogenesis, this would mean that hippocampal N-acetylaspartate measures in unmedicated bipolar I disorder patients might be even lower than those reported in the present study of mostly medicated patients.
Finally, the number of subjects was small, and alterations in the T1 or T2 of proton metabolites in the hippocampal region of the patients might have contributed to the observed differences. In other words, as a consequence of relaxation time differences, the N-acetylaspartate measures observed in this study may have to some degree reflected differences in metabolite variability as well as metabolite concentrations; however, there is no evidence that N-acetylaspartate in bipolar disorder patients has abnormal relaxation times. Nevertheless, future studies will probably need to determine if there are significant alterations in N-acetylaspartate relaxation times in the hippocampus of patients with bipolar I disorder.
 |
 |
Received March 11, 2002; revision received Sept. 24, 2002; accepted Sept. 26, 2002. From the Magnetic Resonance Unit and Psychiatry Service, Veterans Affairs Medical Center, San Francisco; and the Departments of Radiology and Psychiatry, University of California, San Francisco School of Medicine, San Francisco. Address reprint requests to Dr. Deicken, Psychiatry Service, 116-N, Veterans Affairs Medical Center, 4150 Clement St., San Francisco, CA 94121; [email protected] (e-mail). Supported by a 1998 Stanley Foundation Research Award from the National Alliance for the Mentally Ill and NIMH grant MH-62102 (Dr. Deicken).

Figure 1. Axial MRI Scan Showing the Location of Three Representative MRS Voxels in the Right Hippocampus (upper panel) and a Typical Proton Spectrum (lower panel) From a Single MRS Voxel Showing Peaks for N-Acetylaspartate, Choline, and Creatine

Figure 2. Correlation Between Right Hippocampal N-Acetylaspartate Concentration and Years of Illness in Euthymic Male Outpatients With Bipolar I Disordera
ar=–0.66, N=15, p=0.003, adjusted for the effect of age.
bInstitutional units=metabolite intensity per tissue volume. Metabolite intensity is the area under the metabolite resonance curve, including corrections for instrumental variables (such as receiver gain and differential head coil loading). Tissue volume is the amount of brain tissue enclosed in an MRS voxel.
1. Benes FM, Kwok EW, Vincent SL, Todtenkopf MS: A reduction of nonpyramidal cells in sector CA2 of schizophrenics and manic depressives. Biol Psychiatry 1998; 44:88-97Crossref, Medline, Google Scholar
2. Pearlson GD, Barta PE, Powers RE, Menon RR, Richards SS, Aylward EH, Federman EB, Chase GA, Petty RG, Tien AY: Ziskind-Somerfeld Research Award 1996: Medial and superior temporal gyral volumes and cerebral asymmetry in schizophrenia versus bipolar disorder. Biol Psychiatry 1997; 41:1-14Crossref, Medline, Google Scholar
3. Sax KW, Strakowski SM, Zimmerman ME, DelBello MP, Keck PE Jr, Hawkins JM: Frontosubcortical neuroanatomy and the Continuous Performance Test in mania. Am J Psychiatry 1999; 156:139-141Link, Google Scholar
4. Hauser P, Matochik J, Altshuler LL, Denicoff KD, Conrad A, Li X, Post RM: MRI-based measurements of temporal lobe and ventricular structures in patients with bipolar I and bipolar II disorders. J Affect Disord 2000; 60:25-32Crossref, Medline, Google Scholar
5. Altshuler LL, Bartzokis G, Grieder T, Curran J, Mintz J: Amygdala enlargement in bipolar disorder and hippocampal reduction in schizophrenia: an MRI study demonstrating neuroanatomic specificity (letter). Arch Gen Psychiatry 1998; 55:663-664Medline, Google Scholar
6. Altshuler LL, Bartzokis G, Grieder T, Curran J, Jimenez T, Leight K, Wilkins J, Gerner R, Mintz J: An MRI study of temporal lobe structures in men with bipolar disorder or schizophrenia. Biol Psychiatry 2000; 48:147-162Crossref, Medline, Google Scholar
7. Strakowski SM, DelBello MP, Sax KW, Zimmerman ME, Shear PK, Hawkins JM, Larson ER: Brain magnetic resonance imaging of structural abnormalities in bipolar disorder. Arch Gen Psychiatry 1999; 56:254-260Crossref, Medline, Google Scholar
8. Swayze VW II, Andreasen NC, Alliger RJ, Yuh WT, Ehrhardt JC: Subcortical and temporal structures in affective disorder and schizophrenia: a magnetic resonance imaging study. Biol Psychiatry 1992; 31:221-240Crossref, Medline, Google Scholar
9. Sheline YI, Wang PW, Gado MH, Csernansky JG, Vannier MW: Hippocampal atrophy in recurrent major depression. Proc Natl Acad Sci USA 1996; 93:3908-3913Crossref, Medline, Google Scholar
10. Shah PJ, Ebmeier KP, Glabus MF, Goodwin GM: Cortical grey matter reductions associated with treatment-resistant chronic unipolar depression: controlled magnetic resonance imaging study. Br J Psychiatry 1998; 172:527-532Crossref, Medline, Google Scholar
11. Bremner JD, Narayan M, Anderson ER, Staib LH, Miller HL, Charney DS: Hippocampal volume reduction in major depression. Am J Psychiatry 2000; 157:115-117Link, Google Scholar
12. Truckenmiller ME, Namboodiri MA, Brownstein MJ, Neale JH: N-Acetylation of l-aspartate in the nervous system: differential distribution of a specific enzyme. J Neurochem 1985; 45:1658-1662Crossref, Medline, Google Scholar
13. Simmons ML, Frondoza CG, Coyle JT: Immunocytochemical localization of N-acetyl-aspartate with monoclonal antibodies. Neuroscience 1991; 45:37-45Crossref, Medline, Google Scholar
14. Guimaraes AR, Schwartz P, Prakash MR, Carr CA, Berger UV, Jenkins BG, Coyle JT, Gonzalez RG: Quantitative in vivo 1H nuclear magnetic resonance spectroscopic imaging of neuronal loss in rat brain. Neuroscience 1995; 69:1095-1101Crossref, Medline, Google Scholar
15. Strauss I, Williamson JM, Bertram EH, Lothman EW, Fernandez EJ: Histological and 1H magnetic resonance spectroscopic imaging analysis of quinolinic acid-induced damage to the rat striatum. Magn Reson Med 1997; 37:24-33Crossref, Medline, Google Scholar
16. Sager TN, Topp S, Torup L, Hanson LG, Egestad B, Moller A: Evaluation of CA1 damage using single-voxel 1H-MRS and un-biased stereology: can non-invasive measures of N-acetyl-aspartate following global ischemia be used as a reliable measure of neuronal damage? Brain Res 2001; 892:166-175Crossref, Medline, Google Scholar
17. De Stefano N, Matthews PM, Arnold DL: Reversible decreases in N-acetylaspartate after acute brain injury. Magn Reson Med 1995; 34:721-727Crossref, Medline, Google Scholar
18. Tsai G, Coyle JT: N-Acetylaspartate in neuropsychiatric disorders. Prog Neurobiol 1995; 46:531-540Crossref, Medline, Google Scholar
19. Hugg JW, Kuzniecky RI, Gilliam FG, Morawetz RB, Fraught RE, Hetherington HP: Normalization of contralateral metabolic function following temporal lobectomy demonstrated by 1H magnetic resonance spectroscopic imaging. Ann Neurol 1996; 40:236-239Crossref, Medline, Google Scholar
20. Manji HK, Moore GJ, Chen G: Clinical and preclinical evidence for the neurotrophic effects of mood stabilizers: implications for the pathophysiology and treatment of manic-depressive illness. Biol Psychiatry 2000; 48:740-754Crossref, Medline, Google Scholar
21. Deicken RF, Pegues M, Amend D: Reduced hippocampal N-acetylaspartate without volume loss in schizophrenia. Schizophr Res 1999; 37:217-223Crossref, Medline, Google Scholar
22. Barker PB, Breiter SN, Soher BJ, Chatham JC, Forder JR, Samphilipo MA, Magee CA, Anderson JH: Quantitative proton spectroscopy of canine brain: in vivo and in vitro correlations. Magn Reson Med 1994; 32:157-163Crossref, Medline, Google Scholar
23. Bluml S, Seymour K, Ross B: Developmental changes in choline- and ethanolamine-containing compounds measured with proton-decoupled (31)P MRS in vivo human brain. Magn Reson Med 1999; 42:643-654Crossref, Medline, Google Scholar
24. Ross B, Michaelis T: Clinical applications of magnetic resonance spectroscopy. Magn Reson Quarterly 1994; 10:191-247Medline, Google Scholar
25. Tedeschi G, Bertolino A, Righini A, Campbell G, Raman R, Duyn JH, Moonen CT, Alger JR, Di Chiro G: Brain regional distribution pattern of metabolite signal intensities in young adults by proton magnetic resonance spectroscopic imaging. Neurology 1995; 45:1384-1391Crossref, Medline, Google Scholar
26. Stoll AL, Renshaw PF, De Micheli E, Wurtman R, Pillay SS, Cohen BM: Choline ingestion increases the resonance of choline-containing compounds in human brain: an in vivo proton magnetic resonance study. Biol Psychiatry 1995; 37:170-174Crossref, Medline, Google Scholar
27. Cohen BM, Renshaw PF, Stoll AL, Wurtman RJ, Yurgelun-Todd D, Babb SM: Decreased brain choline uptake in older adults: an in vivo proton magnetic resonance spectroscopy study. JAMA 1995; 274:902-907Crossref, Medline, Google Scholar
28. Tan J, Bluml S, Hoang T, Dubowitz D, Mevenkamp G, Ross B: Lack of effect of oral choline supplement on the concentrations of choline metabolites in human brain. Magn Reson Med 1998; 39:1005-1010Crossref, Medline, Google Scholar
29. Dechent P, Pouwels PJ, Frahm J: Neither short-term nor long-term administration of oral choline alters metabolite concentrations in human brain. Biol Psychiatry 1999; 46:406-411Crossref, Medline, Google Scholar
30. Renshaw PF, Yurgelun-Todd DA, Tohen M, Gruber S, Cohen BM: Temporal lobe proton magnetic resonance spectroscopy of patients with first-episode psychosis. Am J Psychiatry 1995; 152:444-446Link, Google Scholar
31. Drevets WC, Price JL, Simpson JR Jr, Todd RD, Reich T, Vannier M, Raichle ME: Subgenual prefrontal cortex abnormalities in mood disorders. Nature 1997; 386:824-827Crossref, Medline, Google Scholar
32. Ongür D, Drevets WC, Price JL: Glial reduction in the subgenual prefrontal cortex in mood disorders. Proc Natl Acad Sci USA 1998; 95:13290-13295Crossref, Medline, Google Scholar
33. First MB, Spitzer RL, Gibbon M, Williams JBW: Structured Clinical Interview for DSM-IV Axis I Disorders, Patient Edition (SCID-P), version 2. New York, New York State Psychiatric Institute, Biometrics Research, 1995Google Scholar
34. Annett M: A classification of hand preference by association analysis. Br J Psychol 1970; 61:303-321Crossref, Medline, Google Scholar
35. Young RC, Biggs JT, Ziegler VE, Meyer DA: A rating scale for mania: reliability, validity and sensitivity. Br J Psychiatry 1978; 133:429-435Crossref, Medline, Google Scholar
36. Hamilton M: A rating scale for depression. J Neurol Neurosurg Psychiatry 1960; 23:56-62Crossref, Medline, Google Scholar
37. Maudsley AA, Matson GB, Hugg JW, Weiner MW: Reduced phase encoding in spectroscopic imaging. Magn Reson Med 1994; 31:645-651Crossref, Medline, Google Scholar
38. Deicken RF, Eliaz Y, Feiwell R, Schuff N: Increased thalamic N-acetylaspartate in male patients with familial bipolar I disorder. Psychiatry Res Neuroimaging 2001; 106:35-45Crossref, Medline, Google Scholar
39. Cardenas VA, Ezekiel F, Di Sclafani V, Gomberg B, Fein G: Reliability of tissue volumes and their spatial distribution for segmented magnetic resonance images. Psychiatry Res Neuroimaging 2001; 106:193-205Crossref, Medline, Google Scholar
40. Collins DL, Zijdenbos AP, Kollokian V, Sled JG, Kabani NJ, Holmes CJ, Evans AC: Design and construction of a realistic digital brain phantom. IEEE Trans Med Imaging 1998; 17:463-468Crossref, Medline, Google Scholar
41. Kwan RK, Evans AC, Pike GB: MRI simulation-based evaluation of image-processing and classification methods. IEEE Trans Med Imaging 1999; 18:1085-1097Crossref, Medline, Google Scholar
42. Maudsley AA, Lin E, Weiner MW: Spectroscopic imaging display and analysis. Magn Reson Imaging 1992; 10:471-485Crossref, Medline, Google Scholar
43. Soher BJ, Young K, Govindaraju V, Maudsley AA: Automated spectral analysis, III: application to in vivo proton MR spectroscopy and spectroscopic imaging. Magn Reson Med 1998; 40:822-831Crossref, Medline, Google Scholar
44. Schuff N, Amend D, Ezekiel F, Steinman SK, Tanabe J, Norman D, Jagust W, Kramer JH, Mastrianni JA, Fein G, Weiner MW: Changes of hippocampal N-acetyl aspartate and volume in Alzheimer’s disease: a proton MR spectroscopic imaging and MRI study. Neurology 1997; 49:1513-1521Crossref, Medline, Google Scholar
45. Schuff N, Amend DL, Meyerhoff DJ, Tanabe JL, Norman D, Fein G, Weiner MW: Alzheimer disease: quantitative H-1 MR spectroscopic imaging of frontoparietal brain. Radiology 1998; 207:91-102Crossref, Medline, Google Scholar
46. Winsberg ME, Sachs N, Tate DL, Adalsteinsson E, Spielman D, Ketter TA: Decreased dorsolateral prefrontal N-acetyl aspartate in bipolar disorder. Biol Psychiatry 2000; 47:475-481Crossref, Medline, Google Scholar
47. Ohara K, Isoda H, Suzuki Y, Takehara Y, Ochiai M, Takeda H, Igarashi Y: Proton magnetic resonance spectroscopy of the lenticular nuclei in bipolar I affective disorder. Psychiatry Res 1998; 84:55-60Crossref, Medline, Google Scholar
48. Hamakawa H, Kato T, Shioiri T, Inubushi T, Kato N: Quantitative proton magnetic resonance spectroscopy of the bilateral frontal lobes in patients with bipolar disorder. Psychol Med 1999; 29:639-644Crossref, Medline, Google Scholar
49. McEwen BS: Stress and hippocampal plasticity. Annu Rev Neurosci 1999; 22:105-122Crossref, Medline, Google Scholar
50. Gould E, McEwen BS, Tanapat P, Galea LA, Fuchs E: Neurogenesis in the dentate gyrus of the adult tree shrew is regulated by psychosocial stress and NMDA receptor activation. J Neurosci 1997; 17:2492-2498Crossref, Medline, Google Scholar
51. Gould E, Tanapat P, McEwen BS, Flugge G, Fuchs E: Proliferation of granule cell precursors in the dentate gyrus of adult monkeys is diminished by stress. Proc Natl Acad Sci USA 1998; 95:3168-3171Crossref, Medline, Google Scholar
52. Sapolsky RM: Glucocorticoids and hippocampal atrophy in neuropsychiatric disorders. Arch Gen Psychiatry 2000; 57:925-935Crossref, Medline, Google Scholar
53. Sapolsky RM: The possibility of neurotoxicity in the hippocampus in major depression: a primer on neuron death. Biol Psychiatry 2000; 48:755-765Crossref, Medline, Google Scholar
54. Smith MA, Makino S, Kvetnansky R, Post RM: Stress and glucocorticoids affect the expression of brain-derived neurotrophic factor and neurotrophin-3 mRNAs in the hippocampus. J Neurosci 1995; 15:1768-1777Crossref, Medline, Google Scholar
55. McAllister AK, Katz LC, Lo DC: Neurotrophins and synaptic plasticity. Annu Rev Neurosci 1999; 22:295-318Crossref, Medline, Google Scholar
56. Adams JM, Cory S: The Bcl-2 protein family: arbiters of cell survival. Science 1998; 281:1322-1326Crossref, Medline, Google Scholar
57. Bruckheimer EM, Cho SH, Sarkiss M, Herrmann J, McDonnell TJ: The Bcl-2 gene family and apoptosis. Adv Biochem Eng Biotech 1998; 62:75-105Medline, Google Scholar
58. Chen DF, Schneider GE, Martinou JC, Tonegawa S: Bcl-2 promotes regeneration of severed axons in mammalian CNS. Nature 1997; 385:434-439Crossref, Medline, Google Scholar
59. Dowlatshahi D, MacQueen GM, Wang JF, Young LT: Increased temporal cortex CREB concentrations and antidepressant treatment in major depression. Lancet 1998; 352:1754-1755Crossref, Medline, Google Scholar
60. Nibuya M, Morinobu S, Duman RS: Regulation of BDNF and trkB mRNA in rat brain by chronic electroconvulsive seizure and antidepressant drug treatments. J Neurosci 1995; 15:7539-7547Crossref, Medline, Google Scholar
61. Nibuya M, Nestler EJ, Duman RS: Chronic antidepressant administration increases the expression of cAMP response element binding protein (CREB) in rat hippocampus. J Neurosci 1996; 16:2365-2372Crossref, Medline, Google Scholar
62. Thome J, Sakai N, Shin K, Steffen C, Zhang YJ, Impey S, Storm D, Duman RS: cAMP response element-mediated gene transcription is upregulated by chronic antidepressant treatment. J Neurosci 2000; 20:4030-4036Crossref, Medline, Google Scholar
63. Fatemi SH, Kroll JL, Stary JM: Altered levels of reelin and its isoforms in schizophrenia and mood disorders. Neuroreport 2001; 12:3209-3215Crossref, Medline, Google Scholar
64. Guidotti A, Auta J, Davis JM, DiGiorgi Gerevini V, Dwivedi Y, Grayson DR, Impagnatiello F, Pandey G, Pesold C, Sharma R, Uzunov D, Costa E: Decrease in reelin and glutamic acid decarboxylase67 (GAD67) expression in schizophrenia and bipolar disorder: a postmortem brain study. Arch Gen Psychiatry 2000; 57:1061-1069; correction, 2002; 59:12Crossref, Medline, Google Scholar
65. Grant SG, Karl KA, Kiebler MA, Kandel ER: Focal adhesion kinase in the brain: novel subcellular localization and specific regulation by Fyn tyrosine kinase in mutant mice. Genes Dev 1995; 9:1909-1921Crossref, Medline, Google Scholar
66. Costa E, Davis J, Pesold C, Tueting P, Guidotti A: The heterozygote reeler mouse as a model for the development of a new generation of antipsychotics. Curr Opin Pharmacol 2002; 2:56-62Crossref, Medline, Google Scholar
67. Knable MB, Torrey EF, Webster MJ, Bartko JJ: Multivariate analysis of prefrontal cortical data from the Stanley Foundation Neuropathology Consortium. Brain Res Bull 2001; 55:651-659Crossref, Medline, Google Scholar
68. Fatemi SH, Earle JA, McMenomy T: Reduction in reelin immunoreactivity in hippocampus of subjects with schizophrenia, bipolar disorder and major depression. Mol Psychiatry 2000; 5:654-663Crossref, Medline, Google Scholar
69. Bertolino A, Nawroz S, Mattay VS, Barnett AS, Duyn JH, Moonen CTW, Frank JA, Tedeschi G, Weinberger DR: Regionally specific pattern of neurochemical pathology in schizophrenia as assessed by multislice proton magnetic resonance spectroscopic imaging. Am J Psychiatry 1996; 153:1554-1563Link, Google Scholar
70. Bertolino A, Callicott JH, Elman I, Mattay VS, Tedeschi G, Frank JA, Breier A, Weinberger DR: Regionally specific neuronal pathology in untreated patients with schizophrenia: a proton magnetic resonance spectroscopic imaging study. Biol Psychiatry 1998; 43:641-648Crossref, Medline, Google Scholar
71. Bertolino A, Kumra S, Callicott JH, Mattay VS, Lestz RM, Jacobsen L, Barnett IS, Duyn JH, Frank JA, Rapoport JL, Weinberger DR: Common pattern of cortical pathology in childhood-onset and adult-onset schizophrenia as identified by proton magnetic resonance spectroscopic imaging. Am J Psychiatry 1998; 155:1376-1383Link, Google Scholar
72. Deicken RF, Zhou L, Schuff N, Fein G, Weiner MW: Hippocampal neuronal dysfunction in schizophrenia as measured by proton magnetic resonance spectroscopy. Biol Psychiatry 1998; 43:483-488Crossref, Medline, Google Scholar
73. Maier M, Ron MA: Hippocampal age-related changes in schizophrenia: a proton magnetic resonance spectroscopy study. Schizophr Res 1996; 22:5-17Crossref, Medline, Google Scholar
74. Kegeles LS, Shungu DC, Anjilvel S, Chan S, Ellis SP, Xanthopoulos E, Malaspina D, Gorman JM, Mann JJ, Laruelle M, Kaufmann CA: Hippocampal pathology in schizophrenia: magnetic resonance imaging and spectroscopy studies. Psychiatry Res Neuroimaging 2000; 98:163-175Crossref, Medline, Google Scholar
75. Yurgelun-Todd DA, Renshaw PF, Gruber SA, Ed M, Waternaux C, Cohen BM: Proton magnetic resonance spectroscopy of the temporal lobes in schizophrenics and normal controls. Schizophr Res 1996; 19:55-59Crossref, Medline, Google Scholar
76. Buckley PF, Moore CM, Long H, Larkin C, Thompson P, Mulvany F, Redmond O, Stack JP, Ennis JT, Waddington JL: 1H-magnetic resonance spectroscopy of the left temporal and frontal lobes in schizophrenia: clinical, neurodevelopmental, and cognitive correlates. Biol Psychiatry 1994; 36:792-800Crossref, Medline, Google Scholar
77. Fukuzako H, Takeuchi K, Hokazono Y, Fukuzako T, Yamada K, Hashiguchi T, Obo Y, Ueyama K, Takigawa M, Fujimoto T: Proton magnetic resonance spectroscopy of the left medial temporal and frontal lobes in chronic schizophrenia: preliminary report. Psychiatry Res 1995; 61:193-200Crossref, Medline, Google Scholar
78. Altshuler LL, Conrad A, Hauser P, Li XM, Guze BH, Denikoff K, Tourtellotte W, Post R: Reduction of temporal lobe volume in bipolar disorder: a preliminary report of magnetic resonance imaging. Arch Gen Psychiatry 1991; 48:482-483Crossref, Medline, Google Scholar
79. Ende G, Braus DF, Walter S, Weber-Fahr W, Soher B, Maudsley AA, Henn FA: Effects of age, medication, and illness duration on the N-acetyl aspartate signal of the anterior cingulate region in schizophrenia. Schizophr Res 2000; 41:389-395Crossref, Medline, Google Scholar
80. Bertolino A, Callicott JH, Mattay VS, Weidenhammer KM, Rakow R, Egan MF, Weinberger DR: The effect of treatment with antipsychotic drugs on brain N-acetylaspartate measures in patients with schizophrenia. Biol Psychiatry 2001; 49:39-46Crossref, Medline, Google Scholar
81. Moore GJ, Bebchuk JM, Hasanat K, Chen G, Seraji-Bozorgzad N, Wilds IB, Faulk MW, Koch S, Glitz DA, Jolkovsky L, Manji HK: Lithium increases N-acetyl-aspartate in the human brain: in vivo evidence in support of bcl-2’s neurotrophic effects? Biol Psychiatry 2000; 48:1-8Crossref, Medline, Google Scholar
82. Moore GJ, Bebchuk JM, Wilds IB, Chen G, Manji HK: Lithium-induced increase in human brain grey matter. Lancet 2000; 356:1241-1242Crossref, Medline, Google Scholar
83. Jacobs BL, Praag H, Gage FH: Adult brain neurogenesis and psychiatry: a novel theory of depression. Mol Psychiatry 2000; 5:262-269Crossref, Medline, Google Scholar
84. Malberg JE, Eisch AJ, Nestler EJ, Duman RS: Chronic antidepressant treatment increases neurogenesis in adult rat hippocampus. J Neurosci 2000; 20:9104-9110Crossref, Medline, Google Scholar
85. Manev H, Uz T, Smalheiser NR, Manev R: Antidepressants alter cell proliferation in the adult brain in vivo and in neural cultures in vitro. Eur J Pharmacol 2001; 411:67-70Crossref, Medline, Google Scholar
86. Duman RS, Nakagawa S, Malberg J: Regulation of adult neurogenesis by antidepressant treatment. Neuropsychopharmacology 2001; 25:836-844Crossref, Medline, Google Scholar