Longitudinal PET Evaluation of Cerebral Metabolic Decline in Dementia: A Potential Outcome Measure in Alzheimer’s Disease Treatment Studies
Abstract
OBJECTIVE: It is well established that regional cerebral metabolic rates for glucose assessed by [18F]fluorodeoxyglucose (FDG) positron emission tomography (PET) in patients with Alzheimer’s disease in the mental resting state (eyes and ears covered) provide a sensitive, in vivo metabolic index of Alzheimer’s disease dementia. Few studies, however, have evaluated longitudinal declines in regional cerebral glucose metabolism in patients with dementia caused by Alzheimer’s disease. In addition, the available studies have not used recently developed brain mapping algorithms to characterize the progression of Alzheimer’s disease throughout the brain, and none considered the statistical power of regional cerebral glucose metabolism in testing the ability of treatments to attenuate the progression of dementia. METHOD: The authors used FDG PET and a brain mapping algorithm to investigate cross-sectional reductions in regional cerebral glucose metabolism, longitudinal decline in regional cerebral glucose metabolism after a 1-year follow-up, and the power of this method to evaluate treatments for Alzheimer’s disease in patients with mild to moderate dementia. PET scans were initially acquired in 14 patients with Alzheimer’s disease and 34 healthy comparison subjects of similar age and sex. Repeat scans were obtained in the patients 1 year later. Power analyses for voxels showing maximal decline over the 1-year period in regional cerebral glucose metabolism (mg/100 g per minute) were computed to estimate the sample sizes needed to detect a significant treatment response in a 1-year, double-blind, placebo-controlled treatment study. RESULTS: The patients with Alzheimer’s disease had significantly lower glucose metabolism than healthy comparison subjects in parietal, temporal, occipital, frontal, and posterior cingulate cortices. One year later, the patients with Alzheimer’s disease had significant declines in glucose metabolism in parietal, temporal, frontal, and posterior cingulate cortices. Using maximal glucose metabolism reductions in the left frontal cortex, we estimated that as few as 36 patients per group would be needed to detect a 33% treatment response with one-tailed significance of p≤0.005 and 80% power in a 1-year, double-blind, placebo-controlled treatment study. CONCLUSIONS: These findings indicate that brain metabolism as assessed by FDG PET during mental rest is a sensitive marker of disease progression in Alzheimer’s disease over a 1-year period. These findings also support the feasibility of using FDG PET as an outcome measure to test the ability of treatments to attenuate the progression of Alzheimer’s disease.
It is well established that [18F]fluorodeoxyglucose (FDG) positron emission tomography (PET) assessed during a mental resting state with eyes covered and ears occluded provides a sensitive, in vivo metabolic index of the neurophysiological effects of Alzheimer’s disease. Numerous cross-sectional studies (1–5) have shown that cerebral metabolic rates in parietal and temporal association regions are most consistently and severely lower in patients with Alzheimer’s disease than in healthy comparison subjects and that frontal association regions are increasingly affected as the disease progresses. Further, studies have shown that the posterior cingulate cortex may be affected very early in the progression of Alzheimer’s disease (6), even before the onset of clinical symptoms (7). Relatively few studies, however, have directly evaluated the longitudinal effects of the dementia in Alzheimer’s disease using PET (8–11). The available longitudinal PET studies have typically relied on relatively large regions of interest to assess regional effects over time and have not applied more recently available brain mapping algorithms to investigate regional progression of Alzheimer’s disease throughout the brain. Applying such a voxel-based approach may offer greater regional specificity than region-of-interest methods in characterizing the distribution of maximal declines in cerebral metabolism in Alzheimer’s disease.
Studying the longitudinal effects of Alzheimer’s disease on brain function is particularly relevant given the current interest in developing treatments that can slow or halt its progression. Most treatment studies have relied on general cognitive tests and global behavioral ratings to evaluate treatment efficacy in patients with Alzheimer’s disease (12, 13). Using functional neuroimaging to detect in vivo longitudinal changes in glucose metabolism directly in the brain may greatly enhance the ability to evaluate long-term treatments in the earliest stages of Alzheimer’s disease (14, 15). Further, in vivo metabolic studies provide the chance to determine the extent to which clinically effective treatments attenuate or potentially compensate for disease progression. The feasibility of using PET to evaluate long-term treatment effects in dementia, however, has yet to be directly investigated.
In this study, we used FDG PET and a statistical brain mapping algorithm to investigate cross-sectional and longitudinal reductions in regional cerebral glucose metabolism on a voxel basis in 14 Alzheimer’s disease patients with mildly to moderately severe dementia studied at baseline and after a 1-year follow-up. The baseline PET scans in the patients with Alzheimer’s disease were compared with scans obtained in 34 healthy comparison subjects of similar age and sex. Power analyses for voxels showing maximal 1-year rates of decline in regional cerebral glucose metabolism and for annual decline rates in cognitive test scores were computed for the Alzheimer’s disease group.
We hypothesized that the patients with Alzheimer’s disease would show metabolic decline over 1 year in brain regions known to be affected by the progression of Alzheimer’s disease. By using a voxel-based approach for the PET data analysis, we sought to identify those specific brain areas showing maximal decline in the patients with Alzheimer’s disease and to test with statistical power analyses the relative feasibility of using these regional cerebral glucose metabolism values as a potential outcome measure in long-term treatment studies of dementia in Alzheimer’s disease.
Method
Subjects
Fourteen otherwise healthy patients who met the research criteria of the National Institute of Neurological and Communicative Disorders and Stroke and the Alzheimer’s Disease and Related Disorders Association (16) for possible or probable Alzheimer’s disease and who had mildly to moderately severe dementia were included in the study. Twelve of these patients were men, and two were women. Their mean age was 65 years (SD=10); their mean score on the Mini-Mental State Examination (MMSE) (17) at initial evaluation was 20 (SD=4). A group of 34 healthy comparison subjects who were similar to the Alzheimer’s disease group in age and sex were included in the study to assess the cerebral metabolic effects of Alzheimer’s disease at baseline. The comparison group included 27 men and seven women; their mean age was 64 (SD=10); their mean MMSE score was 29 (SD=1).
The patients with Alzheimer’s disease received a second PET scan and cognitive evaluation an average of 12 months (SD=1) following the baseline assessment. Eight of the patients with Alzheimer’s disease were subsequently followed to autopsy, which confirmed their diagnosis of Alzheimer’s disease.
The PET and cognitive data were collected as part of a longitudinal Alzheimer’s disease study at the National Institute on Aging. All subjects and/or their designated proxies gave written informed consent to participate in the study after full explanation of the procedures and risks. This study was approved by the Institutional Review Board of the National Institute on Aging.
All subjects underwent medical, neurological, and psychiatric examination and laboratory testing (including EEG, brain magnetic resonance imaging [MRI], chest X-ray, ECG, blood and urine tests, and neuropsychological testing) to exclude conditions, other than Alzheimer’s disease, that could affect cognitive function and cerebral metabolism, as previously described (18). None of the subjects had taken over-the-counter medications for at least 2 weeks or psychotropic drugs for at least 4 weeks before the study.
The MMSE was used for comparison with regional cerebral glucose metabolism in the power analyses because it provides an overall measure of dementia severity and has been widely used as an outcome measure in treatment studies of Alzheimer’s disease. We also selected the Mattis Dementia Rating Scale (19) and WAIS full-scale IQ (20) from the neuropsychological screening battery for power analyses because they provide overall measures of cognitive function that are sensitive to a wide range of dementia severity and have been previously shown to be better predictors of the individual trajectories of cognitive decline in patients with Alzheimer’s disease than the MMSE (21).
PET Procedures
PET scans were performed with a Scanditronix PC1024-7B tomograph (Uppsala, Sweden). Seven horizontal slices were acquired with a transverse resolution of 6 mm and an axial resolution of 10 mm full width at half maximum. All scans were performed as the subjects rested quietly with their eyes covered and their ears occluded. A thermoplastic mask was used to maintain head position during scanning. Transmission scans were obtained before the emission scan for attenuation correction.
Measures of regional cerebral glucose metabolism were obtained following administration of a 5-mCi bolus intravenous injection of FDG. Emission scans were obtained after a 45-minute uptake period. Arterial blood levels of radioactivity and glucose concentration were assessed throughout the procedure to measure regional cerebral glucose metabolism in mg/100 g per minute (18). Rates of glucose metabolism were calculated by using the Brooks modification (22) of the equation by Sokoloff et al. (23).
PET Data Analysis
The PET scans were interpolated to 31 slices, registered, transformed into the coordinates of a standard brain atlas (24), and smoothed to 10 mm in the x, y, and z planes by using statistical parametric mapping (SPM 96) (25). Tests of between- and within-group differences were performed on a voxel-by-voxel basis for absolute glucose metabolism and values proportionally scaled to the pons. A significance threshold of p≤0.001, uncorrected for multiple tests, was used to identify group differences between the patients with Alzheimer’s disease and healthy comparison subjects at baseline.
Since declines in glucose metabolism were hypothesized to occur in the regions identified in the initial cross-sectional analysis (including parietal, temporal, frontal, and posterior cingulate cortices), we applied a significance threshold of p≤0.005, uncorrected for multiple tests, to determine significant decline in these areas over the 1-year follow-up period in the patients with Alzheimer’s disease.
The glucose metabolism values in the pons were extracted for each scan as a reference region because these values tend to be relatively preserved in Alzheimer’s disease (26) and did not differ significantly (p=0.16) over time in our patients with Alzheimer’s disease. Voxel values reflecting regional maxima for decline from baseline to 1-year follow-up in the patients with Alzheimer’s disease were extracted to compute change scores for subsequent power analyses.
Statistical Analyses
The number of subjects needed to detect significant 75%, 50%, 33%, and 25% reductions of decline with treatment over 1 year with 80% power in a future clinical trial comparing a treatment group with a placebo group were computed by using the G Power program (27). The power analyses were performed on the mean change (i.e., decline) in glucose metabolism for voxels showing the greatest decline over 1 year in the 14 patients with Alzheimer’s disease and for the mean change (i.e., decline) scores over 1 year for the MMSE, Mattis Dementia Rating Scale, and WAIS full-scale IQ in the same 14 patients. Power analyses were performed by using Hedges’s g (28) for an unpaired, two-tailed t test with the assumption of equal variances to test group differences in decline from baseline to 1-year follow-up for patients with Alzheimer’s disease randomly assigned to either placebo or active treatment. We used the significance threshold of p≤0.05, uncorrected for multiple tests, to allow for a direct comparison between the cognitive and PET measures.
Additionally, we computed the power analyses for the regional PET values using p≤0.005 (one-tailed), uncorrected for multiple tests, because this threshold has been used in voxel-based analyses of PET data with hypothesized regional effects.
Results
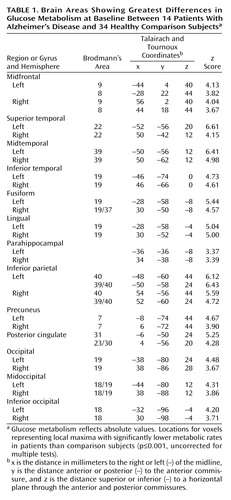
The patients with Alzheimer’s disease demonstrated significantly (p≤0.001, uncorrected for multiple tests) lower glucose metabolism than the healthy comparison subjects in multiple brain areas, including parietal, temporal, occipital, and frontal association regions and the posterior cingulate cortex (Table 1 and Figure 1). Metabolism in these regions was also significantly lower in patients than comparison subjects when the glucose metabolism values were ratio normalized to the pons (3.1≤z≤5.6).
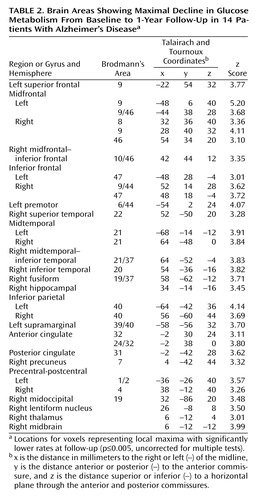
At 1-year follow-up, the patients with Alzheimer’s disease showed significant (p≤0.005, uncorrected for multiple tests) declines in glucose metabolism from baseline in the expected parietal, temporal, frontal, and posterior cingulate regions (Table 2 and Figure 2>). Declines were also observed for glucose metabolism values normalized to the pons in parietal and temporal regions (3.1≤z≤3.6), but these effects were generally diminished compared with declines in absolute glucose metabolism, and the decline in the frontal cortex did not reach significance.
The patients with Alzheimer’s disease showed a significant decline in MMSE scores over the 1-year interval (mean decline=2.9, SD=3.5) (t=3.05, df=13, p<0.01) as well as in Mattis Dementia Rating Scale scores (mean decline=18.1, SD=23.7) (t=2.86, df=13, p<0.014) and WAIS full-scale IQ (mean decline=9.7, SD=9.3) (t=3.90, df=13, p<0.002). Mean decline in glucose metabolism (mg/100 g per minute) for voxels showing maximal decline over the 1-year interval in the patients with Alzheimer’s disease was 0.86 (SD=0.33) in the left midfrontal cortex, 0.59 (SD=0.36) in the left inferior parietal region, 0.67 (SD=0.45) in the left midtemporal region, and 0.49 (SD=0.37) in the posterior cingulate cortex (Table 2). The patients with Alzheimer’s disease also showed a significant decline from baseline in global mean cerebral glucose metabolism (mean decline=0.26, SD=0.28) (t=3.47, df=13, p<0.005).
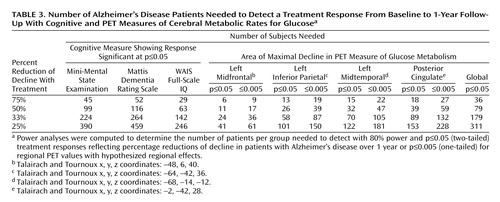
Table 3 shows the results for power analyses performed with the general cognitive measures and absolute PET decline in regional cerebral glucose metabolism values. These analyses estimated the number of subjects needed to detect 75%, 50%, 33%, and 25% reductions of decline in a randomized, double-blind, placebo-controlled Alzheimer’s disease treatment study. The power analyses estimated that a PET study of glucose metabolism would require as few as 24 patients with Alzheimer’s disease per group when the voxel value for the left midfrontal cortex that showed maximal decline in 1 year was used and from 58 to 89 patients per group when voxels showing maximal declines in the left inferior parietal, left midtemporal, and posterior cingulate cortices were used to detect a significant (p≤0.05, two-tailed) 33% effect of treatment with 80% power compared with the effect of placebo. Using the global mean cerebral glucose metabolism value, the analysis estimated that 179 patients per group would be required to detect the same treatment response.
The power results for the general cognitive tests estimated that from 142 to 264 patients with Alzheimer’s disease per group would be required, depending on the test used, to demonstrate a 33% treatment response with 80% power and p≤0.05 (two-tailed) significance.
Since data analysis in regional PET studies with statistical parametric mapping on a voxel-by-voxel basis often uses more conservative significance thresholds, we recalculated the power analyses for the PET voxels showing maximal declines using p≤0.005 (one-tailed, uncorrected for multiple tests), because this threshold has been used for hypothesized regional effects in PET studies. These analyses estimated that as few as 36 patients with Alzheimer’s disease per group would be needed to detect a 33% treatment response with 80% power and p≤0.005 (one-tailed, uncorrected for multiple tests) (Table 3).
Discussion
As expected, the Alzheimer’s disease group showed prominent cerebral glucose hypometabolism compared with healthy comparison subjects in bilateral parietal, temporal, and occipital association areas and the posterior cingulate cortex. Additionally, significant differences between patients and comparison subjects were observed at baseline in bilateral frontal association regions. These cross-sectional regional effects were present for both absolute glucose metabolism and values normalized to the pons and are consistent with previous reports of patterns of cerebral glucose hypometabolism typically observed in the mild to moderate stages of dementia in Alzheimer’s disease (2–5).
Evaluation of cerebral metabolic decline in the patients with Alzheimer’s disease after a 1-year follow-up showed additional significant reductions in absolute glucose metabolism from baseline in regions contained within the areas of hypometabolism initially observed in the cross-sectional analyses, including parietal, temporal, frontal, and posterior cingulate cortices. A voxel in the left midfrontal gyrus showed the greatest decline over 1 year. These findings support previous studies showing that patients with Alzheimer’s disease have preferential and progressive metabolism reductions in parietal, temporal, prefrontal, and posterior cingulate brain regions (11). By using a voxel-based analysis, we were able to identify areas of maximal decline throughout the brain with greater regional specificity than has been described in longitudinal PET studies that have relied on relatively large regions of interest.
That we observed the most significant regional declines over the 1-year interval in the patients with Alzheimer’s disease when we applied absolute measures of glucose metabolism supports the value of quantitative PET for treatment studies in patients with dementia. In this study, we obtained quantitative measures of regional cerebral glucose metabolism with arterial blood sampling throughout the scan. Although full quantitation of PET has typically relied on this relatively invasive procedure, Chen et al. (29) reported a relatively noninvasive method (i.e., not requiring an arterial line) to obtain a highly accurate quantitation of regional cerebral glucose metabolism with PET, making the use of quantitative regional cerebral glucose metabolism to monitor decline over time practical for large treatment studies of dementia.
By applying power analysis of glucose metabolism assessed during a mental resting state, we estimated that as few as 24 patients with Alzheimer’s disease per active treatment and placebo group would be needed to detect a significant 33% treatment response with p≤0.05 (two-tailed) and 80% power for a voxel in the left midfrontal cortex. Using the more conservative significance threshold of p≤0.005 (one-tailed), we estimated that 36 subjects would be needed per group to detect the same 33% treatment response with 80% power. These sample sizes were far smaller than the number of patients required to detect the same treatment response with the MMSE, Mattis Dementia Rating Scale, and WAIS full-scale IQ, based on data obtained in the same patients with Alzheimer’s disease followed over the 1-year interval.
The MMSE has been used widely to evaluate treatment efficacy in dementia studies (13). Probably the most commonly used measure of general cognitive function in dementia treatment studies has been the cognitive subtest of the Alzheimer’s Disease Assessment Scale (30). Although this cognitive test was not administered to our patients with Alzheimer’s disease, a power calculation based on a previously published value by Marin et al. (31) for a 1-year rate of decline in 153 patients with Alzheimer’s disease and moderately severe dementia estimated that 171 patients per group would be needed to detect a similar 33% treatment response with p≤0.05 (two-tailed) and 80% power; this sample size is in the range of values found for the cognitive measures administered to our patients with Alzheimer’s disease.
In addition to findings in the left midfrontal cortex, significant declines in glucose metabolism were observed in the left inferior parietal, left midtemporal, and posterior cingulate cortices that produced sample size estimates ranging from 58 to 89 patients per group to identify the 33% treatment response with p≤0.05 (two-tailed) and 80% power. In contrast, it was estimated that using the global mean glucose metabolism value would require 179 patients per group to detect the same reduction of decline with treatment. These findings provide support for regional metabolic effects being more sensitive than global mean cerebral glucose metabolism in evaluating the progression of Alzheimer’s disease and highlight the regionally distributed heterogeneity in decline in glucose metabolism observed in Alzheimer’s disease. Thus, measurements in different brain regions may be more sensitive in detecting treatment effects over time and may be related to level of disease severity at baseline, age, or the interaction of disease severity and age.
Several PET studies have reported that cerebral hypometabolism in patients with Alzheimer’s disease is typically observed first in the parietotemporal brain regions and the posterior cingulate cortex, extending into the occipital association region and frontal cortex as the disease progresses. Our results show that the greatest decline over 1-year in patients with mildly to moderately severe dementia at baseline occurred in the frontal association regions, supporting the regional progression of Alzheimer’s disease from posterior to more anterior association brain regions over time.
A limitation of our study is the lack of healthy comparison subjects evaluated with FDG PET over the same time period as our patients with Alzheimer’s disease. Although declines in regional cerebral glucose metabolism could potentially occur in healthy aging over a 1-year interval, it is unlikely that the magnitude and extent of decline effects observed in our Alzheimer’s disease patients can be explained by aging alone. Further, the areas showing significant decline in the Alzheimer’s disease group were included in the brain regions that were hypometabolic compared with normal subjects at baseline.
Without longitudinal data for the healthy comparison subjects, we were not able to adjust the decline in regional cerebral glucose metabolism values for the effects of healthy aging in our power analyses. Thus, the treatment effects we report assume improvement to the level of no decline in the patients with Alzheimer’s disease, rather than to the level of decline that may occur in healthy aging. This may overestimate the treatment response if it is based on the assumption that the reduction of decline in patients with Alzheimer’s disease does not need to exceed the level that may be observed with aging (32). However, since the cerebral hypometabolism of Alzheimer’s disease can begin before the onset of clinical symptoms in individuals at genetic risk for Alzheimer’s disease (7, 33), such an assumption may not always be warranted.
We also did not make additional adjustments to the obtained sample sizes to account for potential patient attrition in treatment studies or loss of subjects attributable to poor PET data quality. These two factors could potentially increase the number of subjects needed for significant findings by 10% or 20%, depending on the type of treatment being evaluated and the PET scanning protocol used.
In a recent study by Fox et al. (32), power calculations were performed on serially subtracted whole brain MRI scans in a group of patients with Alzheimer’s disease whose level of dementia severity was similar to that of our patients with Alzheimer’s disease. Although Fox et al. reported estimated sample sizes that were adjusted for declines in healthy aging, patient dropout, and loss of data, their unadjusted results were compatible with our findings for regional cerebral glucose metabolism with FDG PET. Unlike whole brain subtraction MRI, PET assessed during mental rest provides information on the regional distribution of disease progression and, as a measure of neuronal function, may be better able to detect the earliest effects of Alzheimer’s disease, even before the onset of clinical symptoms (7).
Our results support the use of FDG PET during mental rest to aid in determining the longitudinal progression of pathophysiological effects of Alzheimer’s disease on a voxel-by-voxel basis and to evaluate therapies designed to slow the progression of Alzheimer’s disease over a 1-year period. Such in vivo functional brain imaging methods offer a complement to general cognitive tests in double-blind, placebo-controlled studies to evaluate treatments designed to attenuate progression of Alzheimer’s disease. Further, functional brain imaging may be useful in prevention studies for individuals at risk for dementia in the preclinical stage of Alzheimer’s disease (7, 33).
 |
 |
 |
Presented in part at the World Alzheimer Congress 2000, Washington, D.C., July 9–18, 2000. Received Nov. 1, 2000; revision received Sept. 28, 2001; accepted Oct. 8, 2001. From the Arizona Alzheimer’s Research Center; the Departments of Psychology and Mathematics, Arizona State University; Department of Psychiatry, University of Arizona, Tucson; Good Samaritan PET Center, Banner Health, Phoenix, Ariz.; the Department of Experimental Pathology, Medical Biotechnologies, Infectivology, and Epidemiology, University of Pisa, Italy; and the Brain Physiology and Metabolism Section, National Institute on Aging, National Institutes of Health, Bethesda, Md. Address reprint requests to Dr. Alexander, Department of Psychology, Arizona State University, Tempe, AZ 85287-1104; [email protected] (e-mail). Supported by the Arizona Department of Health Services; the Intramural Research Program, National Institute on Aging; and a grant from the Progetto Strategico Finalizzato sulla Malattia di Alzheimer 2000–Ministero della Sanità (Dr. Pietrini). The authors thank Dr. Mark B. Schapiro for supervision of clinical data acquisition, Dr. Satoshi Minoshima for suggestions in the analysis of the PET data, Dr. Leona S. Aiken for statistical comments and advice, and Ms. Diane Teichberg for assistance in preparing the PET data for analysis.

Figure 1. Brain Areas With Significantly Lower Glucose Metabolism at Baseline in 14 Patients With Alzheimer’s Disease Than in 34 Healthy Subjectsa
aVoxels with significantly lower metabolism in the patients (p<0.001, uncorrected for multiple comparisons) are shown in the orange color scale on lateral and medial projections for the right and left hemispheres. Lower metabolism in the patients was observed in the association cortex, including parietal, temporal, occipital, and frontal brain regions.

Figure 2. Brain Areas With Significant Decline in Glucose Metabolism From Baseline to 1-Year Follow-Up in 14 Patients With Alzheimer’s Diseasea
aVoxels with significantly reduced metabolism (p<0.005, uncorrected for multiple comparisons) are shown in the orange color scale on lateral and medial projections for the right and left hemispheres. Declines in metabolism over time were observed in parietal, temporal, and frontal association regions.
1. Frackowiak RSJ, Pozzilli C, Legg NJ, DuBoulay GH, Marshall J, Lenzi GL, Jones T: Regional cerebral oxygen supply and utilization in dementia: a clinical and physiological study with oxygen-15 and positron emission tomography. Brain 1981; 104:753-778Crossref, Medline, Google Scholar
2. de Leon MJ, Ferris SH, George AE, Reisberg B, Christman DR, Kricheff II, Wolf AP: Computed tomography and positron emission transaxial evaluations of normal aging and Alzheimer’s disease. J Cereb Blood Flow Metab 1983; 3:391-394Crossref, Medline, Google Scholar
3. Duara R, Grady CL, Haxby JV, Sundaram M, Cutler NR, Heston L, Moore AM, Schlageter NL, Larson S, Rapoport SI: Positron emission tomography in Alzheimer’s disease. Neurology 1986; 36:879-887Crossref, Medline, Google Scholar
4. Ibanez V, Pietrini P, Alexander GE, Furey ML, Teichberg D, Rajapakse JC, Rapoport SI, Schapiro MB, Horwitz B: Abnormal metabolic patterns in Alzheimer’s disease after correction for partial volume effects. Neurology 1998; 50:1585-1593Crossref, Medline, Google Scholar
5. Pietrini P, Alexander GE, Furey ML, Hampel H, Guazzelli M: The neurometabolic landscape of cognitive decline: in vivo studies with positron emission tomography in Alzheimer’s disease. Int J Psychophysiol 2000; 37:87-98Crossref, Medline, Google Scholar
6. Minoshima S, Giordani B, Berent S, Frey KA, Foster NL, Kuhl DE: Metabolic reduction in the posterior cingulate cortex in very early Alzheimer’s disease. Ann Neurol 1997; 42:85-94Crossref, Medline, Google Scholar
7. Reiman EM, Caselli RJ, Yun LS, Chen K, Bandy D, Minoshima S, Thibodeau SN, Osborne D: Preclinical evidence of a genetic risk factor for Alzheimer’s disease in apolipoprotein E type 4 homozygotes using positron emission tomography. N Engl J Med 1996; 334:752-758Crossref, Medline, Google Scholar
8. Jagust WJ, Friedland RP, Budinger TF, Koss E, Ober B: Longitudinal studies of regional cerebral metabolism in Alzheimer’s disease. Neurology 1988; 38:909-912Crossref, Medline, Google Scholar
9. Haxby JV, Grady CL, Koss E, Horwitz B, Heston L, Schapiro M, Friedland RP, Rapoport SI: Longitudinal study of cerebral metabolic asymmetries and associated neuropsychological patterns in early dementia of the Alzheimer type. Arch Neurol 1990; 47:753-760Crossref, Medline, Google Scholar
10. McGeer EG, Peppard RP, McGeer PL, Tuokko H, Crockett D, Parks R, Akiyama H, Calne DB, Beattie BL, Harrop R: 18Fluorodeoxyglucose positron emission tomography studies in presumed Alzheimer cases, including 13 serial scans. Can J Neurol Sci 1990; 17:1-11Medline, Google Scholar
11. Smith GS, de Leon MJ, George AE, Kluger A, Volkow ND, McRae T, Golomb J, Ferris SH, Reisberg B, Ciaravino J, La Regina ME: Topography of cross-sectional and longitudinal glucose metabolic deficits in Alzheimer’s disease: pathophysiologic implications. Arch Neurol 1992; 49:1142-1150Crossref, Medline, Google Scholar
12. Reisberg B, Schneider L, Doody R, Anand R, Feldman H, Haraguchi H, Kumar R, Lucca U, Mangone CA, Mohr E, Morris JC, Rogers S, Sawada T: Clinical global measures of dementia: position paper from the International Work Group on Harmonization of Dementia Drug Guidelines. Alzheimer Dis Assoc Disord 1997; 11(suppl 3):8-18Google Scholar
13. Rogers SL, Farlow MR, Doody RS, Mohs R, Friedhoff LT: A 24-week, double-blind, placebo-controlled trial of donepezil in patients with Alzheimer’s disease. Neurology 1998; 50:136-145Crossref, Medline, Google Scholar
14. Small GW, Ercoli L, Silverman DHS, Huang SC, Komo S, Bookheimer SY, Lavretsky H, Miller K, Siddarth P, Rasgon NL, Mazziotta JC, Saxena S, Wu HM, Mega MS, Cummings JL, Saunders AM, Pericak-Vance MA, Roses AD, Barrio JR, Phelps ME: Cerebral metabolic and cognitive decline in persons at genetic risk for Alzheimer’s disease. Proc Natl Acad Sci USA 2000; 97:6037-6042Crossref, Medline, Google Scholar
15. Reiman ER, Caselli RJ, Chen K, Alexander GE, Bandy D, Frost J: Declining brain activity in cognitively normal apolipoprotein E e4 heterozygotes: a foundation for using positron emission tomography to efficiently test treatments to prevent Alzheimer’s disease. Proc Natl Acad Sci USA 2001; 98:3334-3339Crossref, Medline, Google Scholar
16. McKhann G, Drachman D, Folstein M, Katzman R, Price D, Stadlan EM: Clinical diagnosis of Alzheimer’s disease: report of the NINCDS-ADRDA Work Group under the auspices of the Department of Health and Human Services Task Force on Alzheimer’s Disease. Neurology 1984; 34:939-944Crossref, Medline, Google Scholar
17. Folstein MF, Folstein SE, McHugh PR: “Mini-Mental State”: a practical method for grading the cognitive state of patients for the clinician. J Psychiatr Res 1975; 12:189-198Crossref, Medline, Google Scholar
18. Alexander GE, Furey ML, Grady CL, Pietrini P, Brady DR, Mentis MJ, Schapiro MB: Association of premorbid intellectual function with cerebral metabolism in Alzheimer’s disease: implications for the cognitive reserve hypothesis. Am J Psychiatry 1997; 154:165-172Link, Google Scholar
19. Mattis S: Mental status examination for organic mental syndrome in the elderly patient, in Geriatric Psychiatry: A Handbook for Psychiatrists and Primary Care Physicians. Edited by Bellak L, Karasu TB. New York, Grune & Stratton, 1976, pp 77-121Google Scholar
20. Wechsler DA: Wechsler Adult Intelligence Scale. New York, Psychological Corp, 1955Google Scholar
21. Haxby JV, Raffaele K, Gillette J, Schapiro MB, Rapoport SI: Individual trajectories of cognitive decline in patients with dementia of the Alzheimer type. J Clin Exp Neuropsychol 1992; 14:575-592Crossref, Medline, Google Scholar
22. Brooks RA: Alternative formula for glucose utilization using labeled deoxyglucose. J Nucl Med 1982; 23:538-539Medline, Google Scholar
23. Sokoloff L, Reivich M, Kennedy C, Des Rosiers MH, Patlak CS, Pettigrew KD, Sakurada O, Shinohara M: The (14C)-deoxyglucose method for the measurement of local cerebral glucose utilization: theory, procedure and normal values in the conscious and anesthetized albino rat. J Neurochem 1977; 28:897-916Crossref, Medline, Google Scholar
24. Talairach J, Tournoux P: Co-Planar Stereotaxic Atlas of the Human Brain: Three-Dimensional Proportional System. Stuttgart, Germany, Georg Thieme, 1988Google Scholar
25. Friston KJ: Commentary and opinion, II: statistical parametric mapping: ontology and current issues. J Cereb Blood Flow Metab 1995; 15:361-370Crossref, Medline, Google Scholar
26. Minoshima S, Frey KA, Foster NL, Kuhl DE: Preserved pontine glucose metabolism in Alzheimer’s disease: a reference region for functional brain (PET) analysis. J Comput Assist Tomogr 1995; 19:541-547Crossref, Medline, Google Scholar
27. Erdfelder E, Faul F, Buchner A: G Power: a general power analysis program. Behav Res Methods Instrum Comput 1996; 28:1-11Crossref, Google Scholar
28. Hedges LV, Olkin I: Statistical Methods for Meta-Analysis. New York, Academic Press, 1985Google Scholar
29. Chen K, Bandy D, Reiman E, Huang SC, Lawson M, Feng D, Yun LS, Palant A: Noninvasive quantification of the cerebral metabolic rate for glucose using positron emission tomography, 18F-fluoro-2-deoxyglucose, the Patlak method, and an image-derived input function. J Cereb Blood Flow Metab 1998; 18:716-723Crossref, Medline, Google Scholar
30. Rosen WG, Mohs RC, Davis KL: A new rating scale for Alzheimer’s disease. Am J Psychiatry 1984; 141:1356-1364Link, Google Scholar
31. Marin DB, Green CR, Schmeidler J, Harvey PD, Lawlor BA, Ryan TM, Aryan M, Davis KL, Mohs RC: Noncognitive disturbances in Alzheimer’s disease: frequency, longitudinal course, and relationship to cognitive symptoms. J Am Geriatr Soc 1997; 48:1331-1338Google Scholar
32. Fox NC, Cousens S, Scahill R, Harvey RJ, Rossor MN: Using serial registered brain magnetic resonance imaging to measure disease progression in Alzheimer disease: power calculations and estimates of sample size to detect treatment effects. Arch Neurol 2000; 57:339-344Crossref, Medline, Google Scholar
33. Pietrini P, Dani A, Furey ML, Alexander GE, Freo U, Grady CL, Mentis MJ, Mangot D, Simon EW, Horwitz B, Haxby JV, Schapiro MB: Low glucose metabolism during brain stimulation in older Down’s syndrome subjects at risk for Alzheimer’s disease prior to dementia. Am J Psychiatry 1997; 154:1063-1069Link, Google Scholar