Genetics of Recurrent Early-Onset Major Depression (GenRED): Significant Linkage on Chromosome 15q25-q26 After Fine Mapping With Single Nucleotide Polymorphism Markers
Abstract
Objective: The authors studied a dense map of single nucleotide polymorphism (SNP) DNA markers on chromosome 15q25-q26 to maximize the informativeness of genetic linkage analyses in a region where they previously reported suggestive evidence for linkage of recurrent early-onset major depressive disorder. Method: In 631 European-ancestry families with multiple cases of recurrent early-onset major depressive disorder, 88 SNPs were genotyped, and multipoint allele-sharing linkage analyses were carried out. Marker-marker linkage disequilibrium was minimized, and a simulation study with founder haplotypes from these families suggested that linkage scores were not inflated by linkage disequilibrium. Results: The dense SNP map increased the information content of the analysis from around 0.7 to over 0.9. The maximum evidence for linkage was the Z likelihood ratio score statistic of Kong and Cox (Z LR )=4.69 at 109.8 cM. The exact p value was below the genomewide significance threshold. By contrast, in the genome scan with microsatellite markers at 9 cM spacing, the maximum Z LR for European-ancestry families was 3.43 (106.53 cM). It was estimated that the linked locus or loci in this region might account for a 20% or less populationwide increase in risk to siblings of cases. Conclusions: This region has produced modestly positive evidence for linkage to depression and related traits in other studies. These results suggest that DNA sequence variations in one or more genes in the 15q25-q26 region can increase susceptibility to major depression and that efforts are warranted to identify these genes.
In the preceding article (1) , we reported on a genome scan of 656 families with two or more genotyped cases of recurrent early-onset major depressive disorder with a map of microsatellite DNA markers (short tandem repeat polymorphisms) at an average spacing of 9 cM. In the primary analysis, the greatest evidence for linkage was observed on chromosome 15q25-q26 with a Z likelihood ratio score statistic of Kong and Cox (Z LR ) (2) of 3.05 (Kong-Cox lod score of 2.02), with 0.81 false positive peaks of this size expected per genome scan (“suggestive” linkage). In the 631 families of predominantly European self-reported ancestry, the maximum result was a Z LR of 3.43 (0.27 expected false positives). We have now detected genomewide significant evidence for linkage in this region in European families in a fine-mapping analysis with 88 single nucleotide polymorphisms (SNPs) spanning 45 centimorgans (cM) around the previous peak.
Method
Subjects
Ascertainment and assessment methods have been described previously (1 , 3) . Briefly, families were ascertained at six sites through a proband with recurrent major depressive disorder (or one episode lasting 3 or more years), with age at onset before age 31 in probands and before 41 in relatives and at least one episode persisting beyond age 18. The families were extended through first-degree relationships to other affected relatives. After complete description of the study to each subject, written informed consent was obtained under protocols approved by institutional review boards. Cases were interviewed with the Diagnostic Interview for Genetic Studies 3.0 and the Family Interview for Genetics Studies ( 4 ; http://zork.wustl.edu/nimh). DSM-IV diagnoses (5) were assigned by consensus of two independent research clinicians based on information from the Diagnostic Interview for Genetic Studies, the Family Interview for Genetic Studies, and any available psychiatric treatment records.
Selection and Genotyping of the Linkage Fine Map
A 22.5-megabase region of chromosome 15q was selected for fine-mapping analysis spanning 77.55 to 100.08 megabase (National Center for Biotechnology Information build 34). A linkage fine map of 88 single nucleotide markers was developed as follows. Five sites participated in the beta test of the Illumina SNP genotyping platform of the Center for Inherited Disease Research, which produced genotypes for 837 15q SNP markers in the European families from the genome scan set, with BeadArray methods as previously described (6 – 8) . Several SNPs in each megabase interval had high minor allele frequencies in Europeans to maximize information for linkage analysis. Additional SNPs were selected for linkage disequilibrium association mapping studies of the region, which will not be presented here because additional subject recruitment and genotyping are ongoing.
Multipoint linkage scores can be inflated when parents are not genotyped and there is substantial linkage disequilibrium between markers (9 – 13) . No standard approach was available for this problem. We previously reported that even low levels of linkage disequilibrium could inflate linkage scores: for data sets simulated with no linkage present and with most parents ungenotyped, the threshold for 5% false positives without marker-marker linkage disequilibrium produced 6.25% false positives if r 2 between all adjacent SNPs was 0.10 (13) . Therefore, we selected SNPs with no marker-marker r 2 value greater than 0.05. Average marker spacing was 0.5 cM.
To establish genetic locations of SNPs, a framework map (of approximately 1 cM spacing) was selected and recombination distances analyzed with CRIMAP (14) in the beta test families with genotypes available for cases and both parents (or one parent and one unaffected sibling). This map included 36 SNPs and six short tandem repeat polymorphisms from the genome scan (D15S655, D15S652, D15S816, D15S657, D15S966, and D15S642), which were genotyped at the Center for Inherited Disease Research (http://www.cidr.jhmi.edu), as previously described (1) . The total genetic distances were comparable for the CRIMAP estimates with the short tandem repeat polymorphisms alone (37.65 cM) or including the 36 SNPs (45.38 cM) and for the distance between D15S655 and D15S642 (45.38 cM) on the deCODE map (15) . Thus the genetic distance was about twice the physical distance, although the megabase:cM ratio varied across the region (National Center for Biotechnology Information build 34, http://www.ncbi.nlm.nih.gov/). The locations of other SNP markers were interpolated onto this map (ORIGIN PRO 7) based on physical distance and megabase:cM ratio (average of three intervals). A map of 226 SNPs was reduced to 115 by removing markers in several steps based on the HAPLOVIEW analysis of marker-marker linkage disequilibrium (16) in 540 unrelated individuals until no pairwise r 2 value was greater than 0.05. Marker-marker distances from the CRIMAP analysis were then used to infer absolute deCODE map locations for SNPs based on known single tandem repeat polymorphism locations.
DNA specimens for European subjects from the sixth site (University of Pittsburgh) were then obtained from the publicly available set of GenRED biomaterials (http://zork.wustl.edu/nimh) and genotyped at Columbia University with the SNPlex method (17) by using an ABI 3730xl sequencer. To determine cross-platform concordance, 48 subjects were included who had been genotyped with BeadArray methods at the Center for Inherited Disease Research. Based on SNPlex algorithms for probe and pool design, 95 SNPs in two pools were selected, 92 were successfully genotyped, and four were excluded because of pairwise r 2 values greater than 0.05 in the full sample, resulting in a final map of 88 SNPs with a mean minor allele frequency of 0.42 (range=0.167–0.499). Markers and locations are listed in data supplement Table 1 and Table 2 (available at http://ajp.psychiatryonline.org).
Error Checking
Pedigree structure errors (18 , 19) and likely genotyping errors (20) were detected as previously described (1) . For all SNPs genotyped by BeadArray methods in 1,794 subjects, the call rate was 99.89% (99.9% for the 88 SNPs used here), with a Mendelian inconsistency rate of 0.04%. For SNPlex genotyping, the call rate in 372 subjects was 99.84%, with 0.056% Mendelian inconsistencies (23 errors in 41,322 genotypes) detected before data cleaning. Six subjects were then excluded because of low call rates or because of multiple Mendelian errors suggesting sample swaps. After cleaning, there were seven Mendelian errors detected in 38,860 genotypes (0.018%), although it is likely that most inconsistencies would not be detected in these incomplete families. For 91 SNPs genotyped by both methods in 48 individuals (4,368 genotypes), there were two discordancies, plus two BeadArray no calls and one SNPlex no call. Therefore, two of 4,365 genotypes (0.05%) were discordant (average estimated error rate of 0.025% for each of the two methods).
Linkage Analysis
Multipoint linkage analysis was carried out with ALLEGRO (21) with the Z LR to test for an excess of allele sharing in all possible informative affected relative pairs, i.e., all genotyped pairs of affected relatives in a family except parent-child pairs who do not contain information for linkage (because children inherit one allele from each parent in any case). This statistic requires using some weighting function to account for differences in family size and nonindependence of some pairs (e.g., allele sharing between siblings one and three can be predicted by the sharing between siblings one and two and between siblings two and three). Here the families were weighted by the square root of the standard deviation of their score function under the null hypothesis of no linkage, i.e., approximately midway between equal weighting for each pair versus for each family (22) .
Information content was evaluated with ALLEGRO’s exponential measure (23) . This measure is more sensitive to the marker map (“What would be gained by genotyping more or better markers, given the DNA specimens that are available?”), whereas the entropy measure of GENEHUNTER (24) and MERLIN (25) is sensitive both to marker informativeness and to the proportion of genotyped parents (“What would be gained by genotyping more people and/or using a better map?”). This is because the entropy measure reaches 1 only when the entire inheritance vector can be determined with certainty (including the parental origin of each allele), whereas the exponential measure depends only on the certainty with which it can be determined how many alleles have been inherited identical by descent by both members of a given pair, which often does not depend on knowing which parent transmitted which allele. Thus, the exponential measure can determine whether identical-by-descent allele-sharing analyses have achieved near-maximal informativeness given the available subjects.
When information is low, the p values computed by allele-sharing programs may be conservative because of violations of the assumed distribution, but with average information content of greater than 90% in the present analyses, we used ALLEGRO’s exact p values rather than attempting to estimate genomewide significance empirically based on a map of a small region. A p£0.00002 was considered evidence of genomewide significant linkage (26) .
HaploSim Analysis of the Effects of Marker-Marker Linkage Disequilibrium
The effects of marker-marker linkage disequilibrium on linkage scores was evaluated with the HaploSim haplotype-based simulation method (12) . SIM (27) was used to generate 100 replicate data sets of 94 markers in 116 families (two affected siblings and two parents), with genetic locations and allele frequencies identical to the 88 SNPs and six short tandem repeat polymorphisms from the present study (including the short tandem repeat polymorphisms as a “worst case” scenario), assuming no linkage. Two unique allele numbers were assigned to each founder for each marker. Linkage analysis (ALLEGRO) using these “original alleles” reflected full identical-by-descent information. Then each parent was assigned two of 464 founder haplotypes inferred from the present data (ALLEGRO), the appropriate recoded parental alleles were assigned to each offspring, parental genotypes were set to zero, and the Z LR was recomputed for each replicate. The HaploSim curve in Figure 1 shows, for each point, the mean difference (across 100 replicates) of the Z LR for the full identical-by-descent analysis subtracted from the score for the recoded analysis. We previously demonstrated (13) that in regions of high marker-marker linkage disequilibrium, peaks of positive differences are observed.

a Shown are Z likelihood ratio score statistics of Kong and Cox from analyses of linkage of recurrent early-onset major depression to 88 chromosome 15q single nucleotide polymorphisms in 631 families of predominantly European ancestry for wave 1, wave 2, and all families and for information content. Relative locations were inferred from a subset of families (see text) and span from 77.55 to 100.07 megabase on the physical map (build 34, see megabase locations on graph) and 85.2 to 133.6 cM on the deCODE genetic map. See Table 2 for additional details. Also shown are results of HaploSim analysis (see text) demonstrating the absence of any systematic bias in the multipoint analysis due to linkage disequilibrium.
Results
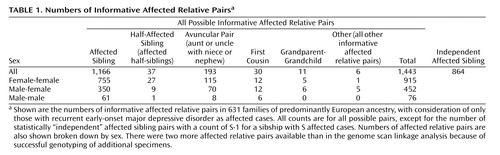
The data set included genotypes from 2,161 European individuals, including 1,687 with diagnoses of recurrent early-onset major depressive disorder and 474 coded as “diagnosis unknown.” Table 1 shows the numbers of each type of informative affected relative pair. There were 1,443 affected relative pairs, counting all possible pairs, with 864 “independent” affected sibling pairs.
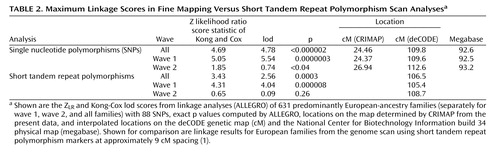
Figure 1 illustrates the linkage analysis results, and Table 2 lists the maximum results. A maximum Z LR of 4.69 (equivalent Kong-Cox lod score of 4.78) was observed at 109.8 cM (92.6 megabase), with an exact p=0.0000014, representing highly significant genomewide evidence for linkage. Significant linkage was still observed after removal of each of the two markers (at 24.27 and 24.59 cM on the map of this interval) closest to the peak score (maximum Z LR of 4.62, p=0.000002, and 4.49, p=0.000004, respectively). For the five markers closest to the peak score, the distances between the adjacent markers were 0.147–0.308 megabase, with pairwise r 2 values from 0.00 to 0.01. Analyzed separately, wave 1 families produced strong evidence for linkage (p=0.0000003), and wave 2 families produced nominally significant evidence for linkage (p<0.04). Mean information content values were 0.919 (entire region) and 0.938 (one lod support region around the linkage peak). Table 2 also shows results from the genome scan in this region, where the average information content in the 30 cM surrounding the linkage peak was 0.712.
The HaploSim analysis revealed small average (0.04) and maximum (0.13) differences between the full identical-by-descent and recoded replicates. At 24.37 cM (the location of the peak score), the mean difference was 0.049.
Discussion
Linkage fine mapping has demonstrated highly significant genomewide evidence for linkage to recurrent early-onset major depression on chromosome 15q25-q26. Therefore, it is likely that there are DNA sequence variations in one or more genes in this region that increase susceptibility to major depression. Further study is required to identify these variations and to elucidate their pathophysiological role. We refrain from speculating on possible candidate genes in the region until systematic association data are available from a larger data set because there are many diverse but unproven hypotheses about the physiological mechanisms that might contribute to depression susceptibility. There is some support for linkage of major depressive disorder on chromosome 15q in two other studies: Camp et al. (28) observed their strongest evidence for linkage in men at approximately 121 deCODE cM (LOD=2.88, without correction for multiple tests), 12.4 cM from the extrapolated peak location in our fine-mapping analysis (109.6 cM); and McGuffin et al. (29) observed their fifth-largest peak in their primary analysis, at 88.2 deCODE cM (LOD=1.14). Meta-analysis or combined analysis would be necessary to determine whether statistically significant evidence for linkage is observed across studies.
We note one possible source of bias. The a priori primary analysis was the ALLEGRO analysis of all families. The fine-mapping study included only European families because there were too few non-European families to include in ongoing association (linkage disequilibrium mapping) studies. Because we knew before the fine-mapping study that evidence for linkage on 15q in the short tandem repeat polymorphism genome scan was stronger in European families, we would not have accepted as significant a fine-mapping result that barely reached the genomewide threshold of p<0.00002. But the final empirical p value of <0.000002 was lower than that threshold by an order of magnitude, and therefore, we interpret it as highly significant.
Although the combined analysis was primary, we analyzed wave 1 and wave 2 separately because we had reported on wave 1 families in a published preliminary analysis (30) , and most of the evidence for linkage in the genome scan came from wave 1 families (1) . Although the study was not designed as a formal internal test of “replication” because the group size of each wave was too small to detect linkage reliably for loci with small effects, it is reassuring that fine mapping increased the evidence for linkage in wave 2 families, with a nominal p < 0.05. We interpret the results as being consistent with the findings of Göring et al. (31) that in smaller data sets, inflated evidence for linkage can be observed for loci with small genetic effects and that when this occurs, subsequent data sets will produce weaker findings, with combined analyses or very large data sets converging toward the true effect size.
To examine this issue further, we estimated the locus-specific increase in relative risk to siblings of affected cases versus population risk (λ siblings ) attributable to the 15q locus. The pedigrees were broken into nuclear families, and GENEHUNTER 2.1 (24) was used to estimate the mean identical-by-descent sharing proportion at each map position in affected sibling pairs. Our primary analysis used all types of affected relative pairs, but affected sibling pairs are useful here because under the assumption of a single locus underlying the linkage signal (which may not be the case), locus-specific λ siblings can be estimated approximately as 0.25/z 0 , where z 0 is the proportion of affected sibling pairs sharing 0 alleles identical by descent (32) . (More accurate estimation of λ siblings requires modeling of the ascertainment scheme [33] , but failure to correct for ascertainment often introduces only a small bias [34] .) The estimates of z 0 in wave 1, wave 2, and all families were 0.181, 0.223, and 0.2059, respectively, resulting in λ siblings estimates of 1.38, 1.12, and 1.21. If the true value was as high as 1.38, our power analyses (3) suggest that strong evidence for linkage would probably be observed in most or all major depressive disorder linkage data sets of reasonable size (including our wave 2 subgroup), and this has not been the case (see reference 1 for a review). Thus, the extremely positive wave 1 result is likely to be an inflated estimate (31) , with the true locus-specific λ siblings on 15q likely to be closer to the value of 1.21 observed in the full group or less.
Therefore, we consider our findings to be consistent with a major depressive disorder susceptibility locus on chromosome 15q25-q26 that increases risk to siblings by around 20% or less. Alternatively, there could be several susceptibility loci in the region with smaller effects. It may be possible to confirm this linkage with combined analysis or meta-analysis of multiple major depressive disorder groups and to identify the susceptibility gene or genes through genetic association studies in large groups of informative families or of cases and comparison subjects.
1. Holmans P, Weissman MM, Zubenko GS, Scheftner WA, Crowe RR, DePaulo JR Jr, Knowles JA, Zubenko WN, Murphy-Eberenz K, Marta DH, Boutelle S, McInnis MG, Adams P, Gladis M, Thomas J, Chellis J, Miller E, Potash JB, MacKinnon D, Levinson DF: Genetics of recurrent early-onset major depression (GenRED): final genome scan report. Am J Psychiatry 2007; 164:236–245Google Scholar
2. Kong A, Cox NJ: Allelle-sharing models: lod scores and accurate linkage tests. Am J Hum Genet 1997; 61:1179–1188Google Scholar
3. Levinson DF, Zubenko GS, Crowe RR, DePaulo JR, Scheftner WS, Weissman MM, Holmans P, Zubenko WN, Boutelle S, Murphy-Eberenz K, MacKinnon D, McInnis MG, Marta DH, Adams P, Sassoon S, Knowles JA, Thomas J, Chellis J: Genetics of recurrent early-onset depression (GenRED): design and preliminary clinical characteristics of a repository sample for genetic linkage studies. Am J Med Genet 2003; 119B:118–130Google Scholar
4. Nurnberger JI Jr, Blehar MC, Kaufmann CA, York-Cooler C, Simpson SG, Harkavy-Friedman J, Severe JB, Malaspina D, Reich T: Diagnostic interview for genetic studies: rationale, unique features, and training. Arch Gen Psychiatry 1994; 51:849–859Google Scholar
5. American Psychiatric Association: Diagnostic and Statistical Manual of Mental Disorders, 4th ed. Washington, DC, American Psychiatric Press, 1994Google Scholar
6. Oliphant A, Barker DL, Stuelpnagel JR, Chee MS: Beadarray technology: enabling an accurate, cost-effective approach to high-throughput genotyping. Biotechniques 2002; 32(suppl):S48–S54Google Scholar
7. Gunderson KL, Kruglyak S, Graige MS, Garcia F, Kermani BG, Zhao C, Che D, Dickinson T, Wickham E, Bierle J, Doucet D, Milewski M, Yang R, Siegmund C, Haas J, Zhou L, Oliphant A, Fan JB, Barnard S, Chee MS: Decoding randomly ordered DNA arrays. Genome Res 2004; 14:870–877Google Scholar
8. Gunderson KL, Steemers FJ, Lee G, Mendoza LG, Chee MS: A genome-wide scalable SNP genotyping assay using microarray technology. Nat Genet 2005; 37:549–554Google Scholar
9. Evans DM, Cardon LR: Guidelines for genotyping in genomewide linkage studies: single-nucleotide-polymorphism maps versus microsatellite maps. Am J Hum Genet 2004; 75:687–692Google Scholar
10. Huang Q, Shete S, Amos CI: Ignoring linkage disequilibrium among tightly linked markers induces false-positive evidence of linkage for affected sib pair analysis. Am J Hum Genet 2004; 75:1106–1112Google Scholar
11. John S, Shephard N, Liu G, Zeggini E, Cao M, Chen W, Vasavda N, Mills T, Barton A, Hinks A, Eyre S, Jones KW, Ollier W, Silman A, Gibson N, Worthington J, Kennedy GC: Whole-genome scan, in a complex disease, using 11,245 single-nucleotide polymorphisms: comparison with microsatellites. Am J Hum Genet 2004; 75:54–64Google Scholar
12. Schaid DJ, Guenther JC, Christensen GB, Hebbring S, Rosenow C, Hilker CA, McDonnell SK, Cunningham JM, Slager SL, Blute ML, Thibodeau SN: Comparison of microsatellites versus single-nucleotide polymorphisms in a genome linkage screen for prostate cancer-susceptibility loci. Am J Hum Genet 2004; 75:948–965Google Scholar
13. Levinson DF, Holmans P: The effect of linkage disequilibrium on linkage analysis of incomplete pedigrees. BMC Genet 2005; 30(suppl 1):S6Google Scholar
14. Green P: Construction and comparison of chromosome 21 radiation hybrid and linkage maps using CRI-MAP. Cytogenet Cell Genet 1992; 59:122–124Google Scholar
15. Kong A, Gudbjartsson DF, Sainz J, Jonsdottir GM, Gudjonsson SA, Richardsson B, Sigurdardottir S, Barnard J, Hallbeck B, Masson G, Shlien A, Palsson ST, Frigge ML, Thorgeirsson TE, Gulcher JR, Stefansson K: A high-resolution recombination map of the human genome. Nat Genet 2002; 31:241–247Google Scholar
16. Barrett JC, Fry B, Maller J, Daly MJ: Haploview: analysis and visualization of LD and haplotype maps. Bioinformatics 2005; 21:263–265Google Scholar
17. De la Vega FM, Lazaruk KD, Rhodes MD, Wenz MH: Assessment of two flexible and compatible SNP genotyping platforms: taqman SNP genotyping assays and the snplex genotyping system. Mutat Res 2005; 573:111–135Google Scholar
18. O’Connell JR, Weeks DE: Pedcheck: a program for identification of genotype incompatibilities in linkage analysis. Am J Hum Genet 1998; 63:259–266Google Scholar
19. Boehnke M, Cox NJ: Accurate inference of relationships in sib-pair linkage studies. Am J Hum Genet 1997; 61:423–429Google Scholar
20. Douglas JA, Boehnke M, Lange K: A multipoint method for detecting genotyping errors and mutations in sibling-pair linkage data. Am J Hum Genet 2000; 66:1287–1297Google Scholar
21. Gudbjartsson DF, Jonasson K, Frigge ML, Kong A: ALLEGRO, a new computer program for multipoint linkage analysis. Nat Genet 2000; 25:12–13Google Scholar
22. Gudbjartsson DF, Jonasson K, Frigge ML, Kong A: Fast Multipoint Linkage Analysis and the Program ALLEGRO (Allegro technical report number). Reykjavik, Iceland, DeCode Genetics, 2000Google Scholar
23. Nicolae DL, Kong A: Measuring the relative information in allele-sharing linkage studies. Biometrics 2004; 60:368–375Google Scholar
24. Kruglyak L, Daly MJ, Reeve-Daly MP, Lander ES: Parametric and nonparametric linkage analysis: a unified multipoint approach. Am J Hum Genet 1996; 58:1347–1363Google Scholar
25. Abecasis GR, Cherny SS, Cookson WOC, Cardon LR: Merlin—rapid analysis of dense genetic maps using sparse gene flow trees. Nat Genet 2002; 30:97–101Google Scholar
26. Lander E, Kruglyak L: Genetic dissection of complex traits: guidelines for interpreting and reporting linkage results. Nat Genet 1995; 11:241–247Google Scholar
27. Levinson DF, Kirby A, Slepner S, Nolte I, Spijker GT, Meerman G: Simulation studies of detection of a complex disease in a partially isolated population. Am J Med Genet 2001; 105:65–70Google Scholar
28. Camp NJ, Lowry MR, Richards RL, Plenk AM, Carter C, Hensel CH, Abkevich V, Skolnick MH, Shattuck D, Rowe KG, Hughes DC, Cannon-Albright LA: Genome-wide linkage analyses of extended Utah pedigrees identifies loci that influence recurrent, early-onset major depression and anxiety disorders. Am J Med Genet B Neuropsychiatr Genet 2005; 135:85–93Google Scholar
29. McGuffin P, Knight J, Breen G, Brewster S, Boyd PR, Craddock N, Gill M, Korszun A, Maier W, Middleton L, Mors O, Owen MJ, Perry J, Preisig M, Reich T, Rice J, Rietschel M, Jones L, Sham P, Farmer AE: Whole genome linkage scan of recurrent depressive disorder from the depression network (DeNt) study. Hum Mol Genet 2005; 14:3337–3345Google Scholar
30. Holmans P, Zubenko GS, Crowe RR, DePaulo JR Jr, Scheftner WA, Weissman MM, Zubenko WN, Boutelle S, Murphy-Eberenz K, MacKinnon D, McInnis MG, Marta DH, Adams P, Knowles JA, Gladis M, Thomas J, Chellis J, Miller E, Levinson DF: Genomewide significant linkage to recurrent, early-onset major depressive disorder on chromosome 15q. Am J Hum Genet 2004; 74:1154–1167Google Scholar
31. Göring HH, Terwilliger JD, Blangero J: Large upward bias in estimation of locus-specific effects from genomewide scans. Am J Med Genet B Neuropsychiatr Genet 2001; 69:1357–1369Google Scholar
32. Risch N: Linkage strategies for genetically complex traits, I: multilocus models. Am J Hum Genet 1990; 46:222–228Google Scholar
33. Olson JM, Cordell HJ: Ascertainment bias in the estimation of sibling genetic risk parameters. Genet Epidemiol 2000; 18:217–235Google Scholar
34. Cordell HJ, Olson JM: Correcting for ascertainment bias of relative-risk estimates obtained using affected-sib-pair linkage data. Genet Epidemiol 2000;18:307–321Google Scholar