Instability of Prefrontal Signal Processing in Schizophrenia
Abstract
Objective: Prefrontal dysfunction is considered a fundamental characteristic of schizophrenia. Recent electrophysiological evidence points to a major instability of signal processing in prefrontal cortical microcircuits because of reduced phase-synchronization (i.e., an increased stimulus-related variability [noise] of single-trial responses in the spatial and time domain). The authors used functional magnetic resonance imaging (fMRI) during a visual two-choice reaction task in order to measure, with higher topographic accuracy, signal stability in patients with schizophrenia and its relationship to more traditional measures of activation. Method: Twelve clinically stable inpatients with schizophrenia and 16 matched comparison subjects were evaluated. Event-related blood-oxygen-level-dependent responses were subjected to an analysis of residual noise variance and to independent data dimension independent component analysis in the medial prefrontal cortex. Results: In patients with schizophrenia, the authors found increased residual noise variance of the blood-oxygen-level-dependent response that predicted the level of prefrontal activation in these subjects. In the left hemisphere, residual noise variance strongly correlated with psychotic symptoms. Independent component analysis revealed a “fractionized” and unfocussed pattern of activation in patients. Conclusions: These findings suggest that unstable cortical signal processing underlies classic abnormal cortical activation patterns as well as psychosis in schizophrenia.
In schizophrenia, reduced prefrontal cortex activation has been frequently observed with functional neuroimaging and electrophysiology (1 – 10) . However, several recent functional neuroimaging and electrophysiological studies of relatively high-functioning patients either failed to find prefrontal hypoactivation (11 , 12) or reported the opposite observation (i.e., hyperactivation) (13 – 17) . Based on these findings, it has been proposed that activation patterns in schizophrenia are, in part, related to a patient’s ability to compensate an underlying, more intrinsic abnormality in information processing (15 , 18 , 19) .
In previous event-related electrophysiological studies, we have obtained evidence that the underlying pathophysiology of abnormal prefrontal activation in schizophrenia is a less stable cortical signal with a lack of stimulus-related phase-synchronization of the electromagnetic activity. We observed diminished spatial activity correlations (fragmentation) (20) and increased single-trial response variability (noise) in the prefrontal lobe area (8 , 17 , 21) . Notably, noise was positively correlated with the averaged potential prefrontal activation in a hyper frontal cohort, while negative correlation was found with the same noise measure in another hypo frontal group of patients with schizophrenia. This suggests that increased noise might be a core deficit in cortical microcircuit function that can be represented as various activation patterns. Based on the notion that phase-synchronization of neuronal activity is a fundamental mechanism for amplifying cortical signals that are related to task-relevant processes (22 – 26) , we speculated that increased noise and instability or fragmentation of cortical signals in schizophrenia reflects poor neuronal synchronization of local microcircuit field potentials (i.e., an uncoupling of cortical oscillators, which leads secondarily to local activation abnormalities) (20) .
This functional MRI (fMRI) study was designed to extend our previous electrophysiological findings and test the hypothesis that prefrontal signal instability in schizophrenia is observable on the level of the blood-oxygen-level-dependent response despite the considerable lower time resolution of fMRI. Accordingly, this study is conceptually based on the recent work by Logothetis et al. (27) , which shows that the magnitude of synaptically generated local field potentials—which give rise to the event-related electrophysiological signal—is correlated with the blood-oxygen-level-dependent signal. We also hypothesized that increased noise would predict classic abnormal patterns of cortical activation associated with schizophrenia.
Method
Participants
Our study was approved by the NIMH Institutional Review Board (Bethesda, Md.). Patients were recruited from among research volunteers of the Clinical Brain Disorders Branch Research Unit at NIMH. Normal volunteers were recruited through the NIMH Normal Volunteer office. Written informed consent was obtained from each participant. We evaluated 12 inpatients with schizophrenia and 16 normal comparison subjects. Two patients with schizophrenia and two normal comparison subjects were excluded for technical reasons (i.e., >2 mm head motion from volume to volume) and in order to match patients and normal subjects for task performance (reaction time). Thus, there were seven male patients and three female patients in the schizophrenia group. In the comparison group, there were eight male subjects and six female subjects. In the patient group, three were left-handed and seven were right-handed. In the comparison group, two subjects were left-handed and 12 were right-handed. All participants received a Structured Clinical Interview (28) , and schizophrenia diagnosis was made according to DSM–IV criteria (29) . Assessment of psychopathology was conducted with the Positive and Negative Syndrome Scale (30) . Five patients with schizophrenia were medication-free at the time of scanning (mean=18.4 days [SD=3.1, range=14–22]). Five patients were receiving standard treatment (atypical antipsychotic drugs). All patients were in a clinically stable condition. Participants were excluded if there was evidence of any medical or neurological disorder that could interfere with the study purpose. Further exclusion criteria were a history of current or recent drug or alcohol abuse (no criteria for abuse met in the last 6 months), head trauma, mental retardation, and electroconvulsive therapy (ECT) during the last 12 months. Handedness was assessed by questionnaire (31) . Detailed demographic and clinical data are depicted in Table 1 .

Task Conditions
Modifying our previously applied paradigm (32) and employing a mixed event-related and blocked design in order to maximize the task-related blood-oxygen-level-dependent response (33) , 108 visual stimuli (i.e., checkerboards) were presented on either the left or right side of the visual hemifield by means of a back-projection system on a translucent screen. While fixating a red dot in the center of the screen, subjects were instructed to respond as fast and accurately as possible to each stimulus by pressing either the left or right button, depending on the side of appearance of the checkerboard. Stimuli were presented with a duration of 400 msec and counterbalanced, and pseudo-randomized order was presented between stimulus onsets with interstimulus intervals of 2 seconds/4 seconds/6 seconds, such that each interstimulus interval was present in one-third of all interstimulus intervals. In addition, seven longer interstimulus intervals of 12 seconds were interspersed at regular intervals of 12 consecutive stimuli in order to allow the blood-oxygen-level-dependent response to fully recover (i.e., event-related and blocked design). Motor responses (latencies, errors, missing button presses) were recorded through a fiber-optic response box with buttons arranged in the same configuration as the stimuli presented on the screen. The total duration of the task was 500 seconds.
Image Acquisition
fMRI data were collected over a period of 4 months so that an order effect of patient versus comparison subject inclusion with regard to the time point of scanning was avoided. Whole-brain blood-oxygen-level-dependent responses were obtained with a gradient echo planar imaging sequence (24 sagittal, 6 mm thick interleaved slices without gap), excluding the lateral aspects of the temporal lobe region (relaxation time/echo time: TR/TE=2000/30 ms, flip angle=90°, field of view-24 cm, matrix=64×64, resulting in voxel dimensions of 3.75×3.75×6 mm), while subjects performed the visual choice reaction task (32) . Stimulus presentation was triggered automatically by the first slice acquisition of functional images.
Image Analysis
Standard voxel-by-voxel fMRI analysis was performed with Functioning Magnetic Imaging of the Brain Software Library (Oxford, U.K.; www.fmrib.ox.ac.uk/fsl), including motion correction (34) , spatial smoothing (full width at half maximum=6 mm), intensity normalization, and high-pass temporal filtering (σ=9.0s). For single-subject contrast analyses, general linear models were performed with either one or two explanatory variables. Examples are as follows: 1) combined left and right visual stimulus vector alone and—for comparison subjects—with 2) absolute mean head diplacement (mm) vector (x/y/z translation and rotation). The stimulus vector was convolved with a double-gamma hemodynamic response function (phase shift=6 seconds). Z (Gaussianized t) statistic images of the blood-oxygen-level-dependent response (activation) were usually thresholded using clusters determined by Z >2.3 and a (corrected) cluster significance threshold of p=0.01 (35 – 37) or as specified. From these calculations, we also obtained the voxel-by-voxel parameter estimate of residual noise variance of the modeled blood-oxygen-level-dependent response (y[t]=β×x(t)+c+e[t]). The residual noise variance (σ 2 =e[t]) accounts for the residual error between the fitted model and the data. Time-series statistical analysis was conducted using Functional Magnetic Imaging of the Brain Improved Linear Model with local autocorrelation correction (38) . Using AFNI (Bethesda, Md.), volume-of-interest analyses were manually drawn on the nontransfomed structural data for each individual subject.
General linear models group-level contrast analysis of the blood-oxygen-level-dependent response (mixed-effect analysis) was performed with Functional Magnetic Imaging of the Brain Local Analysis of Mixed Effects (39) . Z (Gaussianized t) statistic images were thresholded using clusters determined by Z >2.0 and a (corrected) cluster significance threshold of at least p=0.01 (35 – 37) or as specified. Based on these analyses, group maps of the group mean residual noise variance (σ 2 ) were created.
Probabilistic independent component analysis was conducted using the Functioning Magnetic Imaging of the Brain Software Library-implementation Multivariate Exploratory Linear Decomposition into Independent Components (Oxford, U.K.). In order to avoid overfitting and to achieve a unique decomposition of the functional data, we employed an objective estimation of the amount of Gaussian noise through Bayesian analysis of the true dimensionality of each subject’s whole-brain data (40) . The cutoff value is the maximum Bayesian evidence (using a Laplace approximation) of the model order from a probabilistic PCA model in the presence of voxel-wise temporal prewhitening (41) . This effectively calculates the number of eigenvalues, which violates the assumptions of noise sphericity (isotropic Gaussian noise) and signifies the number of processes, which renders the data to not conform to the assumed noise model (under linear signal assumptions). The dimensionality of the data (number of significant independent components, i.e., the number of activation and non-Gaussian noise sources) was counted (blind for diagnosis) in each subject’s medial prefrontal area to assess cortical signal fragmentation. Independent components were not required to be spatially limited to the medial prefrontal region. Physiological independent components unrelated to brain activity (e.g., related to heartbeat, breathing, and head movements) as well as physical independent components (42 , 43) were excluded from analysis.
Results
Demographic, Clinical, and Behavioral Data
No statistically significant group differences were found between patients with schizophrenia and normal comparison subjects with respect to sex, age, smoking status, handedness, mean reaction time, percentage error, omission rate or mean absolute, and relative head motion ( Table 1 ). However, within-task reaction time, standard deviation was significantly higher in the schizophrenia patient group.
Voxel-by-Voxel Analysis
Slice-by-slice overviews of the spatial distribution of the event-related and blocked blood-oxygen-level-dependent response (activation) are provided in a data supplement that accompanies the online version of this article, as is the mean residual noise power with and without inclusion of absolute head motion as a second explanatory variable (correction for head motion). The inclusion of head motion into the model has relatively little effect on the patterns of activation and residual noise power—both in normal comparison subjects and patients with schizophrenia. The overviews indicate that the blood-oxygen-level-dependent response is diminished in patients with schizophrenia relative to comparison subjects, while the opposite pattern is found regarding residual noise variance. The spatial distribution of the residual noise power suggests that susceptibility artifacts could, to some extent, contribute to the mean amount of residual noise along the brain surfaces in both subject groups. Theoretically, any group difference of residual noise variance could reflect an order effect (i.e., a variation of technical parameters of the scanning procedure over the 4-month study period). However, no significant difference was found between patients with schizophrenia and comparison subjects (p=0.596) regarding the day of scanning, starting with day 1 when the first subject was scanned.
In the area of interest (i.e., in the medial frontal lobe and anterior cingulate cortex) a significant blood-oxygen-level-dependent response was observed in the left hemispheric supplementary motor area and adjacent dorsal anterior cingulate cortex (d-anterior cingulate cortex) of the normal comparison group ( Figure 1 , left). The activation pattern is virtually identical with our previously obtained finding in another cohort under slightly different task and data collection conditions (28) . No significant activation was found in the medial frontal lobe and anterior cingulate cortex in either hemisphere of the schizophrenia group ( Figure 1 , left). This resulted in a statistically significant voxel-by-voxel group contrast of the blood-oxygen-level-dependent response between patients with schizophrenia and normal comparison subjects ( Figure 1 , right).
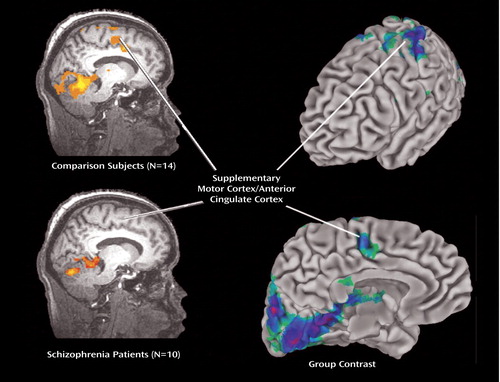
a Comparison subjects Omnibus statistical threshold: Z=3.3, p<0.0005, corrected, 1-sided; patients with schizophrenia (lower image) Omnibus statistical threshold: Z=1.6, p<0.05, corrected, one-sided.
b Different scaling, i.e., the low statistical threshold in patients with schizophrenia was chosen in order to indicate that little activation is found in patients even with a low threshold. In comparison subjects, a significant blood-oxygen-level-dependent response is seen in the left hemispherical area of the supplementary motor cortex and adjacent dorsal anterior cingulate cortex, with peak activation maximum (Z=4.1, p=0.00002; x=3.0, y=–3.0, z=37.0). In comparison subjects, significant blood-oxygen-level-dependent responses (Z=2.3, p<0.01, corrected) were also found in the same areas of the right hemisphere and in more anterior aspects of the medial frontal lobe and anterior cingulate cortex, although of lower magnitude (not depicted). In patients with schizophrenia, a significant blood-oxygen-level-dependent response is seen in the left hemispherical area of the supplementary motor cortex and adjacent dorsal anterior cingulate cortex, however, with the peak activation maximum on the right side (Z=2.2, p=0.014; x=–6.0, y=–8.0, z=40.0). Right: Cortical surface mapping of activity in left hemisphere with lateral view (upper image) and medial view (lower image) with group contrast analysis of averaged event-related and blocked blood-oxygen-level-dependent response (Omnibus statistical threshold: Z=3.3, p<0.0005, corrected, 1-sided) during visual two-choice reaction task between comparison subjects and patients with schizophrenia. A significant difference of the blood-oxygen-level-dependent response between groups is seen in the area of the supplementary motor cortex and adjacent dorsal anterior cingulate cortex. Note that the significant group difference (Z=2.3, p<0.01, corrected, one-sided) was also found in more anterior aspects of the medial frontal lobe, and the group differences were in the left rather than in the right hemisphere (not depicted).
In Figure 2 and Figure 3 , a more detailed view is provided with respect to the mean residual noise variance in the area of interest (left medial frontal lobe). Mean residual noise variance is lower in comparison subjects than in patients with schizophrenia in the supplementary motor area/anterior cingulate cortex area. Higher mean residual noise variance is also found in a widespread area, including the dorsolateral prefrontal, parietal, and occipital cortices; thalamus; and cerebellum. In the time series plots presented in the supplement that accompanies the online version of this article, an illustration is provided of a typical example of the variable blood-oxygen-level-dependent response with relation to the model of the hemodynamic response function, showing a lower fit of the data to the model in patients with schizophrenia relative to normal comparison subjects.
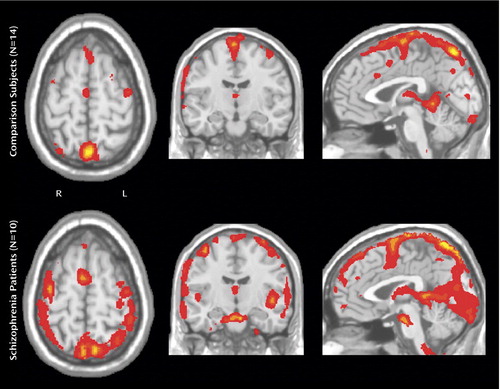
a The comparison group (N=14) shows relatively little residual noise variance in the medial frontal lobe/anterior cingulate cortex, whereas the opposite is seen in the schizophrenia group (N=10).
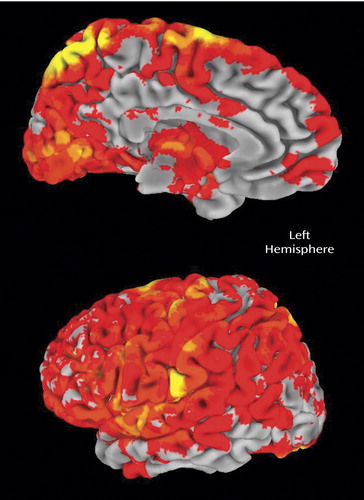
a Comparison group (N=14); schizophrenia group (N=10).
Volume-of-Interest Analysis
Volume-of-interest analyses that encompassed the entire medial frontal lobe/anterior cingulate cortex as well as subdivisions of this volume of interest confirmed that patients with schizophrenia have a lower blood-oxygen-level-dependent response on average ( Figure 4 ). However, the difference did not achieve statistical significance because of high interindividual variability of the mean number of activated voxels, particularly in the comparison group. In contrast, significant group differences were found for the average square root of residual noise variance (σ) within the same volume of interest between comparison subjects and patients ( Figure 4 ). As for the unequal distribution of sex between the two diagnostic groups, we also tested the effect of sex (independent factor) on noise variance (dependent variable) with volume-of-interest volume as a covariate, which resulted in no significant effect (F=0.18, df=1, 21; p=0.68).
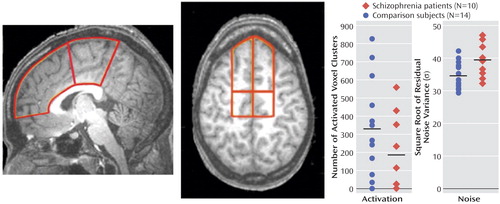
a For both hemispheres combined, the number (N) of activated voxel clusters and the square root of the residual noise variance (σ) were compared between normal subjects and patients with schizophrenia (ANCOVA model is presented in the data supplement that accompanies the online version of this article). Although patients with schizophrenia show less voxel clusters being activated, the difference to comparison subjects was not statistically significant because of high interindividual variance in the comparison group. Note that three out of 10 patients with schizophrenia and two out of 14 comparison subjects show no significant blood-oxygen-level-dependent response (activation) at all.
Independent Component Analysis
The number of significant independent components in the entire brain (brain activity+artifacts) differed significantly between the normal comparison group (N=50.6 [SD=8.3]) and the schizophrenia group (N=58.9 [SD=6.2]) (t=2.7, df=22, p=0.014). With regard to the prefrontal cortex and anterior cingulate cortex, visual inspection of the single-subject voxel-by-voxel analyses data revealed that patients showed qualitatively different activation patterns with a higher interindividual spatial variability of the maximum averaged activation within the region of the medial frontal lobe/anterior cingulate cortex relative to normal comparison subjects. This observation is in accord with earlier reports (13 , 20 , 44 , 45) . It is also consistent with the results from our independent component analysis, which showed a higher interindividual spatial variability of the independent components of the medial prefrontal blood-oxygen-level-dependent response in subjects with schizophrenia relative to comparison subjects after discarding those components that appeared to be artifact-related. Independent component analysis revealed that patients with schizophrenia had significantly more independent components of activation in the medial prefrontal area than comparison subjects ( Figure 5 ). This could suggest, in conjunction with our prior voxel-by-voxel and volume-of-interest analyses, that absolute activation of medial prefrontal cortex is reduced in schizophrenia, probably because the topographic pattern of activation in the medial frontal lobe appears to be more scattered (i.e., more variable and “fractionized”). This seems to indicate that patients perform the task successfully because they engage the critical cortical regions, but they do so in a less spatially consistent or stereotyped manner, which appears as less activation when concatinated into a group analysis.
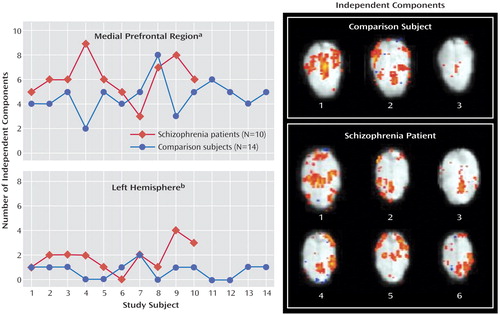
a Statistical comparison Mann-Whitney U test between groups of the number of independent components in the medial frontal lobe and anterior cingulate cortex (for both hemispheres combined), which has been previously found to be significant (p<0.05) in the independent component analysis. Patients with schizophrenia generally have a higher number of independent components. In comparison subjects, these medial prefrontal independent components explained 10% (SD=12) of the total variance of the blood-oxygen-level-dependent response (entire brain), while in patients with schizophrenia, 9% (SD=4) of the total variance was explained, which did not result in a significant difference between groups (t=0.3, df=22, p=0.775).
b Comparison between groups of the number of left hemispheric independent components using Mann-Whitney U test. (These components have medial prefrontal activation plus some activation in other parts of the left hemispheric cortex.) Illustration of the pattern of independent components with activation of the medial prefrontal lobe in one comparison subject with three independent components (upper panel) and one patient with schizophrenia, with six independent components (lower panel). The comparison subject has only symmetric activation patterns across hemispheres, while in the patient, four asymmetric components are found, i.e., medial prefrontal activation is correlated with either left or right hemispheric activation in the dorsolateral and parietotemporal cortical region. Full width at half maximum=6 mm, identical color-scaling across images, Talairached anatomical template images.
Interestingly, the independent component analysis also revealed a significantly higher number of medial prefrontal components with asymmetric coactivation of other left hemispheric regions (e.g., dorsolateral prefrontal, temporoparietal cortex) ( Figure 5 ).
Signal Regression Analysis
As expected, the average activation (number of activated voxels) is negatively correlated with the square root of residual noise variance in the medial frontal lobe bihemispheric volume of interest (Spearman’s r=–0.4, p=0.05), with no major difference of this correlation between the two diagnostic groups (not shown). The average activation within the entire medial frontal volume of interest also showed a significant positive correlation with the number of independent components in the patient group (r=0.65, p=0.04), while the correlation was nonsignificant in comparison subjects (r=0.11, p=0.71). No significant correlation was found between the number of independent components and the square root of residual noise variance in the medial frontal volume of interest (r=–0.12, p=0.56), which could indicate that these two features are relatively independent of each other. Next, we explored the relationship between prefrontal (supplemental motor area/d-anterior cingulate cortex) activation, residual noise variance, the number of independent components, and reaction time using multiple regression analysis, which was conducted with these three prefrontal processing variables as independent variables. Mean reaction time or the mean reaction time variability (SD) was the dependent variable. Although the two reaction time variables were positively correlated (r=0.7, p=0.0003), the later measure appeared to be more sensitive in differentiating comparison subjects from patients with schizophrenia (see Table 1 ). While there was no effect on mean reaction time as dependent variable (adjusted r=0.05, p=0.28), a significant multiple correlation for reaction time variability was obtained (adjusted: r=0.24, p=0.048, with activation β=–0.32, independent component analysis β=0.44, and noise β=0.25).
Clinical Correlations
A positive correlation was observed between left hemispheric square root of medial prefrontal noise variance and ratings of delusional ideation. Similar significant correlations were observed between left hemispheric medial prefrontal residual noise levels and other positive symptoms ratings, including hallucinations (r=0.71, p=0.03), inability of abstract thinking (r=0.67, p=0.05), and anxiety (r=0.67, p=0.05). These correlations were not found for the right hemisphere. Interestingly, no comparable correlations were seen between delusional ideation and left hemispheric medial frontal lobe activation (mean number of activated voxels) (r=–0.15, p=0.69), total number of independent components (r=–0.41, p=0.27), or independent components with left hemispheric coactivation (r=–0.20, p=0.6).
The potentially confounding effect of medication on measures of brain function is a critical issue in schizophrenia research. In our relatively small sample of patients with schizophrenia, the applied fMRI signal indices were not significantly influenced by medication status. In the left medial frontal volume of interest, treated patients had lower activation than untreated patients, which approached significance considering the small sample size (untreated: mean=110.2 [SD=130.3]; treated: mean=61.0 [SD=75.2]; Z=1.5, p=0.11), but other measures did not differ (e.g., square root of residual noise variance) (untreated: mean=27.3 [SD=4.1]; treated: mean=25.8 [SD=4.8]; Z=–0.7, p=0.47) the number of prefrontal independent components (untreated: mean=5.8 [SD=1.9]; treated: mean=6.4 [SD=1.5]; Z=0.3, p=0.754) and the number of medial prefrontal left hemispheric coactivation patterns (untreated: mean=1.6 [SD=0.6]; treated: mean=2.0 (1.6); Z=–0.4, p=0.66). In addition, no significant differences were observed between treated and untreated patients with regard to absolute or relative head motion (not shown).
Discussion
Prefrontal hypoactivation (hypofrontality) in schizophrenia has been demonstrated across a variety of different task and resting conditions using positron emission tomography (PET), fMRI, and electrophysiology (1 – 10) . However, recent work supports the notion that hypofrontality may be primarily present in low-performing patients (5 , 16) , and therefore it has been argued that different patterns of abnormal prefrontal function may characterize better performing subjects. The notion that the physiological cortical deficit in patients with schizophrenia is because of too much or too little activity seems overly simplistic, since how the information is being managed at the level of local circuit processing is likely the more meaningful consideration (15 , 18 , 19) . We have investigated clinically stable and moderately symptomatic patients who perform well on our simple choice reaction time task (i.e., patients with schizophrenia did not differ from comparison subjects in mean reaction time, although the within-task variability of reaction time was higher). Our voxel-by-voxel analysis suggests that this group of patients is also characterized by a pattern of reduced activation of the prefrontal cortex and other brain regions, a finding reminiscent of many neuroimaging studies of patients with schizophrenia. We believe, however, that this classic finding is partly a statistical phenomenon explained by increased residual noise variance (noise) and a more scattered pattern (higher number of independent components) of the stimulus-induced blood-oxygen-level-dependent response.
Our analyses suggest that these two noise features characterize patients better than does the level of prefrontal activation. With regard to residual noise variance—specifically that 1) the group difference of the residual noise variance in the volume-of-interest analysis is stronger than the group difference of the number of activated voxels; 2) the lower Z -scores (i.e., lower activation) in patients with schizophrenia in the general linear models are driven to a considerable extent by the increased residual noise variance; and 3) the increased residual noise variance in patients with schizophrenia does not appear to primarily reflect confounding effects (head motion, medication). Accordingly, our fMRI data are analogous with our previous electrophysiological finding of noise being a potential trait marker for schizophrenia (21) . Both approaches (i.e., the electrophysiological and the fMRI measurements) suggest that increased variability of brain function is a distinctive feature in schizophrenia. Whether increased electrophysiological and blood-oxygen-level-dependent response variability are directly related, however, cannot be answered with certainty on the basis of our currently available knowledge. Even so, it is a reasonable expectation given the relationship between the mean blood-oxygen-level-dependent response and strength of local field potentials has principally been demonstrated (27) .
The second finding of this study is that variance of the blood-oxygen-level-dependent response is not only increased at the single voxel level but also in the spatial domain, i.e., we found a higher number of independent components meaning that the prefrontal blood-oxygen-level-dependent response pattern is more fractionized. This finding could be directly related to the frequently made observation of reduced functional connectivity in schizophrenia (46 – 51) , as independent component analysis can be conceptualized as the inverse measure of functional connectivity analyses. This higher spatial variability of activation may further explain the discrepancy between our voxel-by-voxel analysis and volume-of-interest analysis with regard to the group difference of averaged activation. In the voxel-by-voxel group level analysis, a group difference is seen under conditions when the amplitude of an activation peak at a distinct and circumscribed location differs. This is necessarily the case when peak activation shows a high interindividual spatial variability as in schizophrenic patients. In contrast, volume-of-interest analyses are less prone to miss activity that results from increased interindividual spatial variability of peak activation because of the spatially more extended measurement area. In this context, it is interesting to note that high reaction time variability predicted low activation, high numbers of independent components, and high residual noise variance. At the same time, noise and activation are negatively correlated while the number of independent blood-oxygen-level-dependent response components is positively correlated with activation, whereas no correlation was found between noise and number of independent components. This suggests that too little and scattered activation on one hand and high residual variance on the other hand have a negative impact on reaction time performance.
1. Ingvar DH, Franzen G: Abnormalities of cerebral blood flow distribution in patients with chronic schizophrenia. Acta Psychiatr Scand 1974; 50:425–462Google Scholar
2. Ariel RN, Golden CJ, Berg RA, Quaife MA, Dirksen JW, Forsell T, Wolson J, Graber B: Regional cerebral blood flow in schizophrenia with the 133-xenon inhalation method. Arch Gen Psychiatry 1983; 40:258–263Google Scholar
3. Weinberger DR, Berman KF, Zec RF: Physiologic dysfunction of dorsolateral prefrontal cortex in schizophrenia, I: regional cerebral blood flow evidence. Arch Gen Psychiatry 1986; 43:114–124Google Scholar
4. Weinberger DR, Berman KF, Illowsky BF: Physiological dysfunction of dorsolateral prefrontal cortex in schizophrenia, III: a new cohort and evidence for a monoaminergic mechanism. Arch Gen Psychiatry 1988; 45:609–615Google Scholar
5. Callicott JH, Ramsey NF, Tallent K, Bertolino A, Knable MB, Coppola R, Goldberg T, van Gelderen P, Mattay VS, Frank JA, Moonen CT, Weinberger DR: Functional magnetic resonance imaging brain mapping in psychiatry: methodological issues illustrated in a study of working memory in schizophrenia. Neuropsychopharmacology 1998; 18:186–196Google Scholar
6. Curtis VA, Bullmore ET, Morris RG, Brammer MJ, Williams SC, Simmons A, Sharma T, Murray RM, McGuire PK: Attenuated frontal activation in schizophrenia may be task dependent. Schizophr Res 1999; 37:35–44Google Scholar
7. Heckers S, Goff D, Schacter DL, Savage CR, Fischman A, Alpert NM, Rauch SL: Functional imaging of memory retrieval in deficit vs nondeficit schizophrenia. Arch Gen Psychiatry 1999; 56:1117–1123Google Scholar
8. Winterer G, Ziller M, Dorn H, Frick K, Mulert C, Wuebben Y, Herrmann WM, Coppola R: Schizophrenia: reduced signal-to-noise ratio and impaired phase-locking during information processing. Clin Neurophysiol 2000; 111:837–849Google Scholar
9. Mulert C, Gallinat J, Schlattmann P, Dorn H, Pascual-Marqui R, Mientus S, Herrmann WM, Winterer G: Reduced event-related current density in the anterior cingulate cortex in schizophrenia. Neuroimage 2001; 13:589–600Google Scholar
10. Gallinat J, Mulert C, Bajbouj M, Rentzsch J, Senkowski D, Schunter J, Muchtieva R, Kronfeldt D, Nisslé S, Herrmann WM, Winterer G: Frontal and temporal dysfunction of auditory stimulus processing in schizophrenia. Neuroimage 2002; 17:110–127Google Scholar
11. Volz H, Gaser C, Hager F, Rzanny R, Ponisch J, Mentzel H, Kaiser WA, Sauer H: Decreased frontal activation in schizophrenics during stimulation with the continuous performance test—a functional magnetic resonance imaging study. Eur Psychiatry 1999; 14:17–24Google Scholar
12. Manoach DS, Press DZ, Thangaraj V, Searl MM, Goff DC, Halpern E, Saper CB, Warach S: Schizophrenic subjects activate dorsolateral prefrontal cortex during a working memory task, as measured by fMRI. Biol Psychiatry 1999; 45:1128–1137Google Scholar
13. Manoach DS, Gollub RL, Benson ES, Seal MM, Goff DC, Halpern E, Saper CB, Rauch SL: Schizophrenic subjects show aberrant fMRI activation of dorsolateral prefrontal cortex and basal ganglia during working memory performance. Biol Psychiatry 2000; 48:99–109Google Scholar
14. Callicott JH, Bertolino A, Mattay VS, Langheim FJ, Duyn J, Coppola R, Goldberg TE, Weinberger DR: Physiological dysfunction of the dorsolateral prefrontal cortex in schizophrenia revisited. Cereb Cortex 2000; 10:1078–1092Google Scholar
15. Callicott JH, Mattay VS, Verchinski BA, Marenco S, Egan MF, Weinberger DR: Complexity of prefrontal cortical dysfunction in schizophrenia: more than up or down. Am J Psychiatry 2003; 160:2209–2215Google Scholar
16. Ramsey NF, Koning HA, Welles P, Cahn W, van der Linden JA, Kahn RS: Excessive recruitment of neural systems subserving logical reasoning in schizophrenia. Brain 2002; 125:1793–1807Google Scholar
17. Winterer G, Egan MF, Goldberg TE, Coppola R, Weinberger DR: P300 and genetic risk for schizophrenia. Arch Gen Psychiatry 2003; 60:1158–1167Google Scholar
18. Weinberger DR, Egan MF, Bertolino A, Callicott JH, Mattay VS, Lipska BK, Berman KF, Goldberg TE: Prefrontal neurons and the genetics of schizophrenia. Biol Psychiatry 2001; 50:825–844Google Scholar
19. Winterer G, Weinberger DR: Genes, dopamine and cortical signal-to-noise ratio in schizophrenia. Trends Neurosci 2004; 27:683–690Google Scholar
20. Winterer G, Coppola R, Egan MF, Goldberg TE, Weinberger DR: Functional and effective frontotemporal connectivity and genetic risk for schizophrenia. Biol Psychiatry 2003; 54:1181–1192Google Scholar
21. Winterer G, Coppola R, Goldberg TE, Egan MF, Jones DW, Sanchez CE, Weinberger DR: Prefrontal broadband noise, working memory and genetic risk for schizophrenia. Am J Psychiatry 2004; 161:490–500Google Scholar
22. Sayers B, Beagley HA, Hanshall WR: The mechanisms of auditory evoked potentials. Nature 1974; 247:481–483Google Scholar
23. Gray CM, König P, Engel AK, Singer W: Oscillatory responses in cat visual cortex exhibit inter-columnar synchronization which reflects global stimulus properties. Nature 1989; 338:334–337Google Scholar
24. Bressler SL, Coppola R, Nakamura R: Episodic multiregional coherence at multiple frequencies during visual task performance. Nature 1993; 366:153–156Google Scholar
25. Salinas E, Sejnowski TJ: Correlated neuronal activity and the flow of neural information. Nat Rev Neurosci 2000; 2:539–550Google Scholar
26. Fries P, Reynolds JH, Rorie AE, Desimone R: Modulation of oscillatory neuronal synchronization by selective visual attention. Science 2001; 291:1506–1507Google Scholar
27. Logothetis NK, Pauls J, Augath M, Trinath T, Oeltermann A: Neurophysiological investigation of the basis of the fMRI signal. Nature 2001; 412:150–157Google Scholar
28. First MB, Spitzer RL, Gibbon M, Williams JB: The Structured Clinical Interview for DSM-IV Axis I Disorders Research Version (SCID-1). New York, New York State Psychiatric Institute, Biometrics Research, 1996Google Scholar
29. American Psychiatric Association: Diagnosis and Statistical Manual of Mental Disorders. Arlington, Va, American Psychiatric Association, 1994Google Scholar
30. Kay SR, Fiszbein A, Opler LA: The Positive and Negative Syndrome Scale (PANSS) for schizophrenia. Schizophr Bull 1987; 13:261–272Google Scholar
31. Oldfield RC: The assessment and analysis of handedness: The Edinburgh Inventory. Neuropsychologia 1971; 9:97–113Google Scholar
32. Winterer G, Adams CM, Jones DW, Knutson B: Volition to action: an event-related fMRI study. Neuroimage 2002; 17:851–857Google Scholar
33. Donaldson DI, Buckner RL: Effective paradigm design, in Functional MRI. Edited by Jezzard P, Matthews PM, Smith SM: Oxford, UK, Oxford University Press, 2001, pp 177–196Google Scholar
34. Jenkinson M, Bannister P, Brady J, Smith S: Improved optimisation for the robust and accurate linear registration and motion correction of brain images. Neuroimage 2002; 17:825–841Google Scholar
35. Worsley KJ, Evans AC, Marrett S, Neelin P: A three-dimensional statistical analysis for CBF activation studies in human brain. J Cereb Blood Flow Metab 1992; 12:900–918Google Scholar
36. Friston KJ, Worsley KJ, Frakowiak RSJ, Mazziotta JC, Evans AC: Assessing the significance of focal activations using their spatial extent. Human Brain Mapp 1994; 1:214–220Google Scholar
37. Forman SD, Cohen JD, Fitzgerald M, Eddy WF, Mintun MA, Noll DC: Improved assessment of significant activation in functional magnetic resonance imaging (fMRI): use of a cluster-size threshold. Magn Reson Med 1995; 33:636–647Google Scholar
38. Woolrich MW, Ripley BD, Brady JM, Smith SM: Temporal autocorrelation in univariate linear modelling of fMRI data. Neuroimage 2001; 14:1370–1386Google Scholar
39. Behrens T, Woolrich MW, Smith S: Multi-Subject Null Hypothesis Testing Using a Fully Bayesian Framework: Theory. New York, Human Brain Mapping Meeting, 2003Google Scholar
40. Beckmann CF, Smith SM: Probabilistic independent component analysis for functional magnetic resonance imaging. IEEE Trans Med Imaging 2004; 23:137–152Google Scholar
41. Minka TP: Automatic Choice of Dimensionality for PCA. Tech. Rep. number 514. Boston, MIT Media Lab, 2000Google Scholar
42. Calhoun VD, Adali T, Pearlson GD, Pekar JJ: Spatial and temporal independent component analysis of functional MRI data containing a pair of task-related waveforms. Hum Brain Mapp 2001; 13:43–53Google Scholar
43. Calhoun VD, Adaldi T, Pearlson GD, van Zijl PC, Pekar JJ: Independent component analysis of fMRI data in the complex domain. Magn Reson Med 2002; 48:180–192Google Scholar
44. Daniel DG, Weinberger DR, Jones DW, Zigun JR, Coppola R, Handel S, Bigelow LB, Goldberg TE, Berman KF, Kleinman JE: The effect of amphetamine on regional cerebral blood flow during cognitive activation in schizophrenia. J Neurosci 1991; 11:1907–1917Google Scholar
45. Heckers S, Weiss AP, Deckersbach T, Goff DC, Morecraft RJ, Bush G: Anterior cingulate cortex activation during cognitive interference in schizophrenia. Am J Psychiatry 2004; 161:707–715Google Scholar
46. Volkow ND, Wolf AP, Brodie JD, Cancro R, Overall JE, Rhoades H, Van Gelder P: Brain interactions in chronic schizophrenics under resting and activation conditions. Schizophr Res 1988; 1:47–53Google Scholar
47. Weinberger DR: A connectionist approach to the prefrontal cortex. J Neuropsychiatry Clin Neurosci 1993; 5:241–253Google Scholar
48. Friston KJ, Frith CD: Schizophrenia: a disconnection syndrome? Clin Neurosci 1995; 3:89–97Google Scholar
49. Bullmore ET, Frangou S, Murray RM: The dysplastic net hypothesis: an integration of developmental and dysconnectivity theories of schizophrenia. Schizophr Res 1997; 28:143–156Google Scholar
50. Fletcher P, McKenna PJ, Friston KJ, Frith CD, Dolan RJ: Abnormal cingulate modulation of fronto-temporal connectivity in schizophrenia. Neuroimage 1999; 9:337–342Google Scholar
51. Schlösser R, Gesierich T, Kaufmann B, Vucurevic G, Hunsche S, Gawehn J, Stoeter P: Altered effective connectivity during working memory performance in schizophrenia: a study with fMRI and structural equation modeling. Neuroimage 2003; 19:751–763Google Scholar