Prediction of Antidepressant Effects of Sleep Deprivation by Metabolic Rates in the Ventral Anterior Cingulate and Medial Prefrontal Cortex
Abstract
OBJECTIVE: Sleep deprivation has been shown to have an antidepressant benefit in a subgroup of depressed patients. Functional imaging studies by the authors and others have suggested that patients with elevated metabolic rates in the anterior cingulate gyrus at baseline are more likely to respond to either sleep deprivation or antidepressant medications than patients with normal metabolic rates. The authors extend their earlier work in a larger group of patients and explore additional brain areas with statistical probability mapping. METHOD: Thirty-six patients with unipolar depression and 26 normal volunteers were studied with positron emission tomography before and after sleep deprivation. Response to sleep deprivation was defined as a 40% or larger decrease in total scores on the Hamilton Depression Rating Scale. RESULTS: One-third of the depressed patients had a significant response to sleep deprivation. Responders had higher relative metabolic rates in the medial prefrontal cortex, ventral anterior cingulate, and posterior subcallosal gyrus at baseline than depressed patients who did not respond to sleep deprivation and normal volunteers. Lower Hamilton depression scores correlated significantly with lower metabolic rates in the left medial prefrontal cortex. After sleep deprivation, significant decreases in metabolic rates occurred in the medial prefrontal cortex and frontal pole in the patients who responded positively to sleep deprivation. CONCLUSIONS: High pretreatment metabolic rates and decreases in metabolic rates after treatment in the medial prefrontal cortex may characterize a subgroup of depressed patients who improve following sleep deprivation and, perhaps, other antidepressant treatments.
Sleep deprivation is the only known intervention in depressive illness that has proven antidepressant benefits within 24 hours (1, 2). More than 61 reports (N=1,700 patients) have documented that total or partial sleep deprivation leads to significant, albeit transitory, improvement in 30%–50% of severely depressed patients. The antidepressant effects of sleep deprivation have been demonstrated in patients who range in age from adolescence (3) to late life (4), as well as in patients with diverse clinical and demographic characteristics.
Although the form of depressive symptoms has not generally differentiated responders from nonresponders, patterns of functional brain activity may be more informative. Brain imaging studies from our group (5) and others (Table 1) have suggested that patients with relatively high rates of metabolism or perfusion in the anterior cingulate gyrus before sleep deprivation are more likely to show a favorable clinical response to sleep deprivation than are patients with lower rates of baseline activity. Not only did activity in the anterior cingulate gyrus predict therapeutic response, but patients whose depressive symptoms were diminished after sleep deprivation showed a posttreatment decrement in metabolism in the medial prefrontal cortex and the frontal pole. The predictive value of pretreatment metabolic activity in the cingulate gyrus is not limited to sleep deprivation. Two studies of antidepressant medications also linked degree of clinical improvement to baseline metabolic rates in the anterior cingulate (10, 12).
Despite agreement within the functional imaging literature on the importance of the anterior cingulate as a predictor of therapeutic response, studies that attempt to localize the affected area more precisely and explore functionally related brain areas are needed. Since partial volume effects, inaccuracy in region of interest placement, and use of large medial region of interest boxes for activity assessment may average together or dilute ventral anterior cingulate effects, variation in the location and direction of anterior medial activity may be prominent. In the current study we extended our data analysis, using statistical probability mapping and a larger number of subjects to increase statistical power.
METHOD
Subjects
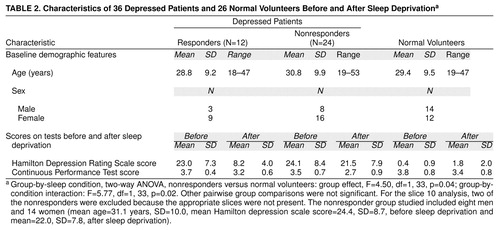
We used [18F]fluorodeoxyglucose (FDG) positron emission tomography (PET) to study 36 depressed patients and 26 normal volunteers (Table 2) while awake after a night of normal sleep and again following all-night sleep deprivation. Fifteen of the 36 depressed patients and 15 of the 26 volunteers were included in our previous study (5). As established by the Structured Clinical Interview for DSM-III-R (22), all patients met criteria for unipolar major depressive disorder, and all had scores of 17 or higher on the 24-item Hamilton Depression Rating Scale (23). Patients had no additional axis I diagnoses. Neither patients nor volunteers had taken psychoactive medications for at least 2 weeks, and none had been treated previously with fluoxetine or depot neuroleptics.
All subjects were free of physical disorders. Normal volunteers were without mental disorders in themselves or first-degree relatives. Informed consent was obtained from all subjects after the procedure was fully explained.
Clinical Procedure and Assessment
Subjects were deprived of sleep under continuous supervision from approximately 5:00 p.m. until completion of the PET scan the following afternoon between 1:00 p.m. and 5:00 p.m. Mood was measured with a modified Hamilton depression scale that omitted sleep-related items (items 4–6) on the baseline PET scan day after a night of normal sleep and again on the second PET scan day after sleep deprivation. Trained Hamilton depression scale raters were periodically evaluated throughout the study. Patients were defined as responders to sleep deprivation if their Hamilton depression scale scores decreased by 40% or more after total sleep deprivation (24). The FDG PET procedure (25) and the Continuous Performance Test (26), a visual vigilance task performed during FDG uptake, have been described elsewhere.
Brain Imaging Protocol
Images were obtained on a NeuroECAT scanner (needle source measured 7.6-mm axial resolution, full width at half maximum). An individually molded plastic mask was used to immobilize each subject. Repositioning of subjects between the two scans was accurate to within 2 mm (25). Calibrated images were acquired (600,000–1,000,000 counts), attenuation-corrected, and filtered (25). The scanner was calibrated and normalization obtained in a standardized way (by C.T. and M.S.B.) over the entire data collection period.
Image Analysis
PET scans were assigned to match the Matsui and Hirano atlas ((27) slice plane (number 13) and the corresponding Talairach and Tournoux atlas (28) slice plane (number 14) by a technician without knowledge of diagnosis or experimental condition and converted to relative data (metabolic rate for region of interest/metabolic rate for whole brain). For some additional analyses, square regions of interest of 3-by-3 and 6-by-6 pixels were placed according to standard methods (10, 28)
Statistical Probability Mapping
Images were first converted into a standardized coordinate system. The average PET edge across all individual slices was computed, and these mean edges were used to conform each individual PET slice to the average edge contour with a radius-length-adjustment method. Between-group t tests (pixel-by-pixel) were performed on averaged PET images for depressed patients (responders and nonresponders to sleep deprivation) and normal volunteers in a manner essentially similar to that of other related research reports (12, 14, 19). For a priori hypotheses based on previous work (5–7, 10, 12), one-tailed t tests were used.
Resampling Methods to Evaluate Statistical Significance
As reviewed by other investigators (29, 30), resampling or randomization methods in PET analysis avoid poorly met statistical assumptions inherent in some imaging applications. We used resampling in this study to evaluate the probabilities of random occurrences of t values yielding p<0.05 in a cluster of adjacent pixels (31, 32). Groups of normal subjects matching the patients (12 responders, 24 nonresponders) were randomly selected from a larger pool of subjects (N=109). The first 12 were compared by t test against the remaining 24 subjects, and a p map was computed. This p map was then thresholded at the p<0.05 level and a frequency distribution for suprathreshold pixel cluster sizes tabulated. After 100 resampling runs drawing on a total of 5,000 clusters, the resulting frequency distributions were averaged into one cumulative distribution to determine the minimum size of contiguously clustered pixels that occurred less than once in 20. In place of the conventional p<0.05 t test criterion, only clusters larger than 95% of clusters appearing on resampling trials were accepted as statistically significant. A similar process was used for correlation images to determine the minimum contiguous cluster size to be statistically significant (resampling p<0.05).
Cortical Brodmann areas and subcortical regions were defined (by J.F.) by using corresponding representative magnetic resonance images (MRI) and brain atlases (27, 28) (Figure 1). These boundaries are based on only two atlases and unavoidably reflect a limited sample. A statistical study of Brodmann area margins and their proportional slice margins is not available. Since our resolution was 7.6 mm in plane, all cortical areas reported are greater than 4 full width at half maximum.
To assess the reliability of medial prefrontal cortex and cingulate gyrus locations on our template, the proportional coordinates were compared with MRI measurements from an independent group of 16 subjects selected for having a single visible sulcus (separating Brodmann area 24 from Brodmann area 32) for all slice levels covering the cingulate from interior to superior segments (31). Distance from the anterior edge of the slice as a percent of the anterior/posterior distance was measured (28). For the MRI slices (z=12), the mean y value for the cingulate center was 20.9% plus 2.9%. Our cingulate region template extended from y=18% to y=25% (y values of 23–36 at z=12), so the group mean from the MRI successfully overlapped the template.
RESULTS
Baseline Metabolic Rate and Response to Sleep Deprivation
Therapeutic response
Of the 36 depressed patients studied, 12 responded positively to sleep deprivation (they had a 40% or greater decrease in total Hamilton depression scale scores) and 24 did not respond to sleep deprivation (Table 2).
Cingulate, medial prefrontal, and posterior subcallosal cortex
At baseline, bilateral relative metabolic rates within the ventral anterior cingulate (Brodmann area 24), medial prefrontal cortex (Brodmann area 32), and posterior subcallosal cortex (Brodmann area 25) were significantly higher in responders than nonresponders or normal volunteers (Table 3 and Figure 2). In contrast, nonresponders had significantly lower metabolic activity in the right anterior cingulate and medial prefrontal cortex (Brodmann areas 24 and 32) than normal volunteers. No differences among the three groups of subjects met resampling criteria for statistical significance in dorsal aspects (above Talairach z=12) of the anterior cingulate cortex. Increasing our region of interest to a large 6-by-6-pixel midline box (x=0, y=–32) to evaluate potential resolution problems with adjacent midline structures produced similar results (responders’ mean=0.87, SD=0.18; nonresponders’ mean=0.74, SD=0.15) (t=2.07, df=34, p<0.05). This box is very close to the optimal localization of the subgenual prefrontal cortex abnormality found by Drevets et al. (16) to distinguish all unmedicated patients with depression from control subjects (x=–2, y=32, z=–2, their Figure 2).
Restricting our study group to the 21 subjects not studied previously (7) confirmed the earlier-reported regional cingulate effect (responders’ right mean=1.16, SD=0.22, left mean=1.20, SD=0.22; nonresponders’ right mean=0.98, SD=0.20, left mean=0.97, SD=0.27) (t=2.34 and t=2.77, df=19, respectively; effect size=0.86 and 0.88, respectively; p<0.05).
After sleep deprivation, responders showed significantly decreased metabolic activity in the left medial prefrontal cortex (Brodmann area 32) and frontal pole (Brodmann area 10) (Table 3 and Figure 2) compared with baseline values. Among the depressed patients as a group, the change in metabolic rate in the left medial prefrontal cortex correlated significantly with the change in Hamilton depression scale score after sleep deprivation (r=0.35, N=36, p<0.05) (Figure 3). That is, the greater the antidepressant effect, the greater the reduction in the relative metabolic rate.
Striatal region
At baseline, both responders and nonresponders had significantly lower striatal relative metabolic rates than normal volunteers (Table 3). After sleep deprivation, neither responders nor nonresponders showed significant striatal changes, but normal volunteers showed significant decreases.
Frontal and occipital cortex
At baseline, both depressed responders and nonresponders showed significantly higher metabolic activity in the occipital cortex than normal volunteers (Table 3 and Figure 2). After sleep deprivation, responders showed significant increases in the right lateral prefrontal cortex (Brodmann area 46), but volunteers showed a decrease.
Temporal cortex
At baseline, responders had significantly higher metabolic activity in the left superior temporal area (Brodmann area 38) (Table 3 and Figure 2) than nonresponders and significantly lower activity in the right inferior temporal area (Brodmann area 37) than normal volunteers. After sleep deprivation, responders showed a significant increase in the right insula (Brodmann area 52). Depressed patients as a group showed a significant negative correlation between metabolic change in the left temporal cortex and change in Hamilton depression scale score after sleep deprivation (Figure 3).
Task Performance After Sleep Deprivation
Not surprisingly, all groups showed decreased vigilance on the Continuous Performance Test (26) after sleep deprivation compared with baseline scores, but the decrease was statistically significant only in depressed nonresponders and normal volunteers (Table 2). Since there were no significant between-group differences in vigilance scores at baseline, performance differences cannot explain baseline differences in metabolism between responders and nonresponders.
DISCUSSION
This study has confirmed and extended two major findings from our earlier study (7). First, depressed patients who showed a favorable clinical response to sleep deprivation had higher relative metabolic rates in the ventral anterior cingulate, medial prefrontal cortex, and posterior subcallosal cortex at baseline than either normal volunteers or depressed patients who did not respond to sleep deprivation. Second, metabolic activity in the medial prefrontal cortex and frontal pole decreased and normalized in responders after sleep deprivation but not in nonresponders and normal volunteers, who remained unchanged. Findings in the 21 new patients confirmed findings in the 15 earlier-studied patients (7) and are consistent with reports by other investigators who used single photon emission computed tomography to study sleep deprivation (6, 8, 9).
Do the metabolic correlates of the antidepressant response to sleep deprivation (relatively high metabolism in the ventral anterior cingulate at baseline and decreased metabolism in the medial prefrontal cortex after clinical improvement) also characterize response to other forms of treatment such as antidepressant medications, ECT, light therapy, and cognitive therapy? What is the role of the anterior cingulate in affective disorder and in normal affective function?
Table 1 summarizes several studies on the effects of antidepressant medication. Buchsbaum et al. (10) reported a significant correlation between extent of improvement measured by the Hamilton depression scale and change in metabolic rate in the anterior cingulate gyrus (summed across its extent) in patients treated with sertraline. Increased relative metabolism in the adjacent and slightly inferior region, at x=–10, y=16, z=–12 (labeled “Brodmann area 25” [ventral cingulate] in Talairach and Tournoux [28] and “rectal gyrus” in Matsui and Hirano [27]), also predicted clinical response to sertraline (r=0.76), a finding with an effect center only about 14–19 mm distant from the prediction area in the current data.
Similarly, Mayberg et al. (12) found that patients with unipolar depression who had high pretreatment metabolism in the rostral anterior cingulate later proved to be responders to treatment with unspecified antidepressants. By contrast, Little et al. (11) reported that low metabolism in the cingulate gyrus predicted antidepressant response to venlafaxine or bupropion. The discrepancies between studies could reflect differential effects of the antidepressant treatments studied, differences in anatomic localization, or differences in dorsoventral level. Differing gender compositions of the various study groups may be another confounding variable.
The studies listed in Table 1 generally support a role for the cingulate in affect regulation. Cingulate activity is usually lower in untreated depressed patients than in comparison subjects and correlates with mood change in studies of depressed patients.
The anterior cingulate and medial prefrontal cortex are believed to modulate internal emotional response. Devinsky et al. (33) distinguished the affect-related role of rostral areas 24 and 25 from the cognitive role of caudal Brodmann area 24 and Brodmann area 32. Note that high metabolic activity at baseline in responders is found in both affective (Brodmann areas 24 and 25) and cognitive (Brodmann area 32) areas. The posttreatment change in metabolic rate in responders to sleep deprivation was confined to cognitive areas (Brodmann areas 32 and 10). Rostral Brodmann area 32 is connected to the amygdala and parts of the autonomic brainstem nuclei (33); this differential effect suggests that cognitive factors could be important in the modulation of emotion.
We (15, 34, 35) and others (reviewed in reference 35) reported reductions in relative frontal lobe to occipital lobe metabolism in patients with unipolar and bipolar depression while awake and in patients with unipolar depression during non-REM sleep. Decreased frontal lobe metabolism has also been reported in depression associated with conditions such as Parkinson’s disease (36, 37), Huntington’s disease (38), and seizure disorders (39). In the current study, sleep-deprived normal volunteers showed decreased metabolism in the lateral prefrontal cortex but increased metabolism in the occipital cortex (Table 3), a pattern dissimilar to that seen in depressed patients who responded to sleep deprivation. Responders had significantly higher metabolism in the bilateral visual association cortex than did normal volunteers at baseline, but they actually showed increased metabolism in the lateral prefrontal cortex after sleep deprivation. Thus, in responders, sleep deprivation seemed to partly correct the pretreatment pattern of relative hypofrontality seen in other studies (reviewed in reference 15).
Note, however, that values for the ventral anterior cingulate (Brodmann areas 25 and 24) were higher in responders than in either nonresponders or normal volunteers at baseline, but sleep deprivation effects tended to be slightly more anterior and located in medial prefrontal Brodmann area 32 rather than Brodmann areas 25 and 24. Posterior subcallosal Brodmann area 25 belongs to an infralimbic circuit that comprises afferent projections from the amygdala, the thalamic paraventricular nucleus, and the hypothalamus (40). The infralimbic area, which is considered the cortical center of the autonomic nervous system (41), is involved in the visceral motor response to stressful behavioral and emotional events (42). This area, which was predictive of therapeutic response to sleep deprivation, corresponds to the posterior subcallosal gyrus or ventral compartment of the model proposed by Mayberg et al. (12, 43).
In addition to differences in anterior cingulate metabolism, depressed patients had significantly lower striatal and temporal relative metabolic rates than normal volunteers. The striatal finding is compatible with reports that depressed patients have decreased relative basal ganglia metabolism (15, 44) and perfusion (45). In depressed patients, relative metabolism in the temporal cortex correlated negatively with change in Hamilton depression scale score after sleep deprivation, a finding consistent with the report by Cohen et al. (46) that depressed patients had decreased metabolism in the temporal cortex relative to values in normal volunteers.
The dopamine system may be implicated in the response to sleep deprivation. Decreased dopamine activity has been hypothesized for depression (47). Dopaminergic projections from the ventral tegmental area inhibit excitatory thalamic input into the subgenual region. Decreased dopaminergic firing in responders compared with normal volunteers or nonresponders from the ventral tegmental area to the paraventricular thalamic nucleus would result in a disinhibition of thalamocortical firing that would be compatible with increased activity in the infralimbic Brodmann area 25 in the responders. This suggests that responders may be hypodopaminergic compared with nonresponders and normal volunteers.
Ebert et al. (9) reported that responders had significantly greater displacement of D2 ligands after sleep deprivation than before but that nonresponders showed no changes. Their finding suggests that dopaminergic function in responders, but not nonresponders, was enhanced by sleep deprivation.
Gerner et al. (48), in a comparison of CSF samples from depressed patients before and after sleep deprivation, found increased posttreatment levels of the dopamine metabolite homovanillic acid in responders but not nonresponders, suggesting that dopamine activity was associated with clinical antidepressant effects.
Serotonin effects may also relate to differences between responders and nonresponders. High baseline metabolic rates in ventral medial frontal regions predicted clinical response to the selective serotonin reuptake inhibitor sertraline (10). In that study, as in the current study, metabolic rates in lateral prefrontal regions increased after treatment (10). A complex interaction between sleep deprivation recovery and the serotonin system is also suggested by serotonin depletion studies (49). Specific studies of 3H-imipramine and 3H-paroxetine binding, however, differentiated control subjects and depressed suicide victims in the hippocampus but not the cingulate (50)
Our current results confirm our a priori hypothesis about the involvement of the anterior cingulate and the prefrontal cortex in the response to sleep deprivation. Our observations, however, suggest secondary hypotheses to be tested.
First, three other areas were implicated in the antidepressant response. The increase in metabolic rate in the left superior temporal lobe (Brodmann area 37) and right insula correlated significantly with improvement in the depressed group after sleep deprivation. Metabolic activity in the right lateral prefrontal cortex (Brodmann area 45) also increased significantly after sleep deprivation in responders.
Second, the metabolic rate in the putamen, occipital cortex (Brodmann areas 18 and 19), inferior temporal cortex (Brodmann areas 38 and 21), and midbrain was abnormal both at baseline and after sleep deprivation in responders and nonresponders. Despite a 64% improvement in mean depression ratings, responders did not show changes in metabolic rate in these four areas, suggesting that they may not be involved in the pathophysiology or treatment of depressed mood per se. One caveat, however, is that responders remained mildly depressed (Hamilton depression scale mean score=8.4 versus 1.8 for normal volunteers). It would be interesting to determine whether metabolism completely normalizes in these and other areas after full symptomatic recovery.
Third, nonresponders had abnormally low relative metabolic activity in the anterior cingulate at baseline. Many investigators (Table 1) reported reduced perfusion or metabolism in the anterior cingulate and prefrontal cortex ventral to the genu of the corpus callosum in patients with affective disorders. Since there were more nonresponders to sleep deprivation than responders, this group effect is not surprising. Differences between subtypes of patients with affective disorder based on therapeutic response are likely to involve a network of brain regions, of which the ventral anterior cingulate is only one.
Received May 4, 1998; revision received Feb. 1, 1999; accepted April 19, 1999. From the Department of Psychiatry and Human Behavior, College of Medicine and the Department of Anatomy and Neurobiology, University of California, Irvine; the Department of Psychiatry, University of California, San Diego, in La Jolla; the San Diego VA Medical Center; and the Department of Psychiatry, Neuroscience PET Laboratory, Mt. Sinai School of Medicine, New York. Address reprint requests to Dr. Wu, Department of Psychiatry and Human Behavior, Brain Imaging Center, Rm. 163, Irvine Hall, University of California, Irvine, CA 92717; [email protected] (e-mail) Supported by NIMH grants MH-42955 (Dr. Wu), MH-30914, MH-57134 (Dr. Gillin), and MH-23910 (Dr. Buchsbaum); by University of California, San Diego, Mental Health Clinical Research Center grant MH-30914; and by the San Diego VA Medical Center (Dr. Gillin). Additional support was provided by the National Alliance for Research on Schizophrenia and Depression, the VA Research Service (Dr. Gillin), and the Brain Imaging Committee of the University of California, Irvine. The authors thank Laura Sutton; Carolyn Ruiz; Fredrick Storch; Madeline Rose, R.N.; Dee Harvey; and Paul Jerabek, Ph.D., for their assistance.
 |
 |
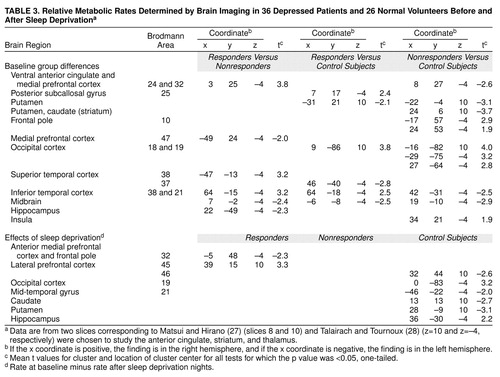 |

FIGURE 1. Neuroanatomical Key of Brain Areas Used in Analysis of Metabolic Activity in 36 Depressed Patients and 26 Normal Volunteers Before and After Sleep Deprivationa
aBoundaries of cortical Brodmann areas (on right side) and subcortical structures (on left side) for statistical probability maps are shown in yellow dotted lines. All subjects were proportionately standardized to this atlas diagram. Numbers are Brodmann areas: 6=premotor cortex; 10=frontal pole; 11=deep orbital cortex; 17=primary visual cortex; 18 and 19=occipital cortex; 21=middle temporal gyrus; 22=superior temporal gyrus; 23=posterior cingulate; 24=ventral anterior cingulate at z=–4-mm level; 25=posterior subcallosal gyrus; 31=posterior paracingulate; 32=medial prefrontal cortex; 37=inferior temporal gyrus; 38=temporal tip; 39=inferior parietal lobule; 45 and 46=lateral prefrontal cortex; 47=inferior lateral prefrontal cortex; and 52=insula.

FIGURE 2. Differences in Baseline Relative Metabolic Rates Between 26 Normal Volunteers and 36 Depressed Patients Who Did (N=12) or Did Not (N=24) Respond to Sleep Deprivationa
aIn the top row, the Matsui-Hirano atlas (27) slice 10 is approximately equivalent to the Talairach-Tournoux atlas (28) slice z=–4 mm level. Significant changes in regional metabolism that correspond to the a priori hypotheses described in the text are indicated. The color bar indicates the percentage difference between the first group and the second group (e.g., red indicates that the relative metabolic rate in responders was 35% higher than in nonresponders in the anterior cingulate). Paired t tests for each pixel were computed between baseline and sleep deprivation conditions for each group to assess sleep deprivation effects. The images are thresholded for t values corresponding to p<0.05, but only contiguous pixel clusters that met the resampling criterion for significance are displayed (see Method section). The x and y scales are approximate Talairach-Tournoux positions. The bottom row shows changes in relative metabolic rates after sleep deprivation and the percentage difference in relative metabolic rate for within-group regional differences due to change in sleep deprivation (p<0.05 pixel clusters were confirmed as sufficiently large by resampling). Regions where rates decreased significantly after sleep deprivation are blue-purple in color.

FIGURE 3. Correlation Coefficients Between Change in Hamilton Depression Rating Scale Score and Change in Relative Metabolic Rate After Sleep Deprivation in 36 Depressed Patientsa
aChange in Hamilton depression scale score is based on the baseline score minus score after sleep deprivation; change in relative metabolic rate is based on the rate at baseline scan minus rate at scan after sleep deprivation. The color bar indicates the product-moment correlation coefficient value. The red region in the z=–4 level indicates significant positive correlations (threshold for display at resampling was p<0.05) in the left anterior medial prefrontal cortex.
1. Wu JC, Bunney WE: The biological basis of an antidepressant response to sleep deprivation and relapse: a review and hypothesis. Am J Psychiatry 1990; 147:14–21Link, Google Scholar
2. Leibenluft E, Wehr TA: Is sleep deprivation useful in the treatment of depression? Am J Psychiatry 1992; 149:159–168Google Scholar
3. Naylor MW, King CA, Lindsay KA, Evans T, Armelagos J, Shain BN, Greden JF: Sleep deprivation in depressed adolescents and psychiatric controls. J Am Acad Child Adolesc Psychiatry 1993; 32:753–759Crossref, Medline, Google Scholar
4. Reynolds CF III, Kupfer DJ, Hoch CC, Stack JA, Houck PA, Berman SR: Sleep deprivation effects in older endogenous depressed patients. Psychiatry Res 1987; 21:95–109Crossref, Medline, Google Scholar
5. Wu JC, Gillin JC, Buchsbaum MS, Hershey T, Hazlett E, Sicotte N, Bunney WE: The effect of sleep deprivation on cerebral glucose metabolic rate in normal humans assessed with positron emission tomography. Sleep 1991; 14:155–162Medline, Google Scholar
6. Ebert D, Feistel H, Barocka A: Effects of sleep deprivation on the limbic system and the frontal lobes in affective disorders. Psychiatry Res Neuroimaging 1991; 40:247–251Crossref, Medline, Google Scholar
7. Wu JC, Gillin JC, Buchsbaum MS, Hershey T, Johnson JC, Bunney WE Jr: Effect of sleep deprivation on brain metabolism of depressed patients. Am J Psychiatry 1992; 149:538–543Link, Google Scholar
8. Volk S, Kaendler SH, Weber R, Georgi K, Maul F, Hertel A, Pflug B, Hor G: Evaluation of the effects of total sleep deprivation on cerebral blood flow using single photon emission computerized tomography. Acta Psychiatr Scand 1992; 86:478–483Crossref, Medline, Google Scholar
9. Ebert D, Feistel H, Kaschka W, Barocka A, Pirner A: Single photon emission computerized tomography assessment of cerebral dopamine D2 receptor blockade in depression before and after sleep deprivation. Biol Psychiatry 1994; 35:880–885Crossref, Medline, Google Scholar
10. Buchsbaum MS, Wu JC, Siegel B, Hackett E, Trenary M, Abel L, Reynolds C: Effect of sertraline on regional metabolic rate in patients with affective disorder. Biol Psychiatry 1997; 41:15–22Crossref, Medline, Google Scholar
11. Little JT, Ketter TA, Kimbrell TA, Danielson A, Benson B, Willis MW, Post RM: Venlafaxine or bupropion responders but not nonresponders show baseline prefrontal and paralimbic hypometabolism compared with controls. Psychopharmacol Bull 1996; 32:629–635Medline, Google Scholar
12. Mayberg HS, Brannan SK, Mahurin RK, Jerabek PA, Brickman JS, Tekell JL, Silva JA, McGinnis S, Glass TG, Martin CC, Fox PT: Cingulate function in depression: a potential predictor of treatment response. Neuroreport 1997; 8:1057–1061Google Scholar
13. Mayberg HS, Lewis PJ, Regenold W, Wagner HN Jr: Paralimbic hypoperfusion in unipolar depression. J Nucl Med 1994; 35:929–934Medline, Google Scholar
14. Bench CJ, Friston KJ, Brown RG, Scott LC, Frackowiak RSJ, Dolan RJ: The anatomy of melancholia. Psychol Med 1992; 22:607–615Crossref, Medline, Google Scholar
15. Ho AP, Gillin JC, Buchsbaum MS, Wu JC, Abel L, Bunney WE: Brain glucose metabolism during non-rapid eye movement sleep in major depression. Arch Gen Psychiatry 1996; 53:645–652Crossref, Medline, Google Scholar
16. Drevets WC, Price JL, Simpson JR Jr, Todd RD, Reich T, Vannier M, Raichle ME: Subgenual prefrontal cortex abnormalities. Nature 1997; 386:824–827Crossref, Medline, Google Scholar
17. George MS, Ketter TA, Parekh PI, Rosinsky N, Ring HA, Pazzaglia PJ, Marangell LB, Callahan AM, Post RM: Blunted left cingulate activation in mood disorder subjects during a response interference task. J Neuropsychiatry Clin Neurosci 1997; 9:55–63Crossref, Medline, Google Scholar
18. Bonne O, Krausz Y, Gorfine M, Karger H, Gelfin Y, Shapira B, Chisin R, Lerer B: Cerebral hypoperfusion in medication resistant, depressed patients assessed by Tc99m HMPAO SPECT. J Affect Disord 1996; 41:163–171Crossref, Medline, Google Scholar
19. Bench CJ, Frackowiak RS, Dolan RJ: Changes in regional cerebral blood flow on recovery from depression. Psychol Med 1995; 25:247–261Crossref, Medline, Google Scholar
20. Ebmeier KP, Cavanagh JT, Moffoot AP, Glabus MF, O’Carroll RE, Goodwin GM: Cerebral perfusion correlates of depressed mood. Br J Psychiatry 1997; 170:77–81Crossref, Medline, Google Scholar
21. Bremner JD, Innis RB, Salomon RM, Staib LH, Ng CK, Miller HL, Bronen RA, Krystal JH, Duncan J, Rich D, Price LH, Malison R, Dey H, Soufer R, Charney DS: PET measurement of cerebral metabolic correlates of tryptophan depletion. Arch Gen Psychiatry 1997; 54:364–374Crossref, Medline, Google Scholar
22. Spitzer RL, Williams JBW, Gibbon M, First MB: Structured Clinical Interview for DSM-III-R, Version 1.0 (SCID). Washington, DC, American Psychiatric Press, 1990Google Scholar
23. Hamilton M: A rating scale for depression. J Neurol Neurosurg Psychiatry 1960; 23:56–62Crossref, Medline, Google Scholar
24. Gillin JC, Kripke DF, Janowsky DS, Risch SC: Effects of brief naps on mood and sleep in sleep-deprived depressed patients. Psychiatry Res 1989; 27:253–265Crossref, Medline, Google Scholar
25. Buchsbaum MS, Potkin SG, Siegel BV Jr, Lohr J, Katz M, Gottschalk LA, Gulasekaram B, Marshall JF, Lottenberg S, Tang CY, Abel L, Plon L, Bunney WE Jr: Striatal metabolic rate and clinical response to neuroleptics in schizophrenia. Arch Gen Psychiatry 1992; 49:966–974Crossref, Medline, Google Scholar
26. Buchsbaum MS, Sostek AJ: An adaptive-rate continuous performance test. Percept Mot Skills 1980; 51:707–713Crossref, Google Scholar
27. Matsui T, Hirano A: An Atlas of the Human Brain for Computerized Tomography. Tokyo, Igaku-Shoin, 1978Google Scholar
28. Talairach J, Tournoux P: Co-Planar Stereotaxic Atlas of the Human Brain. New York, Thieme Medical, 1988Google Scholar
29. Arndt S, Cizadlo T, Andreasen NC, Heckel D, Gold S, O’Leary DS: Tests for comparing images based on randomization and permutation methods. J Cereb Blood Flow 1996; 16:1271–1279Google Scholar
30. Heckel D, Arndt S, Cizadlo T, Andreasen NC: An efficient procedure for permutation tests in imaging research. Comp Biomed Res 1998; 31:164–171Crossref, Medline, Google Scholar
31. Shihabuddin L, Buchsbaum MS, Hazlett EA, Haznedar MM, Harvey PD, Newman A, Schnur DB, Spiegel-Cohen J, Wei T, Machac J, Knesaurek K, Vallabhojosula S, Singer MB, Ciaravolo TM, Luu-Hsia C: Dorsal striatal size, shape, and metabolic rate in neuroleptic-naive and previously medicated schizophrenic patients performing a verbal learning task. Arch Gen Psychiatry 1998; 55:235–243Crossref, Medline, Google Scholar
32. Haznedar MM, Buchsbaum MS, Metzger M, Solimando A, Spiegel-Cohen J, Hollander E: Anterior cingulate gyrus volume and glucose metabolism in autistic disorder. Am J Psychiatry 1997; 154:1047–1050Google Scholar
33. Devinsky O, Morrell MJ, Vogt BA: Contributions of anterior cingulate to behaviour. Brain 1995; 118:279–309Crossref, Medline, Google Scholar
34. Buchsbaum MS, Someya T, Wu JC, Tang CY, Bunney WE: Neuroimaging bipolar illness with positron emission tomography and magnetic resonance imaging. Psychiatr Ann 1997; 27:489–495Crossref, Google Scholar
35. Buchsbaum MS, Wu J, DeLisi LE, Holcomb H, Kessler R, Johnson J, King AC, Hazlett E, Langston K, Post RM: Frontal cortex and basal ganglia metabolic rates assessed by positron emission tomography with [18F]2-deoxyglucose in affective illness. J Affect Disord 1986; 10:137–152Crossref, Medline, Google Scholar
36. Ring HA, Bench CJ, Trimble MR, Brooks DJ, Frackowiak RS, Dolan RJ: Depression in Parkinson’s disease. Br J Psychiatry 1994; 165:333–339Crossref, Medline, Google Scholar
37. Mayberg HS, Starkstein SE, Sadzot B, Preziosi T, Andrezejewski PL, Dannals RF, Wagner HN Jr, Robinson RG: Selective hypometabolism in the inferior frontal lobe in depressed patients with Parkinson’s disease. Ann Neurol 1990; 28:57–64Crossref, Medline, Google Scholar
38. Mayberg HS, Starkstein SE, Peyser CE, Brandt J, Dannals RF, Folstein SE: Paralimbic frontal lobe hypometabolism in depression associated with Huntington’s disease. Neurology 1992; 42:1791–1797Google Scholar
39. Bromfield EB, Altshuler L, Leiderman DB, Balish M, Ketter TA, Devinsky O, Post RM, Theodore WH: Cerebral metabolism and depression in patients with complex partial seizures. Arch Neurol 1992; 49:617–623; correction, 49:976Crossref, Medline, Google Scholar
40. Petrovich GD, Risold PY, Swanson LW: Organization of projections from the basomedial nucleus of the amygdala. J Comp Neurol 1996; 374:387–420Crossref, Medline, Google Scholar
41. Azuma M, Chiba T: Afferent projections of the infralimbic cortex (area 25) in rats. Kaibogaku Zasshi 1996; 71:523–540Medline, Google Scholar
42. Takkagishi M, Chiba T: Efferent projections of the infralimbic (area 25) region of the medial prefrontal cortex in the rat. Brain Res 1991; 566:26–39Crossref, Medline, Google Scholar
43. Mayberg HS: Limbic-cortical dysregulation. J Neuropsychiatry Clin Neurosci 1997; 9:1–11Crossref, Medline, Google Scholar
44. Baxter LR Jr, Phelps ME, Mazziotta JC, Schwartz JM, Gerner RH, Selin CE, Sumida RM: Cerebral metabolic rates for glucose in mood disorders. Arch Gen Psychiatry 1985; 42:441–447Crossref, Medline, Google Scholar
45. Drevets WC, Videen TO, Price JL, Preskorn SH, Carmichael ST, Raichle ME: A functional anatomical study of unipolar depression. J Neurosci 1992; 12:3628–3641Google Scholar
46. Cohen RM, Semple WE, Gross M, Nordahl TE, King AC, Pickar D, Post RM: Evidence for common alterations in cerebral glucose metabolism in major affective disorders and schizophrenia. Neuropsychopharmacology 1989; 2:241–254Crossref, Medline, Google Scholar
47. Swerdlow NR, Koob GF: Dopamine, schizophrenia, mania, and depression. Behav Brain Sci 1987; 10:197–245Crossref, Google Scholar
48. Gerner RH, Post RM, Gillin JC, Bunney WE Jr: Biological and behavioral effects of one night’s sleep deprivation in depressed patients and normals. J Psychiatr Res 1979; 15:21–40Crossref, Medline, Google Scholar
49. Neumeister A, Praschak-Rieder N, Heßelmann B, Vitouch O, Rauh M, Barocka A, Tauscher J, Kasper S: Effects of tryptophan depletion in drug-free depressed patients who responded to total sleep deprivation. Arch Gen Psychiatry 1998; 55:167–172Crossref, Medline, Google Scholar
50. Rosel P, Arranz B, Vellejo J, Oros M, Crespo JM, Menchon JM, Navarro MA: Variations in [3H]imipramine and 5-HT2A but not [3H]paroxetine binding sites in suicide brains. Psychiatry Res Neuroimaging 1998; 82:161–170Crossref, Medline, Google Scholar