Response to Narendran and Frankle: The Interpretation of PET Microglial Imaging in Schizophrenia
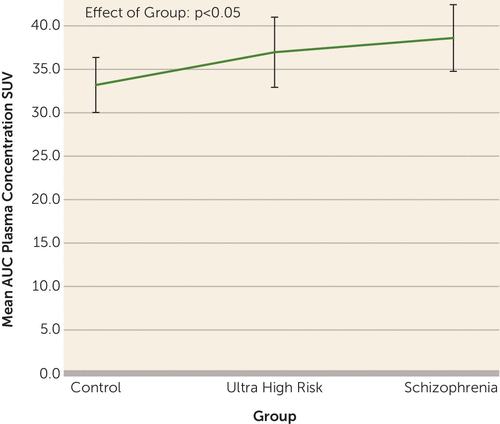
To the Editor: We thank Drs. Narendran and Frankle for their interest in our study (1) and for the opportunity to address the issues raised. The first issue is why we used distribution volume ratio and not distribution volume (VT) as the main outcome measure. VT measures rely on having reliable measurements of the plasma input function and on having no systematic group differences in free parent radiotracer plasma levels. For 18kD translocator-protein (TSPO) tracers, the free fraction is very small (<5%; approximately 2% in our study), making measurement unreliable (2). In addition, plasma proteins may bind to >50% of TSPO tracers in plasma (3). In disorders such as schizophrenia, where cytokine and acute phase protein levels in plasma are elevated, this binding would artifactually inflate the plasma input function, giving spuriously low VTs. In line with this, we see a group difference in the plasma input function (Figure 1; F=3.23, df=45, 2, p<0.05). Thus, VTs are likely to be unreliable on both counts. In contrast, distribution volume ratio is not affected by these problems, indicating that distribution volume ratio is to be preferred over VT. Distribution volume ratio has been validated in animals, where inflammatory stimuli increase distribution volume ratio and microglial markers (4). (For a further discussion of these issues, see [2].)

FIGURE 1. Group Differences in Plasma Concentration Valuesa
a Mean area under the curve (AUC) for free parent plasma concentration standardized uptake value (SUV) (adjusted for radioactivity injected and weight), by group. Error bars represent 95% CIs. There is a significant main effect of group on the mean AUC (F=3.23, df=45, 2, p<0.05).
The second issue raised is the choice of normalization region. The ideal region would be equivalent to gray matter tissue. However, for total gray matter, there is no other gray matter for reference. Identifying an ideal reference region is a challenge to the TSPO positron emission tomography field in general, particularly where microglial activation may be widespread. We fully agree that differences in tissue fractions complicate interpretation of our results, as discussed in the article. We conducted sensitivity analyses to determine if the results were driven by white matter differences. If this were the case, we would expect a scaling of distribution volume ratio when normalizing to white matter, but this was not the case (see Table S7 in the data supplement accompanying the online version of the original article). We found that the elevation in distribution volume ratio in frontal and temporal regions was robust using different reference regions (see Table S7). These additional analyses indicate our results are unlikely to be driven by differences in the reference regions, although future studies are needed to test this further.
Further issues raised are the large standard deviations and similar group means in the supplementary data (see Table S6 and Figure S3 in the online data supplement). These supplementary data are not corrected for TSPO genotype or age. It is recognized that there is an approximate 50% difference between carriers of high binding variants over heterozygotes, which is also seen in postmortem studies of schizophrenia (5) and explains the large standard variations. Age and genotype were corrected for in the primary analyses.
It is clear that further work is warranted to understand the TSPO signal and the role of microglia in schizophrenia. We hope that Narendran and colleagues will join us in this enterprise.
1 : Microglial activity in people at ultra high risk of psychosis and in schizophrenia: an [11C]PBR28 PET brain imaging study. Am J Psychiatry 2016; 173:44–52Link, Google Scholar
2 : The methodology of TSPO imaging with positron emission tomography. Biochem Soc Trans 2015; 43:586–592Crossref, Medline, Google Scholar
3 : The peripheral benzodiazepine receptor ligand PK11195 binds with high affinity to the acute phase reactant alpha1-acid glycoprotein: implications for the use of the ligand as a CNS inflammatory marker. Nucl Med Biol 2003; 30:199–206Crossref, Medline, Google Scholar
4 : PET imaging with [11C]PBR28 can localize and quantify upregulated peripheral benzodiazepine receptors associated with cerebral ischemia in rat. Neurosci Lett 2007; 411:200–205Crossref, Medline, Google Scholar
5 : A genetic polymorphism for translocator protein 18 kDa affects both in vitro and in vivo radioligand binding in human brain to this putative biomarker of neuroinflammation. J Cereb Blood Flow Metab 2013; 33:53–58Crossref, Medline, Google Scholar


