MRI Analysis of Cerebellar Vermal Abnormalities in Bipolar Disorder
Abstract
OBJECTIVE: The authors sought to expand previous findings of vermal abnormalities in bipolar disorder patients. METHOD: Magnetic resonance imaging (MRI) morphometry was used to quantify vermal subregion volumes in 18 subjects with first-episode bipolar disorder, 21 subjects with multiple-episode bipolar disorder, and 32 healthy subjects. RESULTS: Vermal subregion V2 volume was significantly smaller in multiple-episode bipolar disorder subjects than in first-episode patients and healthy subjects. Vermal subregion V3 was significantly smaller in multiple-episode bipolar disorder subjects than in healthy subjects. CONCLUSIONS: These results suggest that posterior-inferior cerebellar vermal abnormalities are present in patients with multiple-episode bipolar disorder.
Although the etiology of bipolar disorder remains unknown, investigation of brain regions associated with mood regulation may clarify the neuropathology of this illness. Recent evidence suggests that the midline cerebellum may be involved in mood regulation. Indeed, cerebellar vermal neurons project to many limbic brain regions, supporting its role in the hypothesized neuroanatomical networks that modulate mood (1). Moreover, there have been reports of secondary mania in patients with cerebellar lesions (2), and neuroimaging studies have identified cerebellar abnormalities in bipolar disorder patients (3). We previously reported decreased vermal region V3 area in patients with multiple prior episodes of mania compared with first-episode manic patients and healthy comparison subjects (3). However, this study was limited because it used only a single midsagittal image for vermal area measurement. Vermal area measurements do not correlate well with volumetric measurements, suggesting the importance of using volumetric measurements to measure the vermis (4). Therefore, in order to replicate and extend our previous findings, we performed volumetric analysis of the vermis using a different, larger sample. We hypothesized that multiple-episode bipolar disorder patients would have smaller vermal volumes than first-episode patients and healthy subjects.
Method
Two bipolar disorder inpatient groups were recruited: those hospitalized following their first manic episode who had no prior mood stabilizer or antipsychotic exposure (N=18) and those with at least two prior manic episodes (N=21). Patients were 16–35 years of age and met DSM-IV criteria for bipolar disorder, currently manic or mixed as determined with the Structured Clinical Interview for DSM-IV Patient Edition (5), administered by psychiatrists (M.P.D., C.M.A., S.M.S.) with established diagnostic reliability (kappa >0.90). Thirty-two demographically similar healthy subjects were recruited from the community. Inclusion and exclusion criteria for these subjects have been previously published (6).
Each subject (or, if under 18, the subject’s legal guardian) provided written informed consent after study procedures were explained. Subjects were competent to provide consent (or assent if under 18 years old) for the study. This study was approved by the investigational review boards of the University of Cincinnati and Children’s Hospital Medical Center.
MRI scans were obtained on a 1.5-T GE Signa scanner using a three-dimensional inversion-recovery-prepped fast spoiled gradient recall acquisition (TR=15 msec, TE=5 msec, TI=300 msec, flip angle=20°) (6). The axially acquired three-dimensional images were reformatted into coronal slices of 1.0-mm thickness. Morphometric analysis was performed by using BrainImage version 3.00. Region-of-interest measurements were obtained by a trained, blinded rater (N.P.M.) (kappa=0.96, 0.94, 0.90, and 0.90 for cerebellar hemispheres, V1, V2, and V3, respectively).
Total cerebral and cerebellar hemisphere volumes were measured as previously described (3). Vermal volume was obtained by locating the midsagittal slice, realigning the horizontal axis parallel to the fourth ventricle floor, and measuring, in the sagittal plane, every slice containing vermis. Vermis (V1, V2, and V3) was defined as tissue that appeared branched, devoid of cerebellar hemisphere and tonsil (3). Thresholding was used to assess the area of each region in each slice. Areas were then totaled to calculate volume for each vermal subregion (3).
There were no statistically significant correlations between the vermal subregions (V1, V2, V3) and total cerebral volume. However, there were statistically significant correlations between total cerebellar volume and V1 (r=0.45, df=69, p<0.001) and V3 (r=0.41, df=69, p=0.0003). Therefore, ratios of each vermal subregion to total cerebellar hemisphere volumes were compared by using separate ANOVAs. Tukey’s Studentized Range tests were then performed to determine which groups significantly differed. Multiple regression analysis was also performed on variables previously implicated in vermal volume reduction, including prior number of manic and depressive episodes and current and past exposure to antidepressants, mood stabilizers, and antipsychotics.
Results
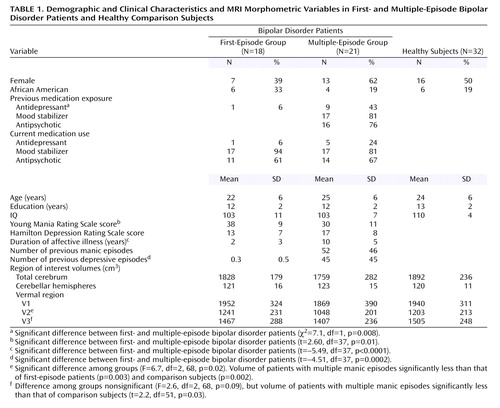
There were no statistically significant differences in demographic variables among groups (Table 1). There were no significant differences among groups in right, left, and total cerebellar volumes after adjusting for total cerebral volume. However, there was a statistically significant difference among groups in V2 volume (effect size, Cohen’s f=0.4). Specifically, subjects with multiple episodes had smaller V2 volumes compared with first-episode patients and healthy volunteers (Figure 1). There was a nonsignificant overall difference among groups in V3 volume (Cohen’s f=0.3). In our prior report we identified smaller V3 area in multiple-episode patients (3). Therefore, we performed t tests to assess whether the multiple-episode patients differed in V3 volume from first-episode patients or healthy subjects and found that multiple-episode patients had smaller V3 volumes than did healthy subjects (Table 1).
Within multiple-episode patients, past antidepressant exposure was the only statistically significant predictor of V3 volume (F=4.95, df=1, 10, p=0.05). V2 and V3 volumes were not significantly associated with any other predictor variables, including current antidepressant exposure and current and past mood stabilizer and antipsychotic exposure.
Discussion
In contrast to our prior report of vermal area, in which we found only V3 abnormalities in bipolar disorder patients, in the present study we identified V2, and possibly V3, volumetric abnormalities, suggesting posterior-inferior and possibly adjoining flocculonodular vermal abnormalities in bipolar disorder patients. These vermal regions project to the orbitomesial cortex, anterior cingulate gyrus, amygdala, hippocampal and dentate gyri, and pyriform and periamygdaloid cortical regions, as well as the hypothalamus, all of which are believed to regulate mood (7). In our prior investigation, V3 volume reduction was associated with number of prior episodes of depression (3). However, in that study, we failed to obtain information about antidepressant exposure. In the current study, we did not find significant relationships among vermal subregional volumes and prior number of episodes of mania or depression. However, we found an association between V3 volume and antidepressant exposure, suggesting our prior finding may have been an artifact of treatment for depression. Indeed, there have been several reports of antidepressant-induced cerebellar toxicity (8). There have been prior reports of cerebellar blood volume correlating with antipsychotic exposure (9). However, no associations among vermal volumes and antipsychotic exposure were identified in this study.
Limitations of this study include patients receiving multiple medications, no information on specific antidepressant classes, the cross-sectional design, and a relatively small number of subjects for examining associations among clinical and morphometric variables. In order to more definitively identify neuroanatomical changes that occur as bipolar disorder progresses, a prospective longitudinal study is needed. Nonetheless, our findings suggest that ongoing neuroimaging studies assessing vermal structure and function in bipolar patients are warranted.
 |
Received April 27, 2004; revision received Sept. 2, 2004; accepted Sept. 10, 2004. From the Center for Bipolar Disorders Research, Department of Psychiatry, University of Cincinnati College of Medicine. Direct all correspondence to Neil P. Mills, Center for Bipolar Disorders Research, Department of Psychiatry, University of Cincinnati College of Medicine, Cincinnati, OH 45267-0559; [email protected] (e-mail). Supported by a grant from the Stanley Medical Research Institute.

Figure 1. V2 Volume in First- and Multiple-Episode Bipolar Disorder Patients and Healthy Comparison Subjectsa
aIn the multiple-episode group, the data points marked as red dots with blue bars outside the interquartile range represent outliers deviating from normal distribution.
1. Strakowski SM, DelBello MP, Adler C, Cecil DM, Sax KW: Neuroimaging in bipolar disorder. Bipolar Disord 2000; 2:148–164Crossref, Medline, Google Scholar
2. Lauterbach EC: Bipolar disorders, dystonia, compulsion after dysfunction of the cerebellum, dentatorubrothalamic tract, and substantia nigra. Biol Psychiatry 1996; 40:726–730Crossref, Medline, Google Scholar
3. DelBello MP, Strakowski SM, Zimmerman ME, Hawkins JM, Sax KW: MRI analysis of the cerebellum in bipolar disorder: a pilot study. Neuropsychopharmacology 1999; 21:63–68Crossref, Medline, Google Scholar
4. Aylward EH, Reiss A: Area and volume measurement of posterior fossa structures in MRI. J Psychiatr Res 1991; 25:159–168Crossref, Medline, Google Scholar
5. First MB, Spitzer RL, Williams JBW, Gibbon M: Structured Clinical Interview for DSM-IV—Patient Edition (SCID-P). Washington, DC, American Psychiatric Press, 1995Google Scholar
6. Strakowski SM, DelBello MP, Zimmerman ME, Getz GE, Mills NP, Ret J, Shear P, Adler CM: Ventricular and periventricular structural volumes in first- versus multiple-episode bipolar disorder. Am J Psychiatry 2002; 159:1841–1847Link, Google Scholar
7. Anand BK, Malhotra CL, Singh B, Dua S: Cerebellar projections to limbic system. J Neurophysiol 1959; 22:451–457Crossref, Medline, Google Scholar
8. Fujino Y, Tsuboi Y, Shimoji E, Takahashi M, Yamada T: [Progressive cerebellar atrophy following acute antidepressant intoxication.] Rinsho Shinkeigaku 2000; 40:1033–1037 (Japanese)Medline, Google Scholar
9. Loeber RT, Gruber SA, Cohen BM, Renshaw PF, Sherwood AR, Yurgelun-Todd DA: Cerebellar blood volume in bipolar patients correlates with medication. Biol Psychiatry 2002; 51:370–376Crossref, Medline, Google Scholar