Randomized, Placebo-Controlled Trial of the Effects of Donepezil on Neuronal Markers and Hippocampal Volumes in Alzheimer’s Disease
Abstract
OBJECTIVE: The authors examined the effect of the acetylcholinesterase inhibitor donepezil on magnetic resonance markers of neurodegeneration in Alzheimer’s disease. METHOD: In this randomized, double-blind, placebo-controlled pilot study, 67 patients with mild to moderate Alzheimer’s disease received 24 weeks of treatment with donepezil (5 mg/day for the first 28 days and 10 mg/day thereafter) or placebo. Patients were reevaluated at 6-week intervals to measure change from baseline in several outcome measures, including right, left, and total hippocampal volumes, measured with magnetic resonance imaging; brain concentrations of N-acetylaspartate, measured with proton magnetic resonance spectroscopy; and cognition, assessed with the Alzheimer’s Disease Assessment Scale cognitive subscale. RESULTS: At some interim assessments, mean normalized measures of N-acetylaspartate concentration tended to be higher in the donepezil-treated patients than in the patients who received placebo, but these differences were not significant at endpoint. At endpoint, the donepezil-treated patients had significantly smaller mean decreases in total and right hippocampal volumes and a smaller, nearly significant mean decrease in left hippocampal volume, compared with the placebo-treated patients. Mean Alzheimer’s Disease Assessment Scale cognitive subscale scores were improved after treatment with donepezil, relative to placebo, at weeks 6, 12, 18, and 24. CONCLUSIONS: These preliminary results suggest that donepezil may have a potentially protective effect in Alzheimer’s disease. Larger, longer-term confirmatory studies of the medication’s effects are warranted.
Alzheimer’s disease, a progressive neurodegenerative dementia, is associated with hippocampal atrophy and loss of function of cortical neurons (1–4). Clinically, Alzheimer’s disease is characterized by progressive cognitive and functional deficits (1, 5). In addition, loss of cholinergic innervation to the cerebral cortex has been found, and this loss is the basis for using cholinesterase inhibitors to treat the symptoms of Alzheimer’s disease (6, 7). Currently, four such therapies have been approved by the United States Food and Drug Administration (tacrine, donepezil, rivastigmine, and galantamine) for use in treating mild to moderate Alzheimer’s disease, on the basis of their effects on clinical symptoms (7). However, few data are available on the in vivo effects of these agents on the pathognomic neurodegenerative changes in Alzheimer’s disease.
Newer magnetic resonance (MR) techniques permit quantitative evaluation of structural and metabolic changes in the brain in vivo, and these techniques have been used to monitor outcomes in neurologic conditions such as multiple sclerosis, head injury, and stroke (8–11). Quantitative measurements have shown that hippocampal volumes can be measured reliably in Alzheimer’s disease patients and that antemortem MRI measures of hippocampal atrophy correlate with the clinical severity of Alzheimer’s disease and with postmortem measures of hippocampal neuropathology (2, 12). Hippocampal volume loss occurs at a significantly faster rate in patients with early Alzheimer’s disease than in healthy comparison subjects, and therefore hippocampal volume measures may have prognostic value (12).
Proton magnetic resonance spectroscopy (1H-MRS) (11) enables noninvasive, in situ estimation of regional brain concentrations of metabolites, including N-acetylaspartate and myo-inositol, with a high degree of reproducibility. N-Acetylaspartate is of interest in Alzheimer’s disease studies because it is localized almost exclusively in neurons and their dendritic and axonal processes (10, 13–18). While its neurophysiologic effects are not confirmed, N-acetylaspartate is generally accepted to be a marker of the functional and structural integrity of neurons (10, 15). Traditionally, N-acetylaspartate reduction has been assessed to reflect loss of neurons. More recent studies have suggested that this assumption may be too simplistic (10), as N-acetylaspartate decreases have been related to neuronal dysfunction (11) and have also been shown to be reversible, e.g., after traumatic brain injury in rats (13). Reversible N-acetylaspartate reduction consonant with metabolic depression (reflected by l-deoxyglucose uptake) and mitochondrial α-glycerophosphate dehydrogenase activity has also been shown (13), and similar effects were observed in the penumbral area in animal models of stroke (14). In humans, reversible N-acetylaspartate changes after treatment have been observed in multiple sclerosis, HIV disease, and acute brain injury (19–21). Most cross-sectional in vivo MRS studies of Alzheimer’s disease patients have reported N-acetylaspartate reductions in the Alzheimer’s disease brain, compared with healthy subjects (15, 18), with longitudinal decline of N-acetylaspartate confirmed in a recent study (15). Postbaseline changes in N-acetylaspartate have been shown to correlate with cognitive decline in Alzheimer’s disease patients (15, 16). Furthermore, N-acetylaspartate levels have been observed to correlate with the densities of plaques and neurofibrillary tangles in Alzheimer’s disease patients in postmortem examinations (18). Reduction in N-acetylaspartate concentration is not specific to the Alzheimer’s disease process and has been reported in many other neurodegenerative conditions (19–21); as with volumetric measures, N-acetylaspartate concentration has been used as an outcome measure in trials of other neurological disorders (20, 21).
Changes in myo-inositol concentration have been attributed to cell membrane changes, but the precise functional role of myo-inositol is not known. In contrast to N-acetylaspartate concentrations, myo-inositol concentrations have been found in some, but not all, studies to be elevated in the gray and/or white matter of Alzheimer’s disease patients, relative to age-matched comparison subjects (22).
This preliminary study was conducted to examine the effects of donepezil on N-acetylaspartate concentration and hippocampal volume in patients with mild to moderate Alzheimer’s disease. To our knowledge, this is the first randomized, controlled trial in which MR measures of neuronal function and hippocampal atrophy have been used to assess the effects of cholinesterase inhibitor treatment in Alzheimer’s disease.
Method
Patients
Women (at least 2 years postmenopausal or surgically sterile) and men ≥50 years of age were eligible if they had a diagnosis of probable, mild to moderate, uncomplicated Alzheimer’s disease according to the DSM-IV-TR and National Institute of Neurological and Communicative Disorders and Stroke criteria (23). A Clinical Dementia Rating (24) of 1 (mild) or 2 (moderate), a Mini-Mental State Examination (MMSE) (25) score of 10–26, and a Hachinski score (26) of ≤4 were also required at both screening and baseline. In addition, patients had to be in generally good health, ambulatory, and with sufficient hearing and vision for compliance with testing procedures. Only patients able to undergo MRI evaluation (i.e., those without a pacemaker or other metal items within the body, those who were not claustrophobic) were enrolled. Patients with a primary diagnosis of psychiatric disorders other than Alzheimer’s disease, cerebrovascular disease, or any unstable medical condition were excluded. Concomitant psychotropic drugs were not allowed.
This study was carried out in accordance with the Declaration of Helsinki. Written informed consent was obtained from both the patient and the patient’s caregiver. The institutional review boards at Duke University Medical Center and the Medical University of South Carolina approved the study.
Protocol
This 24-week, randomized, double-blind, placebo-controlled, parallel-group study was followed by a 6-week, single-blind placebo washout period. Outpatients were randomly assigned by means of a computerized randomization schedule to receive either placebo or donepezil, administered once daily each evening during the 24-week treatment phase. Patients randomly assigned to the donepezil group received 5 mg/day for the first 28 days and 10 mg/day thereafter. Daily doses consisted of two identical tablets so as not to reveal the titration scheme: two placebo tablets throughout the study for the patients receiving placebo; one placebo tablet and one 5-mg donepezil tablet or two 5-mg donepezil tablets for the donepezil-treated patients. Patients were treated and evaluated clinically at three outpatient sites; all MR evaluations were conducted at a single site (Duke University).
Schedule
After giving written consent, patients received at screening a comprehensive medical examination (including medical history, physical examination, ECG), laboratory and psychometric evaluations (including assessment with the MMSE [25], Clinical Dementia Rating [24], and Alzheimer’s Disease Assessment Scale cognitive subscale [27]), and verification of the Alzheimer’s disease diagnosis. Screening occurred within the 21 days before patients began double-blind treatment. At baseline, the physical examination (including vital signs) and laboratory and psychometric evaluations were repeated, and an MRI/1H-MRS scan was performed; the first dose of study medication was then administered.
Patients were required to return at 6-week intervals (±3 days) for the following evaluations: routine physical examination, laboratory assessments (weeks 6 and 24 only), ECG (week 24 only), MRI/1H-MRS scan, psychometric assessment (with the Alzheimer’s Disease Assessment Scale cognitive subscale), medication compliance check, and adverse events monitoring. Patients withdrawing prematurely were requested to return for a final evaluation including psychometric assessment, adverse events evaluation, and an MRI/1H-MRS scan. Patients completing the 24-week, double-blind period entered the 6-week, single-blind, placebo washout period. At final visit (week 30), these patients underwent physical examination (including vital signs), laboratory tests, assessment with the Alzheimer’s Disease Assessment Scale cognitive subscale, and an MRI/1H-MRS scan.
Efficacy Assessments
The primary efficacy variable was the mean percent change from baseline in brain N-acetylaspartate concentrations. An analysis based on the slope of the change from baseline was preplanned; however, the nonlinearity of the findings supported the use of a more appropriate percent change from baseline analysis. Secondary efficacy variables included the Alzheimer’s Disease Assessment Scale cognitive subscale score, hippocampal volume, and brain myo-inositol concentrations.
Cognitive Function
Cognitive function was assessed by using the 11-item Alzheimer’s Disease Assessment Scale cognitive subscale, which tests areas of cognition such as memory, language, and praxis functions (increasing score denotes worsening), with scores ranging from 0 to 70. Psychometric assessment with the Alzheimer’s Disease Assessment Scale cognitive subscale was conducted by a trained clinical staff member.
MRI/1H-MRS Protocol
MRI and 1H-MRS studies were performed on a 1.5-T Signa system (General Electric Medical Systems, Milwaukee). Axial T1-weighted (repetition time/time to echo [TR/TE]: 24/5) three-dimensional gradient echo MRI was acquired with 1.5-mm contiguous slices (matrix=256×128, field of view=22 cm). The anatomic location at the level of the third ventricle, which provided cortical gray, periventricular, white, and subcortical gray matter in a single slice, was chosen for the 1H-MRS studies (28–30). Both the area under the curve and amplitude of the signals were determined. We have used this slice in previous studies of Alzheimer’s disease and social phobia (28–30).
The point resolved spectroscopy sequence was used to select a large voxel in order to suppress subcutaneous fat. In addition, three water-suppression pulses were used. Further localization was accomplished using two-dimensional chemical-shift imaging (field of view=22 cm, slice thickness=15 mm, 16×16 phase-encoding steps, TR/TE: 1,200/35 with 2,048 complex data points sampled over 2,500 Hz in the chemical-shift dimension). A non-water-suppressed scan was also obtained with the same spatial parameters (512 complex points, TR/TE: 800/35). At the end of the in vivo scan, an external reference spectrum was also taken on a phantom (“Braino”) by using a proton brain exam (PROBE-P, General Electric Medical Systems) sequence (TR/TE: 2,000/35, four reference scans and eight water-suppressed scans).
All analyses of MRI and MRS data were conducted by raters who were blind to the patients’ treatment groups.
MR Spectroscopic Analysis
Data analysis was carried out by using SAGE/IDL software (General Electric Medical Systems, Milwaukee). A 1-Hz exponential line broadening was applied in the chemical-shift dimension before three-dimensional fast Fourier transformation. The non-water-suppressed scan was used for chemical-shift and phase correction. The residual water signal was fitted by using a Hankel singular value decomposition algorithm and subtracted. The intensity, position, line width, and area of resonance peaks from N-acetylaspartate and myo-inositol were extracted from Marquardt fitting by using a model spectrum with Lorentzian lineshape. To avoid ambiguities caused by the use of metabolic ratios, the areas of N-acetylaspartate and myo-inositol were normalized to the external reference spectrum so that the normalized areas were direct measures of the absolute metabolite concentrations. We have previously demonstrated that the slice can be reliably identified and that MR spectra can be quantified in a reproducible manner (30).
Image Voxel Analysis
The 10 T1-weighted axial image slices (1.5-mm slice thickness) that constituted the chemical-shift imaging slice (15-mm slice thickness) were automatically segmented for white, gray, and CSF ratios by using GRIDCSI software, a stereology package developed in-house for segmenting chemical-shift imaging data. The segmentation results were used to further classify the chemical-shift imaging voxels according to brain region: subcortical gray matter, periventricular matter, cortical gray matter, and white matter. Concentrations were derived from the area under the curve for the metabolite peak in each voxel and were normalized to the external standard to adjust for day-to-day variation in 1H-MRS spectra acquisition.
The mean concentrations of N-acetylaspartate and myo-inositol, as well as the ratios of N-acetylaspartate and myo-inositol concentrations, were then obtained. The ratios are not reported; these data were similar to the concentration data but less informative.
Volumetric Analysis
Segmentation of the hippocampus poses a difficult problem in medical image analysis. No fully automated algorithm for hippocampus segmentation is evident in the literature. Existing algorithms require either varying amounts of landmark selection and/or delineation, or extensive postprocessing. Our method is a histogram-based morphometric region-growing algorithm that requires seeding of the hippocampus on multiple slices. Additional manual interaction involves restricting the region-growing to prevent leakage, as well as limited manual editing. Segmentation was performed by using the Region of Interest module within the Analyze 2.5 software package (31). Two trained raters segmented each image of the data set in a randomized, blinded study design with 20% of the data analyzed by both raters. This method has been validated elsewhere (29). The intraclass correlates coefficient was 0.93 for the right hippocampus and 0.92 for the left hippocampus.
Definition of Hippocampus
Measurement of the hippocampus began where the pulvinar nucleus of the thalamus obscured the crura fornicis. On the first few slices, the lateral body of the hippocampus appears as a rough oval, which narrows medially into a thin strip of gray matter that curves downward along the border of the cistern. The fimbria, which extends from the superior surface of the hippocampus across the CSF into the white matter, was transected at its narrowest point. Along the medial border of the hippocampus, the thin strip of gray matter was cut at its narrowest point. On more anterior slices, the amygdala begins to appear just superior to the hippocampus, which roughly resembles a kidney in shape, with no external connections. The amygdala-hippocampal transition zone appears as a diffuse area of gray matter between the anterior portion of the hippocampus and the posterior portion of the amygdala; as with the fimbria, this area was transected at its narrowest point, which was usually found between the inferior lateral ventricles and the cistern. The anterior border of the hippocampus was defined as the slice on which the inferior lateral ventricles appeared horizontally without any body of gray matter visible below them (32).
Safety
Safety was assessed by physical examination, clinical laboratory tests, monitoring of treatment-emergent adverse events (33), and evaluation of general health/well-being. Reports of adverse events were elicited at scheduled visits.
Statistical Methods
Efficacy analyses are described for the intent-to-treat patient group, which included all patients who were randomly assigned to treatment, received at least one dose of study medication, had relevant efficacy data at baseline, and provided postbaseline data. Observed-case analyses were used for evaluating N-acetylaspartate concentrations, whereas both observed-case and endpoint analyses were used for evaluating hippocampal volume and data from the Alzheimer’s Disease Assessment Scale cognitive subscale. Endpoint values were determined by using last-observation-carried-forward analysis at week 24, i.e., the last postbaseline value was carried forward for patients missing a week-24 assessment. Week 24 was used as the endpoint because the week-24 visit was the subjects’ last visit while taking the study medication. Hippocampal volumes were analyzed both with and without adjustment for total brain volumes. Since this study had a within-subject design, the unadjusted volumes are reported.
The mean percent changes from baseline in N-acetylaspartate and myo-inositol concentrations were compared between treatment groups by using unpaired t tests and confirmed by using nonparametric analyses (Wilcoxon test). Differences between groups for the mean postbaseline changes in scores on the Alzheimer’s Disease Assessment Scale cognitive subscale were compared by using analysis of covariance. Analyses of safety parameters were based on reports for all patients who provided data; changes from baseline between groups were compared by using Student’s t test. The incidences of treatment-emergent adverse events and clinically significant abnormal laboratory values were analyzed by using Fisher’s exact test.
Results
Patient Disposition
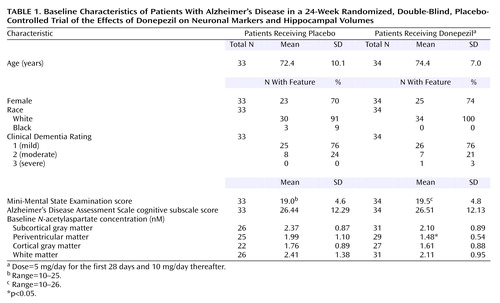
A total of 67 patients (34 patients who received donepezil and 33 patients who received placebo) were enrolled and received study medication (Figure 1). The two treatment groups were comparable with respect to mean age, gender, severity of symptoms, and race (Table 1).
Of the 67 patients enrolled, 51 (76%) completed the study. In the placebo group, 10 (30%) of 33 patients discontinued the study prematurely, compared with six (18%) of 34 donepezil patients (Figure 1). No patients in the donepezil group and one patient in the placebo group discontinued due to adverse events.
Efficacy
Hippocampal volumes were measured at baseline and week 24. Table 2 shows the data on hippocampal volumes for both treatment groups. The patients who received placebo demonstrated decreases in right and total hippocampal volumes at week 24 and endpoint, relative to the baseline measure, with a similar trend for left hippocampal volume. The decrease in hippocampal volume by endpoint in the donepezil-treated patients was generally smaller than that in the patients who received placebo. Total hippocampal volume decreased by 8.2% in the placebo group, compared with 0.4% in the donepezil group (p<0.01, unpaired t test). For the right hippocampus, the decline in the placebo group was 7.6%, compared with a 1.4% increase in the donepezil group (p<0.02, unpaired t test). For the left hippocampus, the decline in the placebo group was 7.8%, compared with 1.7% for the donepezil group (p=0.09, unpaired t test). The mean baseline total hippocampal volume was 2252.9 mm3 (SD=767.1) for the placebo group, compared with 1993.7 mm3 (SD=756.3) for the donepezil group. At the end of the study the mean total hippocampal volume had decreased to 2109.9 mm3 (SD=177.0) in the placebo group, compared with a small change to 1965.8 mm3 (SD=217.0) in the donepezil group.
The mean percent change in normalized measures of N-acetylaspartate concentration for the four individual brain regions examined (subcortical gray, periventricular, cortical, and white matter) are shown in Figure 2. Although there was some variability in the N-acetylaspartate results for the individual brain sections, the overall pattern of change in the donepezil group was consistent: brain N-acetylaspartate concentrations tended to increase progressively to maximum values at week 12 or 18. Thereafter, values were lower, but most remained above baseline. In contrast, brain N-acetylaspartate concentrations in the placebo group tended to remain near baseline values or to decrease slightly throughout the study. The difference in mean percent change from baseline inN-acetylaspartate concentrations between the donepezil and placebo groups was significant for subcortical gray matter at week 12 (p<0.03, unpaired t test) and for periventricular matter at week 12 (p<0.02, unpaired t test) and week 18 (p<0.03, unpaired t test) (Figure 2). The between-group differences in N-acetylaspartate concentrations at weeks 24 and 30 failed to reach significance. The results for the fully evaluable patients were similar to those for the patients in the intent-to-treat analysis. Myo-inositol concentrations tended to increase with treatment, but no significant between-group differences were found in the brain regions examined (Figure 3).
Cognitive function, as assessed by the Alzheimer’s Disease Assessment Scale cognitive subscale, improved in the donepezil group concurrently with the increase in brain N-acetylaspartate concentrations and deteriorated in the placebo group throughout the double-blind treatment period (Figure 4). The differences between the groups were statistically significant at weeks 6, 12, 18, and 24 (all p<0.05, analysis of covariance). For the placebo group, a significant relationship was found between percent change from baseline in N-acetylaspartate concentration in noncortical gray matter and change from baseline scores on the Alzheimer’s Disease Assessment Scale cognitive subscale (r=0.42, df=24, p=0.03). Similar trends were found for other regions, but the correlations did not reach significance.
Safety
No statistically significant differences between the two treatment groups were found in the overall incidence of adverse events (85% in the placebo group and 94% in the donepezil group) or in the incidence of any specific event.
Discussion
The main findings of this study were that treatment with placebo was associated with relative declines in neuronal concentrations of N-acetylaspartate, relative loss of hippocampal volume, and relative cognitive decline. In contrast, treatment with donepezil was associated with relative increases in neuronal N-acetylaspartate concentrations in some brain regions (between weeks 6 and 18) and a relatively greater preservation of hippocampal volume. In addition, as expected, donepezil treatment was associated with significantly greater improvements in cognition, relative to placebo, at every time point throughout the study.
The pattern of improvement in cognition in the donepezil group is very similar to that observed in pivotal trials and supports the validity of this study as well as the efficacy of donepezil (34, 35). The mechanisms responsible for the increase in N-acetylaspartate concentrations and the slowing of the reduction in hippocampal volume associated with donepezil treatment are uncertain. Indeed, the formulation of hypotheses concerning how donepezil might slow neurodegeneration/disease progression in Alzheimer’s disease is complicated by the fact that the mechanisms responsible for neuronal loss in Alzheimer’s disease are largely unknown.
Increasing evidence suggests that decline in N-acetylaspartate concentrations after neurologic insults is reversible. Patients recovering from acute demyelinating lesions have shown substantial recovery of N-acetylaspartate concentrations as their clinical status improves (19). The initiation of retroviral therapy in patients with AIDS dementia complex has also been reported to reverse the loss of N-acetylaspartate (21). In addition, antipsychotic drugs have been shown to cause a relative increase in the volume of the caudate nucleus (36), and hippocampal atrophy in Cushing’s syndrome has also been shown to reverse with treatment (37).
It is possible that increased functioning of neurons in donepezil-treated patients, due to the cholinomimetic properties of this therapy, mediates the observed increase in N-acetylaspartate as well as the slowing of hippocampal volume reduction. Increased neuronal functioning might also account for the improvements in cognition associated with donepezil treatment. Alternatively, the observed effects might reflect stabilization in the number of neurons and/or an increase in the volume of neurons.
Another possible mechanism by which donepezil could exert its effects involves processing of the amyloid precursor protein, which is associated with the formation of amyloid plaques. In Alzheimer’s disease, abnormal proteolytic processing of amyloid precursor protein is thought to result in the formation of neurotoxic 39–43 amino acid β-amyloid, which may induce apoptosis (38) and in turn may disrupt neural connectivity by the formation of plaques. In vitro evidence has suggested that cholinesterase inhibitors enhance the release of nonamyloidogenic, neurotrophic/neuroprotective amyloid precursor protein and decrease the formation of amyloidogenic amyloid precursor protein. Svensson and Nordberg (39) reported that tacrine and donepezil, at clinically relevant concentrations, attenuated β-amyloid (25–35 amino acid)-induced toxicity in rat PC12 cells. Speculatively, attenuation of amyloid toxicity may slow the neurodegenerative process and thus stabilize hippocampal volume.
Cholinesterases are expressed around the amyloid plaques and neurofibrillary tangles in the Alzheimer’s disease brain (40). Cholinesterases may also function as cell-cell or cell-substrate adhesion molecules and, thus, might be involved in maintaining the structure and integrity of amyloid plaques and neurofibrillary tangles. If so, cholinesterase inhibition may slow the progression of dementia. At present, much of the evidence for the involvement of cholinesterase inhibitors in amyloid precursor protein processing comes from postmortem, in vitro, and experimental animal studies.
The current findings must be considered in light of the study’s limitations. This pilot study included a relatively small number of patients, and it was therefore not powered to detect small effects. Because of the exploratory nature of the study, the analyses made no adjustment for multiple comparisons. The relatively large variance in N-acetylaspartate concentrations may explain why we found differences in some regions but not in the cortical region, which was a composite average of several different cortical areas. The changes in hippocampal volume reported here are greater than those reported by other authors and may reflect the particular study group and/or the analytic methods used. Additional placebo-controlled studies with larger numbers of patients are warranted to confirm and expand these findings. The results of this study, along with several other recent MR studies in Alzheimer’s disease, support the feasibility of using MRI and 1H-MRS as outcome measures in dementia treatment trials. The finding of reversibility in N-acetylaspartate concentrations is also of theoretical interest because it suggests that it might be premature to consider N-acetylaspartate concentrations as simply a reflection of neuronal number or density. Rather, N-acetylaspartate concentrations may reflect both neuronal function and content. The evaluation of N-acetylaspartate along with hippocampal volume in future Alzheimer’s disease studies could be of value in understanding disease progression and the effects of various treatments (41).
In summary, our findings raise the possibility that donepezil has a beneficial effect on brain structure. Donepezil treatment was associated with significantly increased concentrations of N-acetylaspartate in two brain regions, less reduction in hippocampal volume, and significant cognitive improvements, compared with placebo. These results, while clearly needing confirmation, suggest that in addition to providing cognitive benefits, donepezil may also slow the short-term progression of hippocampal atrophy in Alzheimer’s disease.
 |
 |
Received Sept. 5, 2002; revision received May 27, 2003; accepted May 29, 2003. From the Departments of Psychiatry and Radiology, Duke University Medical Center; the Department of Psychiatry, Medical University of South Carolina, Charleston, S.C.; and Eisai Inc., Teaneck, N.J. Address reprint requests to Dr. Krishnan, Department of Psychiatry, Duke University Medical Center, Durham, NC 27710; [email protected] (e-mail).Supported by grants from Eisai Inc., Teaneck, N.J., and Pfizer Inc., New York. The authors thank PPS International Communications for administrative assistance with the manuscript and figures. Drs. Krishnan, Charles, Doraiswamy, Mintzer, and Weisler have received grants and honoraria from Eisai Inc., and Pfizer Inc. Mr. Perdomo and Dr. Ieni are employees of Eisai Inc.; Dr. Rogers was an employee of Eisai Inc., when the study was done.

Figure 1. Trial Progression of Patients With Alzheimer’s Disease Randomly Assigned to 24 Weeks of Double-Blind Treatment With Donepezila or Placebo
aDose=5 mg/day for the first 28 days and 10 mg/day thereafter.
bUnacceptable baseline 1H-MRS evaluations or caregiver decisions.

Figure 2. Change From Baseline in N-Acetylaspartate Concentrations in the Subcortical Gray, Periventricular, Cortical, and White Matter Areas of the Brain of Patients With Alzheimer’s Disease Randomly Assigned to 24 Weeks of Double-Blind Treatment With Donepezila or Placebo
aDose=5 mg/day for the first 28 days and 10 mg/day thereafter.
bSignificant difference between groups (p<0.03, unpaired t test).
cSignificant difference between groups (p<0.02, unpaired t test).
dSignificant difference between groups (p<0.03, unpaired t test).

Figure 3. Change From Baseline in Myo-Inositol Concentrations in the Subcortical Gray, Periventricular, Cortical, and White Matter Areas of the Brain of Patients With Alzheimer’s Disease Randomly Assigned to 24 Weeks of Double-Blind Treatment With Donepezila or Placebo
aDose=5 mg/day for the first 28 days and 10 mg/day thereafter.

Figure 4. Change From Baseline in Alzheimer’s Disease Assessment Scale Cognitive Subscale Scores of Patients With Alzheimer’s Disease Randomly Assigned to 24 Weeks of Double-Blind Treatment With Donepezila or Placebo
aDose=5 mg/day for the first 28 days and 10 mg/day thereafter.
bSignificant difference between groups (p<0.003, analysis of covariance [ANCOVA]).
cSignificant difference between groups (p<0.007, ANCOVA).
dSignificant difference between groups (p<0.04, ANCOVA).
eSignificant difference between groups (p<0.02, ANCOVA).
fSignificant difference between groups (p<0.04, ANCOVA).
1. Cummings JL, Cole G: Alzheimer disease. JAMA 2002; 287:2335–2338Crossref, Medline, Google Scholar
2. Jack CR Jr, Peterson RC, Xu Y, O’Brien PC, Smith GE, Ivnik RJ, Boeve BF, Tangalos EG, Kokmen E: Rates of hippocampal atrophy correlate with change in clinical status in aging and AD. Neurology 2000; 55:484–489Crossref, Medline, Google Scholar
3. Scahill RI, Schott JM, Stevens JM, Rossor MN, Fox NC: Mapping the evolution of regional brain atrophy in Alzheimer’s disease. Proc Natl Acad Sci USA 2002; 99:4135–4137Crossref, Medline, Google Scholar
4. Silverman DH, Small GW, Chang CY, Lu CS, Kung De Aburto MA, Chen W, Czernin J, Rapoport SI, Pietrini P, Alexander GE, Schapiro MB, Jagust WJ, Hoffman JM, Welsh-Bohmer KA, Alavi A, Clark CM, Salmon E, de Leon MJ, Mielke R, Cummings JL, Kowell AP, Gambhir SS, Hoh CK, Phelps ME: Positron emission tomography in evaluation of dementia: regional brain metabolism and long-term outcome. JAMA 2001; 286:2120–2127Crossref, Medline, Google Scholar
5. McLendon B, Doraiswamy PM: Defining meaningful change in Alzheimer’s disease trials. J Geriatr Psychiatry Neurol 1999; 12:39–48Crossref, Medline, Google Scholar
6. Mayeux R, Sano M: Treatment for Alzheimer’s disease. N Engl J Med 1999; 341:1670–1679Crossref, Medline, Google Scholar
7. McLendon BM, Chen GC, Doraiswamy PM: Current and future treatments for cognitive deficits in dementia. Curr Psychiatry Rep 2000; 2:20–23Crossref, Medline, Google Scholar
8. Filipi M, Dousset V, McFarland HF, Miller DH, Grossman RI: Role of MRI in the diagnosis and monitoring of multiple sclerosis: consensus report of the White Matter Study Group. J Magn Reson Imaging 2002; 15:499–504Crossref, Medline, Google Scholar
9. Albers GW: Advances in thrombolytic therapy for treatment of acute stroke. Neurology 2001; 57:S77-S81Google Scholar
10. Baslow MH: Functions of N–acetyl-l–aspartate and N–acetyl-l–aspartylglutamate in the vertebrate brain: role in glial cell-specific signalling. J Neurochem 2000; 75:453–459Crossref, Medline, Google Scholar
11. Dautry C, Vaufrey F, Brouillet E, Bizat N, Henry PG, Conde F, Bloch G, Hantraye P: Early N–acetylaspartate depletion is a marker of neuronal dysfunction in rats and primates chronically treated with the mitochondrial toxin 3-nitropropionic acid. J Cereb Blood Flow Metab 2000; 20:789–799Crossref, Medline, Google Scholar
12. Jack CR Jr, Dickson DW, Parisii JE, Xu YC, Cha RH, O’Brien PC, Edland SD, Smith GE, Boeve BF, Tangalos EG, Kokmen E, Petersen RC: Antemortem MRI findings correlate with hippocampal neuropathology in typical aging and dementia. Neurology 2002; 58:750–757Crossref, Medline, Google Scholar
13. Gasparovic C, Arfai N, Smid N, Feeney DM: Decrease and recovery of N–acetylaspartate/creatine in rat brain remote from focal injury. J Neurotrauma 2001; 18:241–246Crossref, Medline, Google Scholar
14. Demougeot C, Garnier P, Mossiat C, Bertrand N, Giroud M, Beley A, Marie C: N–Acetylaspartate, a marker of both cellular dysfunction and neuronal loss: its relevance to studies of acute brain injury. J Neurochem 2001; 77:408–415Crossref, Medline, Google Scholar
15. Jessen F, Block W, Traber F, Keller E, Flacke S, Lamerichs R, Schild HH, Heun R: Decrease of N–acetylaspartate in the MTL correlates with cognitive decline of AD patients. Neurology 2001; 57:930–932Crossref, Medline, Google Scholar
16. Mohanakrishnan P, Fowler AH, Vonsattel JP, Husain MM, Jolles PR, Liem P, Komoroski RA: An in vitro 1H nuclear magnetic resonance study of the temporoparietal cortex of Alzheimer brains. Exp Brain Res 1995; 102:503–510Crossref, Medline, Google Scholar
17. Adalsteinsson E, Sullivan EV, Kleinhans N, Spielman DM, Pfefferbaum A: Longitudinal decline of the neuronal marker N–acetyl aspartate in Alzheimer’s disease. Lancet 2000; 355:1696–1697Crossref, Medline, Google Scholar
18. Jaarsma D, Veenma-van der Duin L, Korf J: N–Acetylaspartate and N–acetylaspartylglutamate levels in Alzheimer’s disease post-mortem brain tissue. J Neurol Sci 1994; 127:230–233Crossref, Medline, Google Scholar
19. De Stefano N, Matthews PM, Arnold DL: Reversible decreases in N–acetylaspartate after acute brain injury. Magn Reson Med 1995; 34:721–727Crossref, Medline, Google Scholar
20. Gonen O, Catalaa I, Babb JS, Ge Y, Mannon LJ, Kolson DL, Grossman RI: Total brain N–acetylaspartate: a new measure of disease load in MS. Neurology 2000; 54:15–19Crossref, Medline, Google Scholar
21. Vion-Dury J, Nicoli F, Salvan AM, Confort-Gouny S, Dhiver C, Cozzone PJH: Reversal of brain metabolic alterations with zidovudine detected by proton localised magnetic resonance spectroscopy. Lancet 1995; 345:60–61Crossref, Medline, Google Scholar
22. Parnetti L, Lowenthal DT, Presciutti O, Pelliccioli GP, Palumbo R, Gobbi G, Chiarini P, Palumbi B, Tarducci R, Senin U: 1H-MRS, MRI-based hippocampal volumetry, and 99mTc-HMPAO-SPECT in normal aging, age-associated memory impairment, and probable Alzheimer’s disease. J Am Geriatr Soc 1996; 44:133–138Crossref, Medline, Google Scholar
23. McKhann G, Drachman D, Folstein M, Katzman R, Price D, Stadlan EM: Clinical diagnosis of Alzheimer’s disease: report of the NINCDS-ADRDA Work Group under the auspices of the Department of Health and Human Services Task Force on Alzheimer’s Disease. Neurology 1984; 34:939–944Crossref, Medline, Google Scholar
24. Hughes CP, Berg L, Danziger WL, Coben LA, Martin RL: A new clinical scale for the staging of dementia. Br J Psychiatry 1982; 140:566–572Crossref, Medline, Google Scholar
25. Folstein MF, Folstein SE, McHugh PR: “Mini-Mental State”: a practical method for grading the cognitive state of patients for the clinician. J Psychiatr Res 1975; 12:189–198Crossref, Medline, Google Scholar
26. Hachinski VC, Illif LD, Zilhka E, Du Boulay GH, McAllister VL, Marshall J, Russell RW, Symon L: Cerebral blood flow in dementia. Arch Neurol 1975; 32:632–637Crossref, Medline, Google Scholar
27. Rosen WG, Mohs RC, Davis KL: A new rating scale for Alzheimer’s disease. Am J Psychiatry 1984; 141:1356–1364Link, Google Scholar
28. Tupler LA, Davidson JR, Smith RD, Lazeyras F, Charles HC, Krishnan KR: A repeat proton magnetic resonance spectroscopy study in social phobia. Biol Psychiatry 1997; 42:419–424Crossref, Medline, Google Scholar
29. Lazeyras F, Charles HC, Tupler LA, Erickson R, Boyko OB, Krishnan KR: Metabolic brain mapping in Alzheimer’s disease using proton magnetic resonance spectroscopy. Psychiatry Res 1998; 82:95–106Crossref, Medline, Google Scholar
30. Charles HC, Lazeyras F, Tupler LA, Krishnan KR: Reproducibility of high spatial resolution proton magnetic resonance spectroscopic imaging in the human brain. Magn Reson Med 1996; 35:606–610Crossref, Medline, Google Scholar
31. Styner MA, Charles HC, Park J, Gerig G: Multi-site validation of image analysis methods—assessing intra and inter-site variability, in SPIE Proceedings, vol 4684. Bellingham, Wash., International Society for Optical Engineering, 2002, pp 278–286Google Scholar
32. Steffens DC, Payne ME, Greenberg DL, Byrum CE, Welsh-Bohmer KA, Wagner HR, MacFall JR: Hippocampal volume and incident dementia in geriatric depression. Am J Geriatr Psychiatry 2002; 10:62–71Crossref, Medline, Google Scholar
33. COSTART: Coding Symbols for Thesaurus of Adverse Reaction Terms, 4th ed: Publication PB93–209138. Washington, DC, US Food and Drug Administration, Center for Drug Evaluation and Research, Office of Epidemiology and Biostatistics, 1993Google Scholar
34. Rogers SL, Doody RS, Mohs RC, Friedhoff LT: Donepezil improves cognition and global function in Alzheimer’s disease: a 15-week, double-blind, placebo-controlled study. Arch Intern Med 1998; 158:1021–1031Crossref, Medline, Google Scholar
35. Rogers SL, Farlow MR, Doody RS, Mohs R, Friedhoff LT: A 24-week, double-blind, placebo-controlled trial of donepezil in patients with Alzheimer’s disease. Neurology 1998; 50:136–144Crossref, Medline, Google Scholar
36. Doraiswamy PM, Tupler LA, Krishnan KR: Neuroleptic treatment and caudate plasticity (letter). Lancet 1995; 345:1250; correction, 345:734–735Google Scholar
37. Starkman MN, Giordani B, Gebarski SS, Berent S, Schork MA, Schteingart DE: Decrease in cortisol reverses human hippocampal atrophy following treatment of Cushing’s disease. Biol Psychiatry 1999; 46:1595–1602Crossref, Medline, Google Scholar
38. Ivins KJ, Thornton PL, Rohn TT, Cotman CW: Neuronal apoptosis induced by beta-amyloid is mediated by caspase-8. Neurobiol Disord 1999; 6:440–449Crossref, Medline, Google Scholar
39. Svensson AL, Nordberg A: Tacrine and donepezil attenuate the neurotoxic affect of A beta(25–35) in rat PC12 cells. Neuroreport 1998; 9:1519–1522Crossref, Medline, Google Scholar
40. Small DH, Michaelson S, Sberna G: Non-classical actions of cholinesterases: role of cellular differentiation, tumorigenesis and Alzheimer’s disease. Neurochem Int 1996; 28:453–483Crossref, Medline, Google Scholar
41. Doraiswamy PM, Chen JG, Charles HC: Brain magnetic resonance spectroscopy: role in assessing outcomes in Alzheimer’s disease. CNS Drugs 2000; 14:457–472Crossref, Google Scholar