Estimated Neuronal Populations and Volumes of the Hippocampus and Its Subfields in Schizophrenia
Abstract
OBJECTIVE: It has been suggested that the primary focus of the pathological process in schizophrenia is on the limbic system, and there have been several postmortem reports of changes in the histological structure or volume of the hippocampus, as well as a larger number of MRI reports of volume reductions. There are conflicting findings, however, with both techniques. METHOD: The authors conducted a study of the gross and subfield structure and cellular composition of the hippocampus in postmortem brains from 30 patients with DSM-IV-diagnosed schizophrenia (13 women, 17 men) and 29 comparison subjects with no psychopathology (14 women, 15 men). Stereological sampling procedures were applied to 25-μm-thick coronal paraffin sections taken at 5-mm intervals throughout the formalin-fixed hippocampus. Subfields were defined as the dentate fascia, the hilus (CA4), an amalgamation of the CA2 and CA3 subfields, the CA1 subfield, and the subiculum. Volumes, cell densities, and cell numbers of the subfields were assessed microscopically, and the volume of the hippocampus was estimated from both photographs and histological slides of the coronal slices. RESULTS: As assessed from histologically stained slides, the volumes of the hippocampus and its subfields did not differ between patients and comparison subjects. Left-sided reduction in hippocampal volumes estimated from photographs, which may have included parahippocampal tissue, was not confirmed on histological examination. No significant differences were observed between patients and comparison subjects in the cellular composition of the hippocampus. CONCLUSIONS: These findings do not support a primary alteration of the hippocampus in schizophrenia.
The hippocampal formation and adjacent brain regions have been the focus of much neuropathological and neuroimaging research in schizophrenia. However, there is, as yet, no clear consensus on whether changes in these brain regions occur in schizophrenia and whether, if they do, they are unilateral or bilateral. For example, on the basis of a review of MRI studies, Nelson et al. (1) concluded that “schizophrenia is associated with a bilateral volumetric reduction of the hippocampus and probably of the amygdala as well,” whereas, from a review of postmortem studies, Dwork (2) concluded that existing studies “provide little conclusive evidence for the neural substrate of schizophrenia.” However, the generally larger sample size in neuroimaging studies might give them greater power to detect a small effect (approximately 4% according to Nelson et al. [1]). If, indeed, the hippocampus is reduced in volume in schizophrenia, then it must be asked whether this reduction is more than a reflection of the global volume reduction seen in the brains of patients with schizophrenia (3, 4).
The literature is consistent in finding no evidence of hippocampal enlargement in schizophrenia. Where a reduction is found to be lateralized, it has been on the left (5–8). Only neuropathological studies have been able to assess whether there are changes in volume of the hippocampal subfields, but the findings are inconsistent (2).
Against this background we have undertaken a study of hippocampal neuropathology in which we have estimated volumes and neuron numbers and densities of the hippocampus and its subfields on both sides in the brains of 30 patients with schizophrenia and 29 comparison subjects with no psychopathology. We have adhered to stereological principles (9–11) in this study.
Method
Postmortem brains were collected from patients and comparison subjects for whom the next of kin had provided consent to use of tissues in medical research in conformity with existing hospital and coroner’s (medical examiner’s) procedures. Clinical notes were assessed by a psychiatrist (T.J.C. or Dr. Stephen J. Cooper from Queen’s University, Belfast) to ensure that the comparison brains were free of psychopathology and that there was clear evidence that the patients met DSM-IV criteria for schizophrenia or schizoaffective disorder.
Brains were fixed by suspension from the basilar artery in 10% formalin for a minimum of 4 weeks in three different centers around the United Kingdom. All brains were examined by a neuropathologist (B.M.) who was blind to diagnosis and gender, who confirmed that they were free of substantial neuropathology (including Alzheimer’s disease [12], Parkinson’s disease, or stroke).
It proved impossible to obtain brains from men and women of comparable ages because the female patients were older at death (Table 1). To avoid this confound, age was entered into all analyses as a covariate.
The brains were carefully stripped of the leptomeninges and coded so that measurements were performed blind. The temporal lobes were dissected away from the rest of the brain and sliced into 5-mm-thick coronal slices throughout their entire length; thus, the entirety of the hippocampus was available for histology. The posterior aspect of these slices was photographed with a ruler in the field of view to allow an enlargement factor to be calculated. Each slice was embedded in paraffin wax, and a 25-μm-thick section was cut from the anterior face, mounted onto coated slides, stained with cresyl violet and Luxol fast blue, and coverslipped.
We then delineated the outlines of the hippocampus and five cytoarchitecturally defined hippocampal subfields using a Wild stereomicroscope (Wild, Heidelberg, Germany) in the manner described by West and Gundersen (11): 1) the dentate fascia, 2) the hilus (CA4), 3) an amalgamation of the CA2 and CA3 subfields (hereafter CA2/3), 4) the CA1 subfield, and 5) the subiculum. The structure of the hippocampus and its components is illustrated in Figure 1.
Measurement of the Hippocampal Subfield Volumes
For the cell-containing regions of each hippocampal subfield, with the exception of the dentate, the cross-sectional area was measured on each slide on which it appeared by randomly positioning over it an acetate film printed with a 1-mm-square grid of test points. This was examined under the stereomicroscope, and the number of points falling over each cell-containing region was counted. For each region, the counts for all the slides from each temporal lobe were summed and multiplied by the thickness of each slice (5 mm) and a factor to correct for shrinkage during histological preparation (1.31). This was repeated, and the mean of the two measures was calculated.
Point-counting with the 1-mm grid was found to be an inefficient method of measurement of volume for the dentate fascia because of its long, thin profile (a similar conclusion was reached by West et al. [13]). Therefore, the dentate fascia volume was measured with an Olympus BX50 microscope (Olympus Optical Co., Southall, Middlesex, U.K.) with a related technique. Using the Vernier gauges fitted to the microscope stage, we examined the slide in a search pattern that corresponded to a 0.5 × 0.5-mm-square grid. At each position, the slide was examined at high power (×60 objective), and if the center of the field of view fell over the dentate fascia, this point was counted. This was repeated for all slides, and the total number of counts was summed for each hippocampus. The total volume of the dentate fascia was calculated by multiplying the count by the interval between the slides (5 mm), 0.25 (the area, in square millimeters, that each count corresponded to), and a factor to account for shrinkage during histological processing (1.31).
Measurement of Hippocampal Cell Density and Number
The cell density in the subfields was measured by using optical dissectors (9, 10). Each subfield was examined at specific, discrete points in a raster search pattern with an Olympus BX50 microscope using a ×60 objective. At each such point the microscope was focused at a plane within the section near its upper surface, and the image was viewed real-time on a computer monitor through a JVC TK-1070E video camera (JVC UK, London) mounted on the microscope. A stereological counting frame was superimposed over the video image. The plane of focus was then pushed down a depth of 12 μm through the tissue section, and the cell nucleoli that came into focus were counted according to unbiased stereological counting rules (9, 10). Nucleoli were not counted if they were already in focus before the focal plane was pushed through the section. The mean number of cells counted per unit volume was calculated, giving an estimate of the mean cell density within each subfield on each side for each case. For the dentate fascia cell, nuclei were counted rather than nucleoli. The size of the counting frame was 90 μm × 69 μm for the hilus, CA2/3, CA1, and subiculum and 50 μm × 39 μm for the dentate.
The search pattern was 0.5 mm × 0.5 mm for the dentate fascia; 1 mm × 1 mm for the hilus, CA2/3, and subiculum; and 1 mm × 2 mm for the CA1 subfield. Only pyramidal cells were counted in the hilus, CA2/3, CA1, and subiculum. Only granule cells were counted in the dentate fascia. Oligodendrocytes and astrocytes were not counted.
Measurement of the Whole Hippocampal Volume and Cell Number
The cross-sectional area of the hippocampus as a whole was measured in both hemispheres from both the photographs of the coronal slabs and the stained microscope slides.
The photographs of the temporal lobe sections were projected at an approximate magnification of ×2.3 onto a randomly positioned test grid of points in a 1-cm-square array. For each slice, the number of points falling on the hippocampus was counted. These counts were then summed for the entire lobe and multiplied by the enlargement factor and thickness of each slice (5 mm) to give an estimate of volume. For these measures the hippocampus was defined as suggested by Duvernoy (14): the anterior margin was defined as the boundary at which the head was invaginated by the posterior portion of the amygdala. The posterior slice was at the transformation of hippocampal body into tail at the level of the splenium. Medially, the junction between the hippocampal formation and the parahippocampal gyrus was at the most medial point of the uncal sulcus, coinciding with the apex of the parahippocampal gyrus.
Acetate printed with the 1-mm-square test grid was used to measure the whole hippocampal volume from the stained microscope slides in an identical manner to that described for the subfields. The total number of cells in the hippocampus was assessed by summing the total cell number for all five subfields.
Statistical Analyses
The first statistical analyses examined the efficacy of the measurement protocol. The observed coefficient of error for the individual estimates of subfield volume, cell density, and cell number as described by Gundersen and Jensen (15) and West and Gundersen (11) was calculated for each case. The observed coefficient of error is an index of the covariability of measures made from a particular hippocampus across the slices and thus is a measure of both accuracy and reliability. Mean values were calculated for each measurement for each subject group (female comparison, male comparison, female schizophrenia, male schizophrenia). From the values of the observed coefficient of error, the percentage of observed relative variance of each measure accounted for by true interindividual variance (as opposed to noise) was estimated (11, 16).
In addition, the group coefficient of error (SEM/mean) was calculated. The group coefficient of error gives an estimate of the accuracy of the estimate of the mean calculated for each subject group. The lower the value of this ratio, the more accurate is the measure of the mean.
The statistical analyses of the effect of schizophrenia on the hippocampus proceeded in two stages and was performed by using the Proc MIXED procedure of SAS for Macintosh, version 6.12 (SAS, Cary, N.C.). The first stage investigated the subfields. The second stage investigated the measurements of total volume and cell number of the hippocampus as a whole.
The data for the five subregions were analyzed with a series of three repeated measures analyses of variance (ANOVAs): one each for subfield volume, cell density, and cell number. Side and subfield were within-subjects factors, diagnosis and gender were between-subjects factors, and age was a covariate. We tested for only main effects of gender and effects involving diagnosis. Given the large number of effects tested for, we decided to accept as significant only those results which yielded p<0.01. Box’s M tests were performed before analysis to ensure that the data from the different subject groups were of homogeneous variance.
The data for the hippocampus as a whole (total volume and number of cells) were analyzed in a series of three repeated measures ANOVAs, one each for photographically defined hippocampal volume, histologically defined hippocampal volume, and total hippocampal cell number. Side was the within-subjects factor, gender and diagnosis were between-subjects factors, and age was a covariate.
Results
Subfield Volumes, Cell Densities, and Cell Numbers
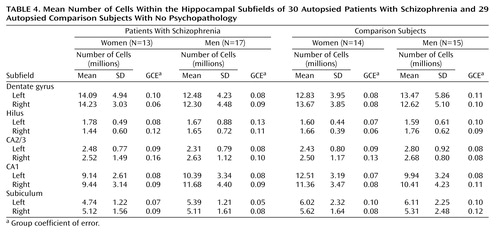
The mean subfield volumes, cell densities, and number of cells are given in Table 2, Table 3, and Table 4, respectively. In addition, the group coefficients of error are cited.
Accuracy
For the subfield volumes, the mean values of the observed coefficient of error for the comparison group ranged from 0.10 to 0.21 (data not shown). The observed coefficient of error assesses accuracy and reliability: the lower the value, the better (see Statistical Analyses in the Method section). True interindividual variation accounted for between 48.1% and 91.1% of the observed variance, with the exception of the right dentate for the female comparison subjects, for which there was low variation. Interindividual variation for this group accounted for only 8.9% of the observed relative variance. However, the group coefficient of error was sufficiently small (0.05) to suggest that an accurate estimate of the group mean had been attained.
For the subfield cell densities, the values of the observed coefficient of error ranged from 0.04 to 0.10 (data not shown). True interindividual variation accounted for between 67.6% and 94.8% of the observed variance. For the subfield total number of cells, the values of the observed coefficient of error ranged from 0.11 to 0.22 (data not shown). True interindividual variation accounted for between 56.3% and 92.0% of the variance, with the exception of the right hilus for the female comparison subjects, for which there was low variation. Interindividual variation for this group accounted for only 33.3% of the observed relative variance. However, the group coefficient of error was sufficiently small (0.06) to suggest that an accurate estimate of the group mean had been attained.
Effect of Gender, Diagnosis, and Side
The subfield volume data were subjected to a natural logarithm transformation before analysis to eradicate an inhomogeneity of variance as demonstrated by Box’s M test (M=303.09, F=1.20, df=165, 6108, p=0.04). There was no effect of diagnosis or gender and no diagnosis-by-gender, diagnosis-by-side, or diagnosis-by-gender-by-side interactions (all F<2.44, df=1, 54, p>0.12). There were no diagnosis-by-subfield, diagnosis-by-gender-by-subfield, diagnosis-by-side-by-subfield, or diagnosis-by-gender-by-side-by-subfield interactions (all F<1.45, df=4, 54, p>0.23).
For the cell density, there was no effect of diagnosis or gender and no diagnosis-by-gender, diagnosis-by-side, or diagnosis-by-gender-by-side interactions (all F<1.49, df=1, 54, p≥0.23). There were no diagnosis-by-subfield, diagnosis-by-gender-by-subfield, diagnosis-by-side-by-subfield, or diagnosis-by-gender-by-side-by-subfield interactions (all F<1.35, df=4, 54, p>0.26).
The cell number data were subjected to a square root transformation before analysis to eradicate inhomogeneities of variance demonstrated by a Box’s M test (M=307.14, F=1.22, df=165, 6108, p=0.03). There were no effects of diagnosis or gender and no diagnosis-by-gender, diagnosis-by-side, or diagnosis-by-gender-by-side interactions (all F<1.90, df=1, 54, p>0.17). There were no interactions of diagnosis-by-subfield, diagnosis-by-gender-by-subfield, diagnosis-by-side-by-subfield, or diagnosis-by-gender-by-side-by-subfield (all F<2.26, df=4, 54, p>0.07).
Volumes and Neuron Number in the Whole Hippocampus
The means and group coefficients of error of the whole hippocampal volumes (as measured from both the histological slides and the photographic images) and the total number of cells in the hippocampus are shown in Table 5. The mean values of the volume measures from the photographs and histologically prepared sections are shown in bar charts in Figure 2 and Figure 3.
The values of the observed coefficient of error for the histologically defined hippocampal volumes ranged from 0.07 to 0.10 (data not shown). For the photographically defined hippocampal volumes, the values of the observed coefficient of error ranged from 0.08 to 0.09 (data not shown). True interindividual variation accounted for more than 60% of the observed relative variance for all measures of hippocampal volume.
The data for the measures of the whole volume of the hippocampus were analyzed by repeated measures ANOVA, with gender and diagnosis as across-subjects factors, age as a covariate, and side as a within-subjects factor.
For the histologically defined whole hippocampal volume, there were no main effects of diagnosis or gender and no diagnosis-by-gender interactions (all F<0.84, df=1, 54, p>0.36). There were no diagnosis-by-side or diagnosis-by-gender-by-side interactions (both F=2.04, df=1, 55, p>0.16).
For the photographically defined whole hippocampal volume, there were no main effects of diagnosis or gender and no diagnosis-by-gender interactions (all F<3.01, df=1, 52, p>0.09). There was no diagnosis-by-gender-by-side interaction (F=0.93, df=1, 53, p>0.34). There was, however, a significant diagnosis-by-side interaction (F=4.68, df=1, 53, p<0.04). This corresponded to the fact that comparison subjects had greater left than right hippocampal volume; a left-sided reduction in volume reversed this difference in schizophrenia. Examination of Figure 3 reveals that this pattern is also evident when the hippocampi were histologically defined, although to a lesser extent that did not attain statistical significance.
There were no significant effects of the number of cells within the hippocampus as a whole (all F<1.64, df=1, 54 or 1, 55, p>0.21).
Power
The negative results obtained raise questions regarding the power of the study. The first point to observe is that even if a level of alpha=0.05 had been used, the study outcome would not have altered. An analysis using the G Power program (17) was performed to determine the power of the current study to detect 10% smaller mean values of all measures in schizophrenia (before any transformation) with alpha set at 0.05. For the subfield measures, adequate power was demonstrated for both volume (1–beta=0.71), and neuron density (1–beta=0.87). The power was poor, however, for measures of neuron number (1–beta=0.57). There was good power for histologically defined whole hippocampal volume (1–beta=0.77). The power was poor for photographically defined volume (1–beta=0.63) and total neuron number (1–beta=0.51).
Influence of Other Factors
To investigate the potential effects of leucotomy and the intergroup differences in the duration spent in fixative, the analyses of covariance (ANCOVAs) for the effects of diagnosis, gender, and side were repeated with the four brains that had undergone leucotomy removed from the analysis and with fixation duration as a covariate. This did not affect the outcome of any of the statistical analyses. Furthermore, the regression analysis of the effect of duration in fixative revealed no significant effect of this variable (all F<1.06, df=1, 49, p>0.31).
The potential effect of neuroleptic medication was also assessed. The effect of this factor on the whole hippocampal volume and total hippocampal cell number was assessed in a series by repeated measures ANCOVAs on the data from the brains of patients with schizophrenia. In these analyses, side was a within-subjects factor, gender and medication level (average or more than average) were between-subjects factors, and age was a covariate. There were no significant effects for the histologically defined hippocampal volume or the total hippocampal cell number. For the subfields, three repeated measures ANOVAs were performed (one for each data set). These revealed no significant effect of neuroleptic and no interaction of neuroleptic with any combination of gender, side, or subfield. There was a significant neuroleptic-by-side interaction (F=5.65, df=3, 25, p=0.004) in the volume of the photographically defined hippocampus: the left-sided (but not right-sided) volume in patients who had been given more than the average levels of medication was greater than the left-sided volume in those who had been given average levels of medication.
Discussion
To our knowledge, this is the second study in which both left and right hippocampi from relatively large groups of comparison subjects without psychopathology and subjects with schizophrenia have been measured using stereological principles. The first was that of Heckers et al. (18). Our main finding is that the hippocampus of patients with schizophrenia does not differ from that of comparison subjects with no psychopathology in its volume or cell number as a whole, nor in the volume, neuron density, or number of neurons of its subfields. The exception to the similarity between the normal and schizophrenic hippocampus was that the left whole hippocampus volume estimated from photographs of the brain slices was smaller in the brains of patients with schizophrenia than in the brains of comparison subjects. A possible interpretation of this difference is that the cytoarchitectural definition of the hippocampus is more accurate than a definition based on photographs, which may include some parahippocampal tissue. We note that studies of the parahippocampal gyrus (19–22) have found a reduction in schizophrenia that is generally more marked on the left relatively consistently. It is also noteworthy that the only other stereological volumetric study using histological delineation (18) also found no significant differences between the hippocampi of normal subjects and those with schizophrenia.
Our finding of no effect of schizophrenia raises the question of statistical power. However, even if a less conservative criterion for declaring statistical significance (i.e., p<0.05) had been used throughout the study, there would have been no difference in outcome. In addition, the study was found to have good power to detect differences corresponding to 10% lower mean values for subfield volume, cell density, and whole volume of the hippocampus in schizophrenia as delineated cytoarchitecturally. Power was less good for estimates of neuron number. However, since any alteration in hippocampal number implies an alteration in volume or cell density, both of which were assessed with good power, the neuron number was satisfactorily addressed. Power was poor for the measurement of hippocampal volume from the photographic material, possibly reflecting the greater difficulty in accurate delineation of the structure with this method.
The finding of a normal hippocampus in schizophrenia agrees with the findings of earlier neuropathological studies by Heckers et al. (18, 23), Altshuler et al. (21) and Bruton et al. (24) but conflicts with those of Bogerts et al. (19), Falkai and Bogerts (25), and Jeste and Lohr (26). However, as noted by Dwork (2), when abnormalities are reported they are inconsistent between studies. Given the size of our study group, the power of the study, and the relative objectivity of the stereological techniques we have adopted, we believe that the burden of the literature, including our own findings, is consistent with the null hypothesis that hippocampal structure is unaffected in schizophrenia.
This study has been performed on a series of the brains of comparison subjects and patients on which reports have already been published regarding cortical surface asymmetry (27), temporal lobe length (28), sulcogyral pattern (28), superior temporal volume (29), fusiform and parahippocampal gyrus volume (22), and corpus callosum and anterior commissure size, fiber density, and fiber number (30, 31). In these analyses, significant disease-specific differences were found that are absent in the present study, indicating that the hippocampus is less affected than these structures in schizophrenia. It has been suggested (e.g., by Torrey and Peterson [32]) that the primary focus of the pathology in schizophrenia is on the limbic system and that this could account for the pleomorphic nature of the symptoms. The normality of the hippocampus and the fornix, its output pathway (33), in the present study argues against this conclusion.
 |
 |
 |
 |
 |
Received Jan. 11, 2000; revision received July 9, 2001; accepted Oct. 17, 2001. From the Medical Research Council/Prince of Wales International Centre for Research (POWIC) Schizophrenia Research Group, Department of Neuropathology, Radcliffe Infirmary, Oxford, UK; the Department of Mathematics and Statistics, Birkbeck College, London; and POWIC, University Department of Psychiatry, Warneford Hospital. Address reprint requests to Dr. Crow, POWIC, University Department of Psychiatry, Warneford Hospital, Headington, Oxford, OX3 7JX, UK; [email protected] (e-mail). Supported by grant G 9220033 from the U.K. Medical Research Council (Drs. Crow and Esiri). J.R. Highley was supported by a Ph.D. studentship from the U.K. Medical Research Council. The authors thank Drs. S.J. Cooper and B.M. Herron of the Queen’s University of Belfast and Mrs. R. Brown and the late Dr. C.J. Bruton of the Department of Neuropathology, Runwell Hospital, for their help in obtaining and documenting some of the brain tissue in this study.

Figure 1. Transverse Section of the Body of the Hippocampus Showing Divisions Between CA4 and CA3, CA2 and CA1, and CA1 and the Subiculuma
aThe purple bar marks the division between CA4 and CA3. The blue arrow marks the division between CA2 and CA1, and the red arrow marks the division between CA1 and the subiculum. The margin of the subiculum is at the left-hand margin of the figure.

Figure 2. Volume of the Hippocampus as Measured From Photographic Images of 30 Autopsied Patients With Schizophrenia and 29 Autopsied Comparison Subjects With No Psychopathology

Figure 3. Volume of the Hippocampus as Measured From Histological Stained Microscope Slides for 30 Autopsied Patients With Schizophrenia and 29 Autopsied Comparison Subjects With No Psychopathology
1. Nelson MD, Saykin AJ, Flashman LA, Riordan HJ: Hippocampal volume reduction in schizophrenia as assessed by magnetic resonance imaging. Arch Gen Psychiatry 1998; 55:433-440Crossref, Medline, Google Scholar
2. Dwork AJ: Post-mortem studies of the hippocampal formation in schizophrenia. Schizophr Bull 1997; 23:385-402Crossref, Medline, Google Scholar
3. Ward KE, Friedman L, Wise A, Schulz SC: Meta-analysis of brain and cranial size in schizophrenia. Schizophr Res 1996; 22:197-213Crossref, Medline, Google Scholar
4. Wright IC, Rabe-Hesketh S, Woodruff PWR, David AS, Murray RM, Bullmore ET: Meta-analysis of regional brain volumes in schizophrenia. Am J Psychiatry 2000; 157:16-25Link, Google Scholar
5. Bogerts B, Ashtari M, Degreef G, Alvir JMJ, Bilder RM, Lieberman J: Reduced temporal limbic structure volumes on magnetic resonance images in first episode schizophrenia. Psychiatry Res Neuroimaging 1990; 35:1-13Crossref, Medline, Google Scholar
6. Breier A, Buchanan RW, Elkashef A, Munson K, Kirkpatrick B, Gellad F: Brain morphology and schizophrenia: a magnetic resonance imaging study of limbic, prefrontal cortex, and caudate structures. Arch Gen Psychiatry 1992; 49:921-926Crossref, Medline, Google Scholar
7. Shenton ME, Kikinis R, Jolesz F, Pollak SD, Le May M, Wible CG, Hokama H, Martin J, Metcalf D, Coleman M, McCarley RW: Abnormalities of the left temporal lobe and thought disorder in schizophrenia. N Engl J Med 1992; 327:604-612Crossref, Medline, Google Scholar
8. Rossi A, Stratta P, Mancini F, Gallucci M, Mattei P, Core L, Di Michele V, Casacchia M: Magnetic resonance imaging findings of amygdala-anterior hippocampal shrinkage in male patients with schizophrenia. Psychiatry Res 1994; 52:43-53Crossref, Medline, Google Scholar
9. Gundersen HJG, Bendtsen TF, Korbo L, Marcussen N, Moller A, Nielsen K, Nyengaard JR, Pakkenberg B, Sorensen FB, Vesterby A, West MJ: Some new, simple and efficient stereological methods and their use in pathological research and diagnosis. APMIS 1988; 96:379-394Crossref, Medline, Google Scholar
10. Gundersen HJG, Bagger P, Bendtsen TF, Evans SM, Korbo L, Marcussen N, Moller A, Nielsen K, Nyengaard JR, Pakkenberg B, Sorensen I, Vesterby A, West MJ: The new stereological tools: disector, fractionator, nucleator, and point sampled intercepts and their use in pathological research and diagnosis. APMIS 1988; 96:857-881Crossref, Medline, Google Scholar
11. West MJ, Gundersen HJG: Unbiased stereological estimation of the number of neurons in the human hippocampus. J Comp Neurol 1990; 296:1-22Crossref, Medline, Google Scholar
12. Mirra SS, Heyman A, McKeel D, Sumi SM, Crain BJ, Brownlee LM, Vogel FS, Hughes JP, van Belle G, Berg L: The Consortium to Establish a Registry for Alzheimer’s Disease (CERAD), part II: standardization of the neuropathologic assessment of Alzheimer’s disease. Neurology 1991; 41:479-486Crossref, Medline, Google Scholar
13. West MJ, Coleman PD, Flood DG, Troncoso JC: Differences in the pattern of hippocampal neuronal loss in normal ageing and Alzheimer’s disease. Lancet 1994; 344:769-772Crossref, Medline, Google Scholar
14. Duvernoy HM: The Human Hippocampus: An Atlas of Applied Anatomy. Munich, JF Bergman Verlag, 1988Google Scholar
15. Gundersen HJG, Jensen EB: The efficiency of systematic sampling in stereology and its prediction. J Microsc 1987; 147:229-263Crossref, Medline, Google Scholar
16. West MJ: New stereological methods for counting neurons. Neurobiol Aging 1993; 14:275-285Crossref, Medline, Google Scholar
17. Buchner A, Faul F, Erdfelder E: G Power: A Priori, Post Hoc, and Compromise Power Analyses for the Macintosh, Version 2.1.2. Trier, Germany, University of Trier, 1997Google Scholar
18. Heckers S, Heinsen H, Geiger B, Beckmann H: Hippocampal neuron number in schizophrenia: a stereological study. Arch Gen Psychiatry 1991; 48:1002-1008Crossref, Medline, Google Scholar
19. Bogerts B, Meerts E, Schonfeldt-Bausch R: Basal ganglia and limbic system pathology in schizophrenia: a morphometric study of brain volume and shrinkage. Arch Gen Psychiatry 1985; 42:784-791Crossref, Medline, Google Scholar
20. Brown R, Colter N, Corsellis JAN, Crow TJ, Frith CD, Jagoe R, Johnstone EC, Marsh L: Postmortem evidence of structural brain changes in schizophrenia: differences in brain weight, temporal horn area, and parahippocampal gyrus compared with affective disorder. Arch Gen Psychiatry 1986; 43:36-42Crossref, Medline, Google Scholar
21. Altshuler LL, Casanova MF, Goldberg TE, Kleinman JE: The hippocampus and parahippocampus in schizophrenic, suicide, and control brains. Arch Gen Psychiatry 1990; 47:1029-1034; correction, 1991; 48:422Google Scholar
22. McDonald B, Highley JR, Walker MA, Herron BM, Cooper SJ, Esiri MM, Crow TJ: Anomalous asymmetry of fusiform and parahippocampal gyrus gray matter in schizophrenia: a postmortem study. Am J Psychiatry 2000; 157:40-47Link, Google Scholar
23. Heckers S, Heinsen H, Heinsen YC, Beckmann H: Limbic structures and lateral ventricle in schizophrenia: a quantitative postmortem study. Arch Gen Psychiatry 1990; 47:1016-1022Crossref, Medline, Google Scholar
24. Bruton CJ, Crow TJ, Frith CD, Johnstone EC, Owens DG, Roberts GW: Schizophrenia and the brain: a prospective clinico-neuropathological study. Psychol Med 1990; 20:285-304Crossref, Medline, Google Scholar
25. Falkai P, Bogerts B: Cell loss in the hippocampus of schizophrenics. Eur Arch Psychiatry Neurol Sci 1986; 236:154-161Crossref, Medline, Google Scholar
26. Jeste DV, Lohr JB: Hippocampal pathologic findings in schizophrenia: a morphometric study. Arch Gen Psychiatry 1989; 46:1019-1024Crossref, Medline, Google Scholar
27. Highley JR, Esiri MM, McDonald B, Cortina-Borja M, Cooper SJ, Herron BM, Crow TJ: Anomalies of cerebral asymmetry in schizophrenia interact with gender and age of onset: a post-mortem study. Schizophr Res 1998; 34:13-25Crossref, Medline, Google Scholar
28. Highley JR, Esiri MM, McDonald B, Cooper SJ, Crow TJ: Temporal-lobe length is reduced, and gyral folding is increased in schizophrenia: a post-mortem study. Schizophr Res 1998; 34:1-12Crossref, Medline, Google Scholar
29. Highley JR, McDonald B, Walker MA, Esiri MM, Crow TJ: Schizophrenia and temporal lobe asymmetry: a postmortem stereological study of tissue volume. Br J Psychiatry 1999; 175:127-134Crossref, Medline, Google Scholar
30. Highley JR, Esiri MM, McDonald B, Cortina-Borja M, Herron BM, Crow TJ: The size and fibre composition of the corpus callosum with respect to gender and schizophrenia: a post-mortem study. Brain 1999; 122:99-110Crossref, Medline, Google Scholar
31. Highley JR, Esiri MM, McDonald B, Walker MA, Crow TJ: The size and fibre composition of the anterior commissure with respect to gender and schizophrenia. Biol Psychiatry 1999; 45:1120-1127Crossref, Medline, Google Scholar
32. Torrey EF, Peterson MR: Schizophrenia and the limbic system. Lancet 1974; 2:942-946Crossref, Medline, Google Scholar
33. Chance SA, Highley JR, Esiri MM, Crow TJ: Fiber content of the fornix in schizophrenia: lack of evidence for a primary limbic encephalopathy. Am J Psychiatry 1999; 156:1720-1724Abstract, Google Scholar