Proton Magnetic Resonance Spectroscopy of the Medial Prefrontal Cortex in Patients With Deficit Schizophrenia: Preliminary Report
Abstract
OBJECTIVE: Proton magnetic resonance spectroscopy (1H-MRS) was used to study medial prefrontal metabolic impairments in schizophrenic patients with the deficit syndrome. METHOD: The subjects were 22 schizophrenic patients categorized as deficit (N=5) or nondeficit (N=17) and 21 healthy subjects. 1H-MRS was performed for the right and the left medial prefrontal cortex. RESULTS: The patients with the deficit syndrome had significantly lower ratios of N-acetylaspartate to creatine plus phosphocreatine than did the healthy subjects or nondeficit patients. CONCLUSIONS: As N-acetylaspartate levels could reflect neuronal density and/or viability, this finding suggests a neuronal loss in the medial prefrontal cortex of deficit patients.
Proton magnetic resonance spectroscopy (1H-MRS) can measure levels of cerebral metabolites such as N-acetylaspartate, which has been described as a neuronal/axonal marker, choline, which is known to increase in myelin breakdown, and myo-inositol, a glial cell marker whose increase could reflect a gliosis. Studies with 1H-MRS in schizophrenia have shown contradictory findings (1–3), which could be due to heterogeneous patient groups. Therefore, the aim of this study was to examine, with a single-voxel spectroscopy technique, whether a low ratio of N-acetylaspartate to creatine is associated with primary and enduring negative symptoms in schizophrenic patients with the deficit syndrome (4).
METHOD
The Schedule for the Deficit Syndrome (5) was used to evaluate 22 right-handed schizophrenic patients (DSM-IV) without history of head injury, past or present neurological disorders, alcoholism, or drug abuse. Five were categorized as having the deficit syndrome, and 17 were categorized as nondeficit. We matched 21 healthy subjects with the patients for age, educational level, sex, and handedness. None of the comparison subjects had any history of the lifetime psychiatric disorders evaluated with the National Institute of Mental Health Diagnostic Interview Schedule (6), organic illness, alcoholism, or drug abuse. After complete description of the study to the subjects, written informed consent was obtained.
1H-MRS was performed on a General Electric Signa 1.5-T MRI system with a standard quadrature head coil. Proton spectra were obtained from an 8-cm3 voxel in the medial prefrontal cortex including the anterior cingulate region. The spectra were obtained by using a stimulated echo acquisition mode (STEAM) sequence (TE/TR=30 msec/1500 msec).
Repeated measures analysis of variance (ANOVA) was used to test the metabolite differences between groups (deficit versus nondeficit versus healthy). Post hoc pairwise comparisons with Bonferroni correction were used to identify which group differences accounted for the significant overall F value (Bonferroni/Dunn tests). A separate repeated measures ANOVA with the same factors was performed to compare untreated and treated patients. All of these tests were two tailed, and results were considered significant with probability levels of p<0.05. Correlations between metabolite ratios and length of illness (time between first episode and time of evaluation), dose of antipsychotic in chlorpromazine equivalents, and level of exposure to antipsychotic medications (chlorpromazine-equivalent dose times years of exposure) were performed by Spearman tests.
RESULTS
One patient was drug naive, and four had been free of medication for at least 6 months. Among the treated patients, two without and three with the deficit syndrome were receiving atypical neuroleptics. Each of the treated patients was in a stable phase, defined by no change in dose of antipsychotic medication for 2 months.
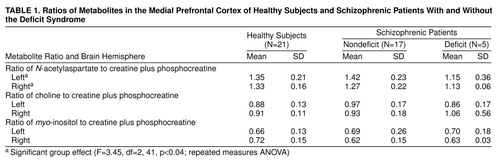
The deficit and nondeficit schizophrenic patients did not differ significantly in age, age at onset of illness, or duration of illness. ANOVA showed a significant difference in N-acetylaspartate/creatine among the healthy subjects, schizophrenic patients with the deficit syndrome, and nondeficit patients (Table 1). Post hoc analyses showed that the deficit patients had significantly lower ratios of N-acetylaspartate/creatine than the healthy subjects (p=0.01) and the nondeficit patients (p=0.009). No difference in myo-inositol/creatine or choline/creatine was observed among the deficit patients, nondeficit patients, and healthy subjects. No difference in any metabolite ratio was noted between the untreated and treated patients. No significant correlation was found between any metabolite ratio and length of illness, dose of medication, or level of exposure to antipsychotics.
DISCUSSION
The major finding was a lower N-acetylaspartate/creatine ratio in the prefrontal cortex of the patients with the deficit syndrome than in the healthy subjects and nondeficit patients. As N-acetylaspartate could reflect neuronal density, this result suggests a neuronal loss in the prefrontal cortex of deficit patients, supporting previous results showing hypofrontality in deficit schizophrenia (7). This finding is also consistent with that of Shioiri et al. (8), who found, by using 31P-MRS, that abnormalities in phosphomonoesters and β-ATP were related to the severity of negative symptoms but not specifically to primary negative symptoms. A lower than normal N-acetylaspartate/creatine ratio was also observed by Bertolino et al. (1) in the dorsolateral prefrontal cortex of schizophrenic patients but was not particularly linked to negative symptoms. The absence of high ratios of choline/creatine and myo-inositol/creatine in our patients with the deficit syndrome is not consistent with gliosis and therefore does not support a neurodegenerative process in deficit schizophrenia.
As no correlation between N-acetylaspartate/creatine and length of illness in the deficit patients was observed, this result suggests that the low N-acetylaspartate/creatine ratio probably did not reflect an ongoing process. Antipsychotic treatment did not affect the N-acetylaspartate level, since there was no difference between the treated and untreated patients, and no relationship between N-acetylaspartate/creatine and the dose of antipsychotic or level of exposure to medication was noted. This is consistent with the result of Bertolino et al. (9), who found a low N-acetylaspartate/creatine ratio in the dorsolateral prefrontal cortex of unmedicated schizophrenic patients, suggesting that lower N-acetylaspartate/creatine ratios are independent of drug effects.
The absence of segmentation analyses is one major limit of the present study. The voxels contained various proportions of gray and white matter. Determining these proportions could be informative since some studies in schizophrenia have shown low levels of N-acetylaspartate in white but not gray matter (10). Thus, the lower N-acetylaspartate level observed in our study could be due to a larger prefrontal white matter volume in deficit patients, as has been suggested (11).
In conclusion, these preliminary results provide support for neuronal loss in the prefrontal cortex of deficit schizophrenic patients, but further studies with segmentation analyses are needed to determine the reason for these lower N-acetylaspartate levels.
Received Dec. 21, 1998; revisions received July 6 and Aug. 30, 1999; accepted Sept. 2, 1999. From the Groupe de Recherche Centre Esquirol and the D诡rtement d’Imagerie par R貯nance Magn賩que, Centre Hospitalier et Universitaire; and the Centre Cyc豯n, Caen, France. Address reprint requests to Dr. Dollfus, Groupe d’Imagerie Neurofonctionnelle, Universitç¤e Caen. CNRS FRE 2233, CEA LRC 13V, Centre Esquirol, Centre Hospitalier et Universitaire, 14000 Caen, France; dollfus-s @chu-caen.fr (e-mail). Sponsored by the French Health Ministry in a National Research Program on schizophrenia.
 |
1. Bertolino A, Nawroz S, Mattay VS, Barnett AS, Duyn JH, Moonen CT, Frank JA, Tedeschi G, Weinberger DR: Regionally specific pattern of neurochemical pathology in schizophrenia as assessed by multislice proton magnetic resonance spectroscopic imaging. Am J Psychiatry 1996; 153:1554–1563Google Scholar
2. Buckley PF, Moore C, Long H, Larkin C, Thompson P, Mulvany F, Redmond O, Stack JP, Ennis JT, Waddington JL:1H-magnetic resonance spectroscopy of the left temporal and frontal lobes in schizophrenia: clinical, neurodevelopmental, and cognitive correlates. Biol Psychiatry 1994; 36:792–800Google Scholar
3. Williamson PC, Bartha R, Drost DJ, Malla A, Carr T, Canaran G, Densmore M, Neufeld RW: Medial prefrontal 1H MRS and MRI findings in never-treated schizophrenics and healthy controls (abstract). Schizophr Res 1998; 29:101Crossref, Google Scholar
4. Carpenter WT Jr, Heinrichs DW, Wagman AM: Deficit and nondeficit forms of schizophrenia: the concept. Am J Psychiatry 1988; 145:578–583Link, Google Scholar
5. Kirkpatrick B, Buchanan RW, McKenney PD, Alphs LD, Carpenter WT Jr: The Schedule for the Deficit Syndrome: an instrument for research in schizophrenia. Psychiatry Res 1989; 30:119–123Crossref, Medline, Google Scholar
6. Robins LN, Helzer JE, Croughan J, Ratcliff KS: National Institute of Metal Health Diagnostic Interview Schedule: its history, characteristics and validity. Arch Gen Psychiatry 1981; 38:381–389Crossref, Medline, Google Scholar
7. Tamminga CA, Thaker GK, Buchanan R, Kirkpatrick B, Alphs LD, Chase TN, Carpenter WT: Limbic system abnormalities identified in schizophrenia using positron emission tomography with fluorodeoxyglucose and neocortical alterations with deficit syndrome. Arch Gen Psychiatry 1992; 49:522–530Crossref, Medline, Google Scholar
8. Shioiri T, Kato T, Inubushi T, Murashita J, Takahashi S: Correlations of phosphomonoesters measured by phosphorus-31 magnetic resonance spectroscopy in the frontal lobes and negative symptoms in schizophrenia. Psychiatry Res 1994; 55:223–235Crossref, Medline, Google Scholar
9. Bertolino A, Callicott JH, Elman I, Mattay VS, Tedeschi G, Frank JA, Breier A, Weinberger DR: Regionally specific neuronal pathology in untreated patients with schizophrenia: a proton magnetic resonance spectroscopic imaging study. Biol Psychiatry 1998; 43:641–648Crossref, Medline, Google Scholar
10. Lim KO, Adalsteinsson E, Spielman D, Sullivan EV, Rosenbloom MJ, Pfefferbaum A: Proton magnetic resonance spectroscopic imaging of cortical gray and white matter in schizophrenia. Arch Gen Psychiatry 1998; 55:346–352Crossref, Medline, Google Scholar
11. Buchanan RW, Breier A, Kirkpatrick B, Elkashef A, Munson RC, Gellad F, Carpenter WT Jr: Structural abnormalities in deficit and nondeficit schizophrenia. Am J Psychiatry 1993; 150:59–65Link, Google Scholar