Human Brain Metabolic Response to Caffeine and the Effects of Tolerance
Abstract
OBJECTIVE: Since there is limited information concerning caffeine’s metabolic effects on the human brain, the authors applied a rapid proton echo-planar spectroscopic imaging technique to dynamically measure regional brain metabolic responses to caffeine ingestion. They specifically measured changes in brain lactate due to the combined effects of caffeine’s stimulation of glycolysis and reduction of cerebral blood flow. METHOD: Nine heavy caffeine users and nine caffeine-intolerant individuals, who had previously discontinued or substantially curtailed use of caffeinated products because of associated anxiety and discomforting physiological arousal, were studied at baseline and then during 1 hour following ingestion of caffeine citrate (10 mg/kg). To assess state-trait contributions and the effects of caffeine tolerance, five of the caffeine users were restudied after a 1- to 2-month caffeine holiday. RESULTS: The caffeine-intolerant individuals, but not the regular caffeine users, experienced substantial psychological and physiological distress in response to caffeine ingestion. Significant increases in global and regionally specific brain lactate were observed only among the caffeine-intolerant subjects. Reexposure of the regular caffeine users to caffeine after a caffeine holiday resulted in little or no adverse clinical reaction but significant rises in brain lactate which were of a magnitude similar to that observed for the caffeine-intolerant group. CONCLUSIONS: These results provide direct evidence for the loss of caffeine tolerance in the human brain subsequent to caffeine discontinuation and suggest mechanisms for the phenomenon of caffeine intolerance other than its metabolic effects on elevating brain lactate.
Caffeine, a member of the methylxanthine family of drugs, is the most widely used psychostimulant in the world (1). A cup of coffee contains, on average, between 100 mg and 150 mg of caffeine, and since the per capita consumption in the United States is approximately one to two cups a day (1), it can be estimated that more than 15 billion grams of caffeine are consumed annually in this country alone. Caffeine is 100% bioavailable and absorbed rapidly when taken orally, with a volume of distribution similar to that of total body water (1, 2). It has approximately a 3- to 8-hour plasma half-life, and brain levels remain stable for at least 1 hour following peak absorption, which occurs within minutes of ingestion (2, 3). Despite caffeine’s effects on stimulating cerebral metabolism, it also causes substantial and prolonged reductions in cerebral blood flow (CBF) (4–7).
Although caffeine is generally thought to provide positive benefits such as enhanced mental alertness, energy, and a sense of well-being, some individuals experience substantial discomfort or anxiety as a consequence of consuming caffeinated beverages or foods (8). Individuals with anxiety disorders who avoid caffeinated products tend also to be more sensitive to the psychostimulant effects of caffeine (9–12). It is unclear whether this reflects primarily a trait characteristic for caffeine intolerance and/or nonspecific arousal in sensitive individuals or the development of caffeine tolerance among those who regularly use caffeine. There is evidence to support a phenomenon of caffeine tolerance or habituation with chronic use, for example, the effects of caffeine on subjective psychostimulation (13) or sleep latency (14), although not CBF reduction (15). There is additional evidence for the occurrence of caffeine dependence, as caffeine discontinuation can produce withdrawal symptoms that tend to occur within 24–48 hours after stopping caffeine and may continue past 7–10 days, with characteristic manifestations of headaches, anxiety, irritability, lethargy, drowsiness, muscle tension, and decreased mental alertness (16).
The purpose of this study was to characterize brain lactate changes, as a measure of brain metabolic response to acute caffeine ingestion, among caffeine-intolerant individuals who avoid caffeinated substances and among regular caffeine users who experience positive effects from high levels of daily caffeine consumption. Two-dimensional proton echo-planar spectroscopic imaging (17), a fast gradient recalled spectroscopic imaging technique, was used to measure global and regionally specific lactate levels for an axial section of the brain at baseline and then every 8.5 minutes during 1 hour following caffeine ingestion. It was hypothesized, on the basis of caffeine’s potent effects of both stimulating glycolysis and reducing CBF, that it would increase brain lactate (18). From what is known regarding brain metabolic mechanisms implicated in anxiety (18–21) and observations of greater blood lactate rises in response to caffeine among caffeine-intolerant populations (22), it was further hypothesized that caffeine-intolerant individuals would exhibit greater increases in regional and global brain lactate in response to caffeine ingestion. A follow-up study of the regular caffeine users, after a 1- to 2-month period of abstinence from caffeine, sought to isolate the effects of loss of caffeine tolerance when those individuals were rechallenged with the same caffeine dose as in their initial study.
METHOD
Nine persons (three female and six male) who underwent caffeine challenge studies were defined as caffeine-intolerant subjects, since they avoided or had discontinued use of caffeinated substances, typically for most of their adult lives (N=5) or during the past approximately 2.75 years (SD=0.67) (N=4), because of precipitation of panic attacks, severe anxiety, restlessness, irritability, and/or uncomfortable autonomic arousal. In comparison, nine caffeine users (three female and six male) who consumed on a regular basis a minimum of three cups of strong coffee per day or the equivalent (typically, five to seven cups per day) without associated problems were studied. The mean age of the caffeine-intolerant group was 31.3 years (SD=6.4), and the mean age of the caffeine-user group was 39.6 years (SD=11.6). Data acquired from an additional caffeine-intolerant subject were discarded because of motion artifact. All subjects gave written informed consent in a manner approved by the University of Washington Institutional Review Board and were screened for contraindications to being in the magnetic resonance imaging (MRI) scanner, including metal implants, pregnancy, and severe claustrophobia. Subjects fasted overnight before the study. All subjects were in good general health, and none was taking medication other than birth control pills or used tobacco on a regular basis. One of the caffeine-intolerant subjects and none of the regular caffeine users met the DSM-IV criteria for panic disorder.
Caffeine citrate (10 mg/kg) mixed in fruit juice was administered orally following baseline proton echo-planar spectroscopic imaging measurements. This dose of caffeine was chosen because it is highly likely to elicit anxiety/panic and physiological arousal in sensitive individuals (11). The scanning protocol consisted of acquisition of high-resolution localizer images, three baseline spectroscopic images, caffeine ingestion through flexible plastic tubing that allowed the head to remain motionless in the head coil, and six post-caffeine-ingestion spectroscopic images acquired and averaged over 8.5-minute time intervals. At baseline and immediately after completion of the magnet session, subjects’ levels of psychological and physiological symptom severity were recorded with the Acute Panic Inventory (23).
Eight of the regular caffeine users agreed to stop all caffeinated products and maintain a caffeine-free holiday for a minimum of 4 weeks before undergoing a repeat caffeine challenge. Two subjects were unable to tolerate discontinuation of caffeine, and one subject had difficulties with onset of headaches when caffeine was abruptly stopped, which resolved after substitution of decaffeinated coffee for 1 week. Data from one subject were lost during rechallenge because of scanner malfunction. For the five subjects (four male and one female) with completed studies, the mean duration of the caffeine-free holiday was 37.0 days (SD=11.1, range=27–56).
Imaging
The proton echo-planar spectroscopic imaging studies were performed on a 1.5-T GE Signa scanner (version 5.4 operating system) equipped with a short-bore, linear birdcage coil having approximately √2 improvement in signal-to-noise ratio over standard quadrature coils (C. Hayes, unpublished data). The coil design incorporated a built-in head holder to keep the head fixed in position. High-resolution MRI was used for anatomical localization of a 20-mm two-dimensional axial slice centered at the level of the lateral ventricles (figure 1). The proton echo-planar spectroscopic imaging pulse sequence consists of three parts: 1) interleaved water and spatial suppression, 2) spin-echo excitation of the slice of interest, and 3) echo-planar spatial/spectral encoding by means of a series of periodic readout gradients to simultaneously encode spectral information and two spatial dimensions, as previously described (17). The proton echo-planar spectroscopic imaging studies used a repetition time (TR) of 4 seconds to acquire near-relaxed spectra and an echo time (TE) of 272 msec, both to obtain an in-phase doublet of lactate and to minimize residual peripheral lipid resonances; four averages were acquired, with acquisition of partial echoes to permit magnitude reconstruction. Outer volume suppression of lipids was performed by means of a series of eight orthogonal, operator-placed, spatially selective radiofrequency pulses (17). Measurements were performed with a spatial matrix of 32×32 voxels; 22-cm field of view; 32-kHz spectral width; 16,384 complex data points for frame size (32 spatial points convoluted with 512 spectral points) with a nominal voxel size of 1 cm3; and spectral resolution of 1.9 Hz per point.
Reconstruction of proton echo-planar spectroscopic metabolic images used raw data traces from individual excitations that were averaged and separate even and odd echo data combined for reconstruction into a three-dimensional matrix (one dimension for spectral encoding and two dimensions for spatial encoding). The spectral dimension was filtered by applying a trapezoidal filter with a ramp width of 50 points on both sides of the 256 complex raw data vector. This filter was used because an almost complete echo was collected in the time domain. A sine-bell function spatial filter was applied in k-space to reduce residual lipid bleed in lactate metabolic images. For N-acetylaspartate (NAA) images, a Gaussian filter was applied with a full width as half maximum of 11 points out of 32 in the spatial domain. Three-dimensional Fourier transformation was performed, and magnitude spectra were computed. For this study, only lactate and NAA metabolic imaging data are reported. Spectra were screened for validity with the use of an automated artificial intelligence method based on metabolite line widths (Strauss et al., manuscript in preparation). Magnetic field inhomogeneity shifts were corrected by setting the maximum point of the NAA peak to 2.0 ppm for each spectrum. Metabolic maps were calculated from the spectral resonances of NAA and lactate by integrating spectral regions that extended 0.09 ppm to the left and to the right side of each resonance.
An example of the lactate spectral quality for a lactate-sensitive subject is shown in figure 2. Shown in figure 3, parts a and b, respectively, are consecutively acquired individual spectra from the insular cortex region of a regular caffeine user during his initial caffeine challenge study and then 1 month later, after a caffeine holiday, during caffeine rechallenge.
Proton resonances of lactate and NAA were identified and automatically digitally integrated for each subject to produce metabolic maps, as shown in figure 4. Metabolic images were displayed and quantitated by means of National Institutes of Health Image 1.61 software. Regions of interest were defined from the coregistered metabolic images and high-resolution MRIs by a rater (M.E.L., W.S.) blind to diagnosis and response to caffeine. To evaluate regions of focal brain activation, z score maps for each voxel were created by subtracting the lactate/NAA ratios at each time point from the averaged baseline lactate/NAA ratio, which then was divided by the standard deviation of the lactate/NAA ratio for the averaged baseline.
Lactate levels are reported as a metabolite ratio in comparison with NAA. The NAA spectral peak was used as an internal reference (signal lactate/signal NAA ratio) to standardize lactate measurements for any differences in magnet shimming between studies or for the effects of regional sensitivity differences of the radiofrequency birdcage coil and line broadening due to head movement during a study (24). Although this approach has certain inherent limitations (25), it has proven to be useful in previous work, which characterized evolving metabolic conditions in the brain (17–20).
Statistical Analysis
Analysis of variance (ANOVA) for repeated measures, with the Greenhouse-Geisser correction, was used to compare changes in brain lactate (signal lactate/signal NAA ratio) for nine time points during the study (three at baseline and six after caffeine ingestion), which allowed comparison over time of the caffeine-intolerant subjects and the regular caffeine users and assessment of the effects of a caffeine holiday on repeat caffeine challenge among the regular caffeine users. Results were further analyzed to assess differences between gray and white matter tissue. For ANOVAs reaching significance, Tukey’s honestly significant difference test was used to further compare changes in signal lactate/signal NAA ratio from baseline in response to caffeine. Although we hypothesized that caffeine increases brain lactate and that caffeine-intolerant subjects would exhibit a greater magnitude of lactate increase, we had no a priori hypothesis for the effects of a caffeine holiday. To be consistent, only two-tailed statistical tests were applied to determine significance at the level of p<0.05.
RESULTS
Eight of the nine caffeine-intolerant subjects reported moderate to marked symptoms of anxiety and physiological arousal, with an increase in mean Acute Panic Inventory score from 2.6 (SD=5.1, maximum=16) at baseline to 20.2 (SD=11.2, maximum=29) at the time of maximum response following caffeine ingestion, whereas only one of the nine regular caffeine users reported mild symptoms of anxiety, with an increase in mean Acute Panic Inventory score from 0.3 (SD=0.5, maximum=1) at baseline to 3.0 (SD=3.2, maximum=10) at the time of maximum symptom intensity following caffeine ingestion. Acute Panic Inventory scores did not differ significantly between groups at baseline by independent t test (t=1.3, df=16), but they became significantly higher among the caffeine-intolerant group following caffeine ingestion (t=4.4, df=16, p<0.001). Symptoms typically occurred within 20 minutes after caffeine ingestion and continued or worsened during the remainder of the study. All subjects completed the protocol except for one regular caffeine user who requested early study discontinuation during the final scanning period because of urinary urgency.
Significant increases in the ratio of brain lactate to NAA occurred subsequent to caffeine ingestion among the caffeine-intolerant subjects (F=5.9, df=8, 64, p<0.004, Greenhouse-Geisser correction: ε=0.371). Tukey’s honestly significant difference test indicated a trend increase in lactate from baseline (defined as scan 3) at the 17-minute time point (p=0.10) and a significant increase at all subsequent intervals (at 25 minutes, p=0.05; at 34, 42, and 51 minutes, all p values=0.01). In contrast, brain lactate/NAA ratios did not significantly increase among the regular caffeine users (F=1.2, df=8, 56, ε=0.441) (figure 5). When the caffeine-intolerant subjects were compared with the regular caffeine users, no significant between-group main effect was found (F=0.5, df=1, 15), but a group-by-repeated measures interaction was noted (repeated measures main effect: F=3.8, df=8, 136, p<0.01; group-by-repeated measures interaction: F=3.4, df=8, 120, p<0.02, ε=0.424), as shown in figure 5. For all subjects, raw NAA signal amplitude did not change significantly in response to caffeine ingestion (F=0.2, df=8, 128, ε=0.305).
Bilateral regions containing predominantly gray matter tissue (cingulate, caudate, thalamus, and insular cortex) or white matter tissue (splenium and parietal, temporal, and occipital cortex) were pooled to assess differences between tissue-type metabolic responses to caffeine. There was some evidence for greater overall gray matter lactate levels than white matter lactate levels (F=3.6, df=1, 28, p<0.07), consistent with other studies of relative metabolic rates (26). No significant between-group tissue differences were shown (F=0.6, df=1, 28), nor were there significant differences in the time course of metabolic response to caffeine (repeated measures main effect: F=1.9, df=8, 256, p=0.07; group-by-repeated measures main effect: F=0.6, df=8, 248, ε=0.602; group-by-gray/white-tissue-by-scan interaction: F=1.4, df=7, 248).
Rechallenge with caffeine following a 4- to 8-week period of caffeine abstinence produced mild anxiety and muscle tension in one of five caffeine-holiday subjects; this occurred within 5 minutes after caffeine ingestion and then quickly dissipated. Mean Acute Panic Inventory scores increased from 0.4 (SD=0.9, maximum=2) at baseline to 3.8 (SD=3.7, maximum=8) at maximal response to caffeine. In comparison with the subjects’ first study, Acute Panic Inventory scores were not significantly different at baseline by paired t test (t=0.5, df=8) or at maximum caffeine response (t=1.3, df=8). Brain lactate significantly increased from baseline after rechallenge with caffeine (F=7.9, df=8, 32, p<0.03, ε=0.177). Significantly greater increases in brain lactate/NAA ratio occurred after rechallenge in comparison with the initial study (group main effect: F=5.7, df=1, 7, p<0.05; repeated measures main effect: F=9.0, df=8, 72, p<0.002; group-by-repeated measures interaction: F=4.7, df=8, 56, p<0.02, ε=0.332). After the caffeine holiday, brain levels of lactate were significantly elevated compared with baseline levels at 17 minutes (scan 5, p=0.05, Tukey’s honestly significant difference) and across all subsequent time points (at 25 and 34 minutes, p=0.05; at 42 and 51 minutes, p=0.01) (figure 6). In the comparison of the caffeine-holiday subjects with the caffeine-intolerant group, no significant between-group main effect or group-by-repeated-measures interaction was observed (group main effect: F=0.7, df=1, 12; repeated measures main effect: F=14.0, df=8, 112, p<0.001; group-by-repeated measures interaction: F=1.7, df=8, 96, ε=0.347).
Gray/white matter differences were also examined for the five regular caffeine users studied serially at baseline and after a caffeine holiday. Although no significant group effect was found (F=2.8, df=1, 14), combined gray matter lactate/NAA ratios were significantly greater, consistent with the trend shown in the previous comparison (F=6.1, df=1, 14, p<0.03). A trend for a group-by-tissue-type interaction was also present (F=4.0, df=1, 14, p=0.07). Consistent with whole brain analysis, similar effects of scan (F=2.9, df=8, 112, p=0.006) and group by scan (F=2.7, df=7, 104, p=0.01) were found. However, no significant group-by-tissue-by-scan effect was demonstrated (F=0.9, df=6, 104).
To further characterize the lactate increases among the caffeine-intolerant and regular caffeine users rechallenged after a caffeine holiday, z score maps were used to assess regional patterns of brain lactate response. Among the caffeine-intolerant group, a pattern of time-dependent regional differences was observed for areas encompassing the right insula, right temporal lobe, left frontal cortex, and left thalamus (z scores greater than 2 SD for two or more adjacent voxels or a z score greater than 3 SD for one voxel), as shown in figure 7. The group of regular caffeine users who were rechallenged demonstrated more regions of brain lactate elevation than the caffeine-intolerant group, with time-dependent regional increases observed bilaterally in the insular cortex, temporal lobe, frontal cortex, thalamus, occipital cortex, corpus callosum, left basal ganglia, and left anterior cingulate (z scores greater than 2 SD for two or more adjacent voxels or a z score greater than 3 SD for one voxel), as shown in figure 8.
DISCUSSION
Caffeine-intolerant individuals, but not regular caffeine users, exhibited a pattern of progressive rises in brain lactate during a 1-hour evaluation period after rapid ingestion of the equivalent of five to eight cups of coffee. Differences in brain lactate response were considered to possibly reflect underlying metabolic differences observed previously in individuals having panic disorder (18–20) and/or the effects of acute neuronal activation, as manifested by hyperarousal and anxiety, in response to caffeine ingestion (27). Alternatively, habituation or the development of tolerance to caffeine among those with heavy, chronic use also could have blocked or diminished any brain metabolic effects.
To address whether findings of elevated brain lactate were specific to the caffeine-intolerant group or, conversely, reflected loss of caffeine tolerance due to lack of use, a subset of the regular caffeine users discontinued all xanthine-containing substances for an interval of 1–2 months. After this period of caffeine abstinence, those subjects demonstrated, in comparison with their initial study, significant rises in brain lactate in response to acute caffeine ingestion. The magnitude of the increase in brain lactate after a caffeine holiday was comparable to that observed for the caffeine-intolerant group, who had been essentially caffeine free for a number of years. An important difference between the two groups was the lack of adverse psychological or autonomic responses among the subjects rechallenged after a caffeine holiday, which suggests that elevations in brain lactate more specifically reflected loss of caffeine tolerance for metabolic effects rather than arousal per se. This further suggests that elevated brain lactate is not the primary mechanism responsible for caffeine’s precipitation of anxiety and/or panic symptoms in susceptible individuals.
Elevated brain lactate following acute caffeine exposure presumably reflects both intracellular and extracellular contributions, since an equilibrium between compartments results from a well-described saturable transporter (28). However, the magnetic resonance visibility of intracellular lactate is controversial (29, 30). If only a portion of brain lactate increase is detectable by magnetic resonance spectroscopy, this would decrease the signal-to-noise ratio for detecting change but does not preclude comparison between populations or characterization of the time course for rise in brain lactate.
Both caffeine-intolerant and caffeine-holiday subjects demonstrated diffuse increases in brain lactate in response to caffeine. Consistent with other reports (26), gray matter appeared to be more metabolically active than white matter. More important, a different regional pattern of lactate response was observed between caffeine-intolerant and caffeine-holiday subjects. Areas of enhanced metabolic response were observed for regions corresponding to the right insular cortex, right temporal lobe, left frontal cortex, and left thalamus among the caffeine-sensitive individuals. This pattern of regional metabolic response, particularly involving the insular cortex, is consistent with observations by another group of researchers also investigating brain lactate effects of caffeine (G. Moore et al., personal communication). More extensive areas of brain lactate elevation, demonstrating less hemispheric lateralization, were observed in response to caffeine rechallenge following a caffeine holiday. Although involvement of certain regions might, in part, reflect high densities of adenosine receptors (31), affected brain regions also correspond to areas of increased metabolism observed in positron emission tomography studies of generalized anxiety that normalize with benzodiazepine administration (32). In attempting to understand the mechanism(s) underlying caffeine elevation of brain lactate, it should be noted that the regional differences in lactate observed in this study differ from our observations of diffuse, nonfocal elevations in brain lactate in response to vasoconstriction during hyperventilation (17) or in response to intravenous lactate infusion (33).
Several possible mechanisms might account for elevated brain lactate following acute caffeine ingestion. A cascade of events at the intracellular level, leading to accelerated glycolysis and the increased production of lactate, would be accentuated through caffeine-mediated decreases in CBF by 30% or more (4–7). Brain lactate increases observed after acute reintroduction of caffeine to caffeine-abstinent subjects, both those who were caffeine-intolerant and those who were regular users and electively discontinued caffeine, may reflect enhanced effects of caffeine on adenosine receptors that have been down-regulated (or not up-regulated) in the absence of caffeine; however, evidence for and against the occurrence of adenosine receptor up-regulation in response to chronic caffeine antagonism is mixed (31, 34–40). Administration of caffeine to caffeine-abstinent subjects could have increased metabolic activation through excitation of cholinergic neurons acutely released from the tonic inhibitory control of endogenous adenosine (37, 41). Alternatively, these observations might reflect central activation of adrenergic receptors up-regulated in the absence of caffeine (37, 42), as both alpha and beta receptors appear to act on intracellular metabolic processes that could increase lactate (43). A lack of physiological arousal following reintroduction of caffeine suggests that the marked increase in brain lactate is unlikely to be due to caffeine’s effects on peripheral catecholamine receptors (44). Although caffeine-induced vasoconstriction could have substantially increased brain lactate (17, 18), available evidence suggests that tolerance to CBF reduction by caffeine (15) does not occur. Vasoconstriction also does not appear to mediate caffeine’s anxiogenic effects among sensitive individuals (6, 45) and would be expected to cause diffuse, nonfocal elevations in brain lactate (17). One could speculate that following a period of caffeine abstinence, previously heavy caffeine users might be more metabolically reactive to caffeine reintroduction as a result of down-regulated adenosine receptor density, while remaining less sensitive than caffeine-intolerant individuals to possible anxiogenic effects of caffeine mediated by adrenoceptors that have not yet been up-regulated. This explanation for differential psychological/ physiological arousal between groups, while plausible, would depend on the time course of receptor changes in humans and awaits further confirmation.
In summary, acute ingestion of a large quantity of caffeine significantly increased brain lactate in caffeine-intolerant individuals who avoided caffeinated products and, as a consequence, were caffeine free, but not in regular caffeine users who daily consumed large quantities of caffeinated beverages and food. Specific to the caffeine-intolerant group, acute caffeine ingestion resulted in moderate to marked symptoms of panic/anxiety and physiological arousal. Among the regular caffeine users, reexposure to caffeine after a 4-week or longer caffeine holiday resulted in significantly greater increases in brain lactate that were comparable to those in the caffeine-intolerant group, but without associated psychological or physiological distress. This suggests that caffeine’s elevation of brain lactate is not directly responsible for (and does not result from) the symptoms associated with caffeine intolerance. Furthermore, regular caffeine consumption is an important modulator of caffeine’s metabolic effects, and loss of tolerance to those effects occurs within 1–2 months after caffeine cessation. This latter observation suggests that further investigation into the brain metabolic effects of caffeine in relation to tolerance and withdrawal would be of interest and might also serve as a useful model for studying other more addictive drugs.
Presented in part at the annual meeting of the International Society for Magnetic Resonance in Medicine, Vancouver, B.C., April 12–18, 1997. Received Feb. 9, 1998; revision received July 14, 1998; accepted July 29, 1998. From the Departments of Psychiatry and Behavioral Sciences, Bioengineering, Radiology, and Anesthesiology, University of Washington Medical Center; and the Institute of Medicine, Jülich, Germany. Address reprint requests to Dr. Dager, Department of Psychiatry and Behavioral Sciences, University of Washington Center for Anxiety and Depression, 4225 Roosevelt Way N.E., Suite 306-C, Medical Center, Seattle, WA 98105-6099; [email protected] (e-mail). Supported by NIMH grant MH-50579 and a Research Royalty Fund Grant through the University of Washington to Dr. Dager. The authors thank Marie Domsalla for her assistance with subject recruitment and study coordination; Walton T. Roth, M.D., and Michael Vitiello, Ph.D., for comments concerning the manuscript; and the research volunteers who participated in this study.
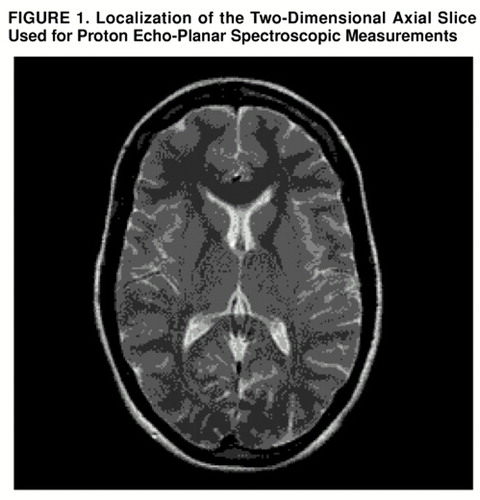
FIGURE 1. Localization of the Two-Dimensional Axial Slice Used for Proton Echo-Planar Spectroscopic Measurements
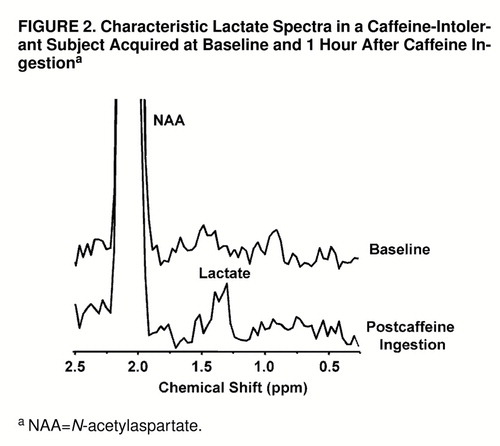
FIGURE 2. Characteristic Lactate Spectra in a Caffeine-Intolerant Subject Acquired at Baseline and 1 Hour After Caffeine Ingestiona
aNAA=N-acetylaspartate.
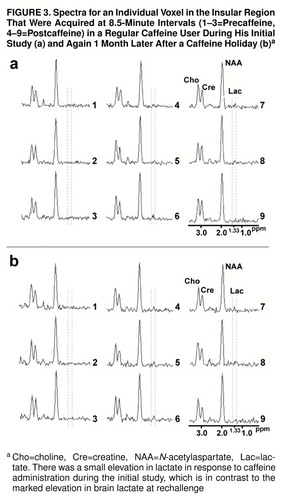
FIGURE 3. Spectra for an Individual Voxel in the Insular Region That Were Acquired at 8.5-Minute Intervals (1–3=Precaffeine, 4–9=Postcaffeine) in a Regular Caffeine User During His Initial Study (a) and Again 1 Month Later After a Caffeine Holiday (b) a
aCho=choline, Cre=creatine, NAA=N-acetylaspartate, Lac=lactate. There was a small elevation in lactate in response to caffeine administration during the initial study, which is in contrast to the marked elevation in brain lactate at rechallenge
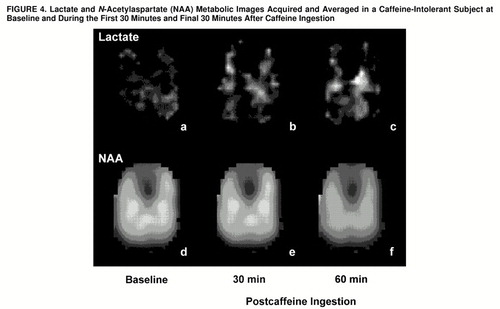
FIGURE 4. Lactate and N-Acetylaspartate (NAA) Metabolic Images Acquired and Averaged in a Caffeine-Intolerant Subject at Baseline and During the First 30 Minutes and Final 30 Minutes After Caffeine Ingestion
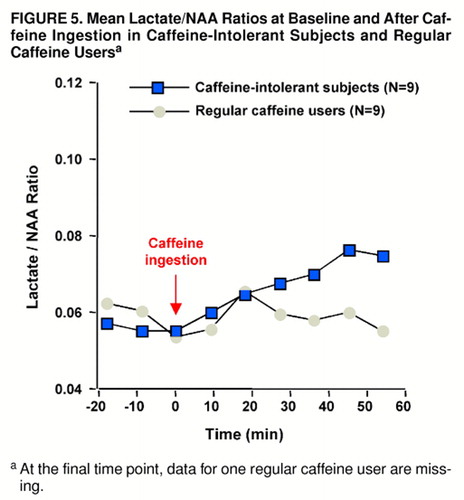
FIGURE 5. Mean Lactate/NAA Ratios at Baseline and After Caffeine Ingestion in Caffeine-Intolerant Subjects and Regular Caffeine Usersa
aAt the final time point, data for one regular caffeine user are missing.
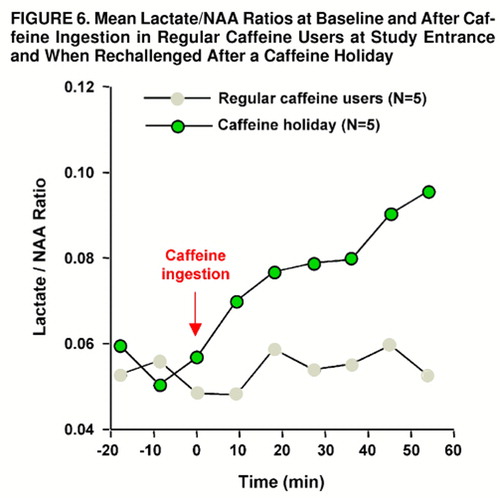
FIGURE 6. Mean Lactate/NAA Ratios at Baseline and After Caffeine Ingestion in Regular Caffeine Users at Study Entrance and When Rechallenged After a Caffeine Holiday
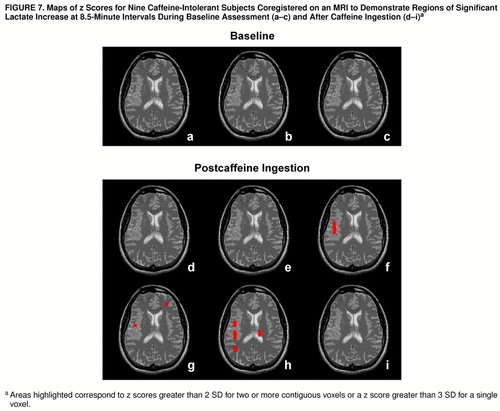
FIGURE 7. Maps of z Scores for Nine Caffeine-Intolerant Subjects Coregistered on an MRI to Demonstrate Regions of Significant Lactate Increase at 8.5-Minute Intervals During Baseline Assessment (a–c) and After Caffeine Ingestion (d–i) a
aAreas highlighted correspond to z scores greater than 2 SD for two or more contiguous voxels or a z score greater than 3 SD for a single voxel.
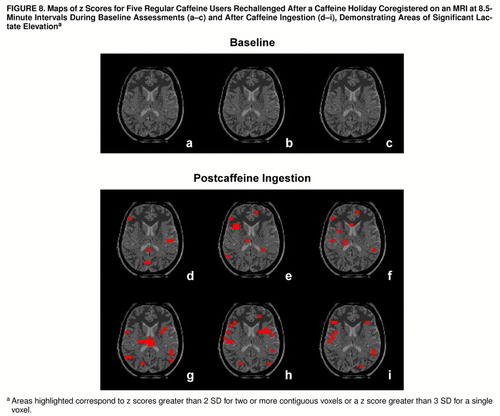
FIGURE 8. Maps of z Scores for Five Regular Caffeine Users Rechallenged After a Caffeine Holiday Coregistered on an MRI at 8.5-Minute Intervals During Baseline Assessments (a–c) and After Caffeine Ingestion (d–i) a
aAreas highlighted correspond to z scores greater than 2 SD for two or more contiguous voxels or a z score greater than 3 SD for a single voxel.
1. O’Brien CP: Drug addiction and drug abuse, in Goodman and Gilman’s The Pharmacological Basis of Therapeutics, 9th ed. Edited by Hardman JG, Limbird LE, Molinoff PB, Ruddon RW, Gilman AG. New York, McGraw-Hill, 1996, pp 557–577Google Scholar
2. Rowland M, Tozer TN: Clinical Pharmacokinetics. Philadelphia, Lea & Febiger, 1980Google Scholar
3. Axelrod J, Reisenthal J: The fate of caffeine in man and a method for its estimation in biological material. J Pharmacol Exp Ther 1953; 107:519–523Medline, Google Scholar
4. Gibbs FA, Gibbs EL, Lennon WG: Cerebral blood flow in man as influenced by adrenaline, caffeine, amyl nitrite and histamine. Am Heart J 1935; 10:916–924Crossref, Google Scholar
5. Mathew RJ, Wilson WH: Caffeine-induced changes in cerebral circulation. Stroke 1985; 16:814–817Crossref, Medline, Google Scholar
6. Cameron OG, Modell JG, Hariharan M: Caffeine and human cerebral blood flow: a positron emission tomography study. Life Sci 1990; 47:1141–1146Crossref, Medline, Google Scholar
7. Nehlig A, Daval JL, Debry G: Caffeine and the central nervous system: mechanisms of action, biochemical, metabolic and psychostimulant effects. Brain Res Brain Res Rev 1992; 17:139–170Crossref, Medline, Google Scholar
8. Victor BS, Lubetsky M, Greden JF: Somatic manifestations of caffeinism. J Clin Psychiatry 1981; 42:185–188Medline, Google Scholar
9. Boulenger JP, Uhde TW: Caffeine consumption and anxiety: preliminary results of a survey comparing patients with anxiety disorders and normal controls. Psychopharmacol Bull 1982; 18:53–54Medline, Google Scholar
10. Boulenger JP, Uhde TW, Wolff EA III, Post RM: Increased sensitivity to caffeine in patients with panic disorder. Arch Gen Psychiatry 1984; 41:1067–1071Crossref, Medline, Google Scholar
11. Charney D, Henninger GR, Jatlow PI: Increased anxiogenic effects of caffeine in panic disorders. Arch Gen Psychiatry 1985; 42:233–243Crossref, Medline, Google Scholar
12. Lee MA, Flegel P, Greden JF, Cameron OG: Anxiogenic effects of caffeine on panic and depressed patients. Am J Psychiatry 1988; 145:632–635Link, Google Scholar
13. Evans SM, Griffiths RR: Caffeine tolerance and choice in humans. Psychopharmacology (Berl) 1992; 108:51–59Crossref, Medline, Google Scholar
14. Zwyghuizen-Doorenbos A, Roehrs TA, Lipschutz L, Timms V, Roth T: Effects of caffeine on alertness. Psychopharmacology (Berl) 1990; 100:36–39Crossref, Medline, Google Scholar
15. Mathews RJ, Wilson WH: Caffeine consumption, withdrawal and cerebral blood flow. Headache 1985; 25:305–309Crossref, Medline, Google Scholar
16. Silverman K, Evans SM, Strain EC, Griffiths RR: Withdrawal syndrome after the double-blind cessation of caffeine consumption. N Engl J Med 1992; 327:1109–1114Crossref, Medline, Google Scholar
17. Posse S, Dager SR, Richards TL, Yuan C, Artru AA, Ogg R, Müller-G�rtner HW, Hayes C: Measurement of regional brain metabolic response to hyperventilation using functional proton echo-planar spectroscopic imaging (PEPSI). Magn Reson Med 1997; 37:858–865Crossref, Medline, Google Scholar
18. Dager SR, Strauss WL, Marro KI, Richards TL, Metzger GD, Artru AA: Proton magnetic resonance spectroscopy investigation of hyperventilation in subjects with panic disorder and comparison subjects. Am J Psychiatry 1995; 152:666–672Link, Google Scholar
19. Dager SR, Marro KI, Richards TL, Metzger GD: Preliminary application of magnetic resonance spectroscopy to investigate lactate-induced panic. Am J Psychiatry 1994; 151:57–63Link, Google Scholar
20. Dager SR, Richards T, Strauss WL, Artru A: Single-voxel 1H MRS investigation of brain metabolic changes during lactate-induced panic. Psychiatry Res Neuroimaging 1997; 76:89–99Crossref, Medline, Google Scholar
21. Dager SR, Layton M, Richards TL: Neuroimaging findings in anxiety disorders. Seminars in Clin Neuropsychiatry 1996; 1:48–60Medline, Google Scholar
22. Uhde TW, Boulenger JP: Caffeine model of panic, in New Directions in Affective Disorders. Edited by Lerer B, Gershon S. New York, Springer-Verlag, 1989, pp 410–413Google Scholar
23. Dillon DJ, Gorman JM, Liebowitz MR, Fyer AJ, Klein DF: Measurement of lactate-induced panic and anxiety. Psychiatry Res 1987; 20:97–105Crossref, Medline, Google Scholar
24. Tofts PS, Wray S: A critical assessment of methods of measuring metabolite concentrations by NMR spectroscopy. NMR Biomed 1988; 1:1–10Crossref, Medline, Google Scholar
25. Birken DL, Oldendorf WH: N-Acetyl-L-aspartic acid: a literature review of a compound prominent in 1H-NMR spectroscopic studies of brain. Neurosci Biobehav Rev 1989; 13:23–31Crossref, Medline, Google Scholar
26. Ostergaard L, Sorensen AG, Kwong KK, Weisskoff RM, Gyldensted C, Rosen BR: High resolution measurement of cerebral blood flow using intravascular tracer bolus passages, part II: experimental comparison and preliminary results. Magn Reson Med 1996; 36:726–736Crossref, Medline, Google Scholar
27. Posse S, M�ller-G�rtner HW, Dager SR: Functional magnetic resonance studies of brain activation. Seminars in Clin Neuropsychiatry 1996; 1:76–88Medline, Google Scholar
28. Oldendorf WH: Blood-brain-barrier permeability to lactate. Eur Neurol 1971; 6:49–55Crossref, Medline, Google Scholar
29. Williams SR, Proctor E, Allen K, Gadian DG, Crockard HA: Quantitative estimation of lactate in the brain by 1H NMR. Magn Reson Med 1988; 7:425–431Crossref, Medline, Google Scholar
30. Chang LH, Pereira BM, Weinstein PR: Comparison of lactate concentration determinations in ischemic and hypoxic rat brains by in vivo and in vitro 1H NMR spectroscopy. Magn Reson Med 1987; 4:575–581Crossref, Medline, Google Scholar
31. Shearman LP, Weaver DR: [125I]Aminobenzyl-5"-N-methylcarboxamido-adenosine [125I] (AB-MECA) labels multiple adenosine receptor subtypes in rat brain. Brain Res 1977; 745:10–20Crossref, Google Scholar
32. Wu JC, Buchsbaum MS, Hershey TG, Hazlett E, Sicotte N, Johnson JC: PET in generalized anxiety disorder. Biol Psychiatry 1991; 29:1181–1199Crossref, Medline, Google Scholar
33. Dager SR, Friedman SD, Heide A, Layton ME, Richards TL, Artru AA, Strauss W, Hayes C, Posse S: Two-dimensional proton echo-planar spectroscopic imaging of brain metabolic changes during lactate-induced panic. Arch Gen Psychiatry (in press)Google Scholar
34. Jacobson KA, von Lubitz DK, Daly JW, Fredholm BB: Adenosine receptor ligands: differences with acute versus chronic treatment. Trends Pharmacol Sci 1996; 17:108–113Crossref, Medline, Google Scholar
35. Lin Y, Phillis JW: Chronic caffeine exposure enhances adenosinergic inhibition of cerebral cortical neurons. Brain Res 1990; 520:322–323Crossref, Medline, Google Scholar
36. Kaplan GB, Greenblatt DJ, Kent MA, Cotreau-Bibbo MM: Caffeine treatment and withdrawal in mice: relationships between dosage, concentrations, locomotor activity and A1 adenosine receptor binding. J Pharmacol Exp Ther 1993; 266:1563–1572Medline, Google Scholar
37. Shi D, Nikodijevi’c O, Jacobson KA, Daly JW: Chronic caffeine alters the density of adenosine, adrenergic, cholinergic, GABA, and serotonin receptors and calcium channels in mouse brain. Cell Mol Neurobiol 1993; 13:247–261Crossref, Medline, Google Scholar
38. Johansson B, Ahlberg S, Van der Ploeg I, Bren’e S, Lindefors N, Persson H, Fredholm BB: Effect of long-term caffeine treatment on A1 and A2 adenosine receptor binding and on mRNA levels in rat brain. Naunyn Schmiedebergs Arch Pharmacol 1993; 347:407–414Crossref, Medline, Google Scholar
39. Johansson B, Georgiev V, Lindstrom K, Fredholm BB: A1 and A2A adenosine receptors and A1 mRNA in mouse brain; effect of long-term caffeine treatment. Brain Res 1997; 762:153–164Crossref, Medline, Google Scholar
40. Holtzman SG, Mante S, Minneman KP: Role of adenosine receptors in caffeine tolerance. J Pharmacol Exp Ther 1991; 256:62–68Medline, Google Scholar
41. Rainnie DG, Grunze HC, McCarley RW, Greene RW: Adenosine inhibition of mesopontine cholinergic neurons: implications for EEG arousal. Science 1994; 263:689–692Crossref, Medline, Google Scholar
42. Hadcock JR, Port JD, Malbon CC: Cross-regulation between G-protein-mediated pathways: activation of the inhibitory pathway of adenylylcylclase increases the expression of beta 2-adrenergic receptors. J Biol Chem 1991; 266:11915–11922Medline, Google Scholar
43. Tighe D, Moss R, Bennett D: Cell surface adrenergic receptor stimulation modifies the endothelial response to SIRS: systemic inflammatory response syndrome. New Horiz 1996; 4:426–442Medline, Google Scholar
44. Robertson D, Johnson GA, Robertson RM, Neis AS, Shand DG, Oates JA: Comparative assessment of stimuli that release neuronal and adrenomedullary catecholamines in man. Circulation 1979; 59:637–643Crossref, Medline, Google Scholar
45. Mathew RJ, Wilson WH: Behavioral and cerebrovascular effects of caffeine in patients with anxiety disorders. Acta Psychiatr Scand 1990; 82:17–22Crossref, Medline, Google Scholar


