Selective Attention in Schizophrenia: Sparing and Loss of Executive Control
Abstract
OBJECTIVE: Auditory selective attention involves top-down modulation of sensory processing to selectively filter relevant from irrelevant information. Patients with schizophrenia have deficits in auditory selective attention, but whether these attention deficits are evident at the earliest stages of auditory processing or emerge later in the processing stream is unknown. METHOD: Event-related potentials were used to assess the integrity and time course of auditory attention in schizophrenia during a cross-modal selective attention task. A random sequence of equiprobable loud and soft speech sounds and bright and dim checkerboard patterns occurred every 800 to 1200 msec. A button press was required in response to soft speech sounds in the auditory attention task and to dim checkerboards in the visual attention task. Event-related potentials were recorded from 15 patients with DSM-IV schizophrenia and 16 age- and gender-matched healthy comparison subjects. RESULTS: As early as 50 msec, both patients and comparison subjects showed evidence of cross-modal selective attention. These attention effects were sustained until 300 msec in comparison subjects but were no longer evident in patients by 100 msec. CONCLUSIONS: Schizophrenia patients implemented an early attentional filter but failed to sustain selective attention later in the processing stream. This suggests that initially intact executive control of auditory attention cannot be sustained in schizophrenia, perhaps implicating dysfunction in frontotemporal pathways.
Cognitive and attentional deficits played a prominent role in the original descriptions of schizophrenia (1, 2), and recent reviews have proposed that they comprise a “core of schizophrenia” giving rise to other aspects of the disease process (3, 4). Their frequency and severity significantly contribute to impaired social and vocational functioning (5). Theories about the nature of attentional impairments in schizophrenia are numerous, ranging from early precognitive gating failures to deficits of executive control in selectively sorting between relevant and irrelevant information (6).
Attentional control systems are needed to filter the rapid, multisensory stimulus bombardment we constantly encounter. Exactly when in the processing stream this happens has been the subject of some debate. Broadbent (7) first suggested that a very early filter acted to suppress processing of information in the unattended channel or modality, while Deutsch and Deutsch (8) suggested that information in the unattended channel may continue to be processed to a high level before being rejected from further action. These two views of selective attention have been variously referred to as early (7) versus late (8) selection, stimulus-set versus response-set attention (9), and filtering versus pigeon-holing (9, 10).
Event-related potentials allow millisecond temporal resolution of stimulus-related neural activity and pinpoint when attention affects stimulus processing. In a seminal study (11), subjects heard rapidly presented high tones in one ear and low tones in the other ear. Occasionally a slightly higher pitched “target” tone was presented. On one run, subjects were instructed to pay attention to targets in one ear, and on the other run, they were instructed to pay attention to targets in the other ear. There was evidence of cross-ear selective attention in N1 amplitude, which was quantified as the difference in N1 amplitude to the same tone when attended and not attended. This difference, later referred to as “Nd” (12), was evident as early as 60–70 msec post-stimulus and was interpreted as evidence for early filtering. Nd enhanced the negativity of both the early N1 amplitude (at approximately 100 msec) and later N2 amplitude (at approximately 250 msec), both elicited in the auditory cortex (13). These components are also enhanced in cross-modal tasks where the effects of auditory attention are compared with visual attention (14, 15). That an even earlier positive component, the auditory P1, can show augmented positivity in cross-modal attention tasks has received some modest support (14) (but see reference 15), although it must have a different mechanism than that underlying the negativity augmentation seen with Nd. Regardless of the mechanisms, attention effects at P1, N1, and N2 are consistent with top-down executive control affecting processing of incoming signals before 300 msec.
Functional magnetic resonance imaging (fMRI) studies support the involvement of frontal lobes, as well as the primary and secondary auditory cortices, in selective attention. Auditory selective attention studies have shown increased activity in the primary auditory cortex (16–18) and secondary auditory cortex (16, 17) (but see reference 19), with additional activation of frontal lobe areas, possibly reflecting the attempt to maintain an attentional set and strategy (17, 19–21).
Auditory attentional deficits in schizophrenia could be due to impairments in frontally mediated top-down executive control or to downstream dysfunction in one or more of the neural circuits used by the frontal lobes to modulate responsivity of distributed sets of auditory cortical neurons. Event-related potential paradigms have been used to study the neural basis of attentional deficits in schizophrenia. One study (22) used a binaural paradigm to compare attention effects when stimuli occurred fast (every 250–750 msec) and slow (every 500–1500 msec). Patients had normal N1 enhancement with attention at the fast but not at the slow rate. In another study (23), subjects needed to focus not only on one ear at a time, but also on one specific pitch within that ear, and to respond to slightly longer duration tones of that pitch. Healthy subjects and schizophrenia patients both showed Nd evidence of cross-ear selective attention, although Nd onset was delayed in the patients. Patients effectively focused attention on the relevant ear, but could not sustain this strategy to additionally focus attention on the relevant pitch within the relevant ear, suggesting a failure to use the hierarchical selective attention strategy used by the healthy subjects. Both studies found preserved selective attention function in patients for some dimension of auditory input but not for others.
A recent fMRI study (18) showed that schizophrenia patients had less frontal lobe activation during a cross-modal selective attention task than did healthy subjects but nevertheless demonstrated normal modulation of auditory processing in the primary auditory cortex. Because of the relatively poor temporal resolution of fMRI, it cannot elucidate whether attention affected the earliest afferent volley reaching the auditory cortex or later auditory processes. Moreover, it is unclear whether the reduction in frontal activity was relevant to the processes that modulate auditory cortical responsivity during selective attention or reflected deficits in other aspects of task performance such as maintenance of stimulus-response mapping rules.
In the current study, we used event-related potentials to assess auditory selective attention in schizophrenia in a simple cross-modality paradigm in which the exclusion of irrelevant stimuli is facilitated by an easy to apply modality filter. In one condition, subjects attended to one of two auditory signals while ignoring visual signals, and in the other condition, they attended to one of two visual signals while ignoring auditory signals. We assessed auditory processing during these two conditions. For healthy comparison subjects, we predicted that early event-related potential activity would reflect early filtering, showing enhancement of processing of auditory stimuli when attention was directed toward the auditory modality and away from the visual modality. For schizophrenia patients, two alternative hypotheses were considered. According to the first hypothesis, deficits in top-down executive control should globally compromise the implementation of an early filtering strategy while performing this cross-modal selective attention task, resulting in a uniform failure to modulate the set of auditory event-related potential components (P1, N1, N2) with attention. According to the second hypothesis, intact frontally mediated executive control but compromised selected frontotemporal circuits or intratemporal lobe circuits downstream could produce a pattern of sparing and loss of attentional modulation among these auditory event-related potential components.
Method
Subjects
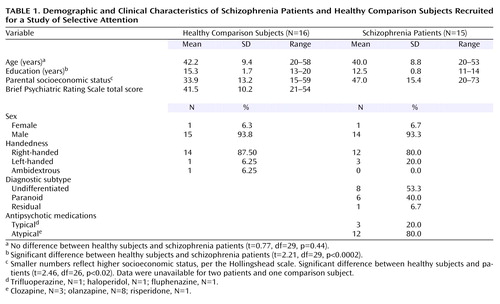
Demographic and clinical characteristics of patients (N=15) and healthy comparison subjects (N=16) are summarized in Table 1. All gave written informed consent after procedures had been fully described. The healthy comparison group was recruited by newspaper advertisements and word of mouth, screened by telephone using the psychiatric screening questions from the Structured Clinical Interview for DSM-IV (SCID) (24), and were excluded for any significant history of axis I psychiatric illness. Patients were recruited from community mental health centers as well as from inpatient and outpatient services of the Veterans Affairs Palo Alto Health Care System.
All patients met DSM-IV criteria for schizophrenia, determined either by 1) diagnosis from a psychiatrist or psychologist using the SCID or 2) consensus of a trained research assistant using the SCID and a clinical interview conducted by a psychiatrist or psychologist. In two cases, a psychiatrist made the diagnosis by patient chart review. Prospective participants were excluded if they met DSM-IV criteria for alcohol or drug abuse within 30 days before the study (several patients had a remote history of alcohol dependence). In addition, patient and comparison participants were excluded for significant head injury resulting in neurological sequelae, or neurological or other medical illnesses compromising the central nervous system.
Patient symptoms were assessed by two trained raters (including a psychiatrist or clinical psychologist) administering the 18-item Brief Psychiatric Rating Scale (BPRS) (25, 26) using a semistructured interview conducted on the same day (N=8), within 2 days (N=5), or within 1 week (N=2) of event-related potential testing. The average of the two ratings was used.
Experimental Procedure
Four types of stimuli (two auditory and two visual), each 250 msec long, were presented in random order at randomly occurring intervals of 800, 900, 1000, 1100, or 1200 msec. Auditory stimuli, presented through headphones, were loud and soft single-syllable speech sounds (“ba”) spoken by a woman. The loud sound was set to 25 dB above an individual subject’s sensation level (SL), and the soft sound was set to 15 db SL. The maximum level heard by a subject was 86 dB SPL (C-scale). Visual stimuli were 5×5 checkerboards of white and gray squares subtending 5° of visual angle, presented on a cathode ray tube placed 1.25 m in front of the subject. Checkerboards were bright (2.4 candelas/square foot) and dim (1.1 candelas/square foot). Differences between the loud and soft speech sounds and the bright and dim checkerboard patterns were adjusted until they were deemed 100% discriminable and equivalent across modalities, based on subjective judgments of laboratory personnel, matched in age to the subjects studied. The stimulus sequence was repeated twice, once as an auditory attention task (pressing the button in response to the soft speech sound) and once as a visual attention task (pressing the button in response to the dim checkerboard). The order of conditions was counterbalanced across subjects.
Event-Related Potential Procedure
Recording
Electroencephalograph (EEG) recordings were obtained from 35 scalp sites, but only event-related potentials from the Fz, Cz, and Pz leads are reported here. Vertical electro-oculograph (EOG) recordings were obtained from electrodes placed above and below the right eye, and horizontal EOG recordings were obtained from electrodes placed at the outer canthus of each eye. EEG and EOG samples were obtained every 2 msec. EEG was band-pass filtered between 0.05 and 40 Hz. Each trial’s 1100-msec epoch was subjected to linear detrending and was corrected for effects of eye blinks and eye movements based on correlations of vertical EOG and horizontal EOG with EEG recorded at each electrode (27). The average of the 100-msec prestimulus baseline was subtracted from each time point in the epoch. Only trials with correct responses were included in the averages, and subjects with fewer than 14 trials remaining were excluded. Thus, although data were collected from 17 healthy subjects and 19 patients, data from 16 healthy subjects and 15 patients are reported here.
Components
Only auditory event-related potentials are presented here. Inspection of the waveforms indicated that speech sounds elicited P1, N1, and N2 event-related potential components (the latter two representing the early and late aspects of Nd), with a P2 amplitude that was closely linked to that of N2. Because of its redundancy with N2, analysis of P2 will not be presented. We measured P1, N1, and N2 amplitudes at Fz, Cz, and Pz. P1 was the maximum positivity between 25 and 75 msec, N1 was the maximum negativity between 76 and 180 msec, and N2 was the maximum negativity between 190 and 340 msec. Large P300s were not elicited because of the equiprobable nature of the stimuli (28).
Behavioral data
We tallied the number of correct responses, false alarms (pressing a button in response to the wrong stimulus within the attended modality), misses (failing to press the button in response to the target), and errors (pressing the button in response to either stimulus in the unattended modality) and collected reaction times.
Statistical Analyses
Group differences in the behavioral data from the auditory and visual attention tasks were assessed separately using t tests for each variable. Separate repeated-measures analyses of variance (ANOVAs) for each component (amplitude and latency) were performed to assess the effects of group (healthy subjects versus schizophrenia patients), attention modality (auditory versus visual), stimulus (soft versus loud speech sound), and lead (Fz, Cz, Pz). It is important to note that the stimulus factor has two different meanings: in the auditory attention task, the stimulus factor contrasts targets (soft speech sounds) to nontargets (loud speech sounds); in the visual attention task, the stimulus factor contrasts the low-intensity soft speech sounds to the higher-intensity loud speech sounds even though both were nontargets. Thus, the stimulus effect during attention to the auditory modality reflected the effects of target detection. The stimulus effect during attention to the visual modality reflected the effects of speech sound intensity. Interactions were parsed using sub-analyses of variance. Greenhouse-Geisser corrections were used when appropriate. Relationships were assessed between event-related potential indices of cross-modal attention (event-related potential response at Cz to soft speech sounds during auditory attention versus visual attention) and clinical severity (total BPRS) using Pearson product-moment correlation analyses. In addition, to determine whether group differences in parental socioeconomic status or target detection accuracy could explain group differences in event-related potential indices of cross-modal selective attention, analyses of covariance (ANCOVAs) were performed.
Results
Behavior
Behavioral data appear in Table 2. Healthy subjects responded correctly to the soft speech targets more often than did patients, which was reflected in the lower percent correct responses in the patients. While reaction times tended to be somewhat slower in patients than in comparison subjects, this was not significant. There were no group differences in performance of the visual attention task. Healthy subjects responded slightly faster (t=4.44, df=29, p<0.05) but equally accurately (t=0.91, df=29, p=0.37) to visual and auditory targets, suggesting that the efforts to match discriminability of low- and high-intensity stimuli in each modality were successful.
Event-Related Potentials
Grand average event-related potentials in response to speech sounds during the auditory and visual attention modalities are plotted in Figure 1.
P1
Results of the repeated-measures ANOVA for the effects of the four factors (group, attention modality, stimulus, lead) on P1 amplitude appear in Table 3. As can be seen in Figure 2, there was a significant effect of cross-modal attention on P1 amplitude. Overall, P1 amplitude in response to the speech sounds was larger when subjects were attending to the auditory signals relative to visual signals. This effect was slightly stronger in the patients (F=4.59, df=1, 14, p=0.05) than in the healthy subjects (F=2.76, df=1, 15, p=0.12), although the interaction with group was not significant. This suggests that at a very early stage of processing (approximately 25–75 msec), auditory processing was similarly enhanced in patients and healthy subjects during the auditory attention modality relative to the visual attention modality.
There was also a significant attention modality-by-stimulus interaction, which again did not differ by group, suggesting differential effects of stimulus during attention to auditory and visual modalities. When attention was directed to the visual modality, P1 tended be affected by stimulus (Table 3), being somewhat larger to the loud speech sounds (2.0 μV) than to the soft speech sounds (1.4 μV), perhaps because of the simple effects of intensity on P1 in the absence of any auditory attention effects. When attention was directed to the auditory modality, P1 tended to be affected by stimulus (Table 3) but in the opposite direction, being smaller to the loud speech sounds (2.1 μV) than to the soft speech sounds (2.7 μV). While cross-modality effects could be distinguished as early as around 55 msec, attention effects within the auditory modality could not be, perhaps because of countervailing effects of attention and intensity on P1 amplitude. This interaction also indicates that the effect of cross-modal attention on P1 was mainly driven by the response to the soft speech sounds, suggesting that the combination of auditory attention and target detection was enough to overcome the intensity-driven reduction of the P1 to the soft speech sounds evident during attention to the visual modality.
The cross-modality P1 attention effects were not related to clinical severity (r=–0.30, df=13, p=0.28). The four-way (group-by-attention modality-by-stimulus-by-lead) ANOVA of P1 latency showed no significant effects.
N1
Results of the repeated-measures ANOVA for the effects of the four factors on N1 amplitude appear in Table 4. There was a significant group-by-attention modality interaction, indicating that in comparison subjects, but not patients, N1 amplitude response to speech sounds was larger when attending to the auditory relative to the visual modality (Figure 3). A significant attention modality-by-lead interaction indicated a stronger effect at Pz than at Fz or Cz.
Although patients and healthy subjects differed in parental socioeconomic status (Table 1), the group-by-attention modality interaction was not driven by this difference; results of the ANCOVA revealed that the slope of the relationship between parental socioeconomic status and the N1 attention effect did not differ for the two groups (F=0.11, df=1, 24, p=0.75), and the group difference in the N1 attention effect remained significant after controlling for parental socioeconomic status (F=6.14, df=1, 25, p=0.02). Similarly, although patients did not detect targets as accurately as the healthy subjects (Table 1), the slope of the relationship between performance and the N1 attention effect did not differ for the two groups (F=1.33, df=1, 27, p=0.26), and the group difference in the N1 attention effect remained significant after controlling for accuracy (F=5.78, df=1, 28, p=0.02). The N1 attention effect was not related to clinical severity (r=–0.30, df=13 , p=0.27). Because of previous reports of reduced auditory N1 amplitude in patients, we specifically assessed the group effect for N1 at Cz. Relative to healthy comparison subjects, patients had a significantly smaller N1 amplitude for both the soft speech sounds (F=3.19, df=1, 29, p<0.04, one-tailed) and loud speech sounds (F=2.78, df=1, 29, p=0.05, one-tailed) during auditory attention.
While sensitive to cross-modal attention effects, N1 amplitude was not sensitive to within-modality attention effects. That is, the target (soft speech sounds) did not elicit a larger N1 than the nontarget (loud speech sounds) during auditory attention (Table 4). To rule out the possibility that this could be due to the countervailing effects of intensity and attention on N1, we assessed the effects of stimulus on N1 during attention directed away from the auditory modality (visual attention) and found no stimulus intensity effect (Table 4).
N1 peaked at about 125 msec, and its latency was not affected by any of the experimental conditions.
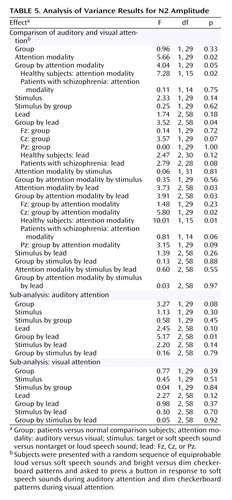
N2
Results of the repeated-measures ANOVA for the effects of the four factors on N2 amplitude and latency appear in Table 5. N2 amplitude in response to speech sounds was affected by significant group-by-attention modality-by-lead and group-by-attention modality interactions. Simply stated, in healthy subjects, N2 amplitude response to speech sounds was larger when subjects attended to the auditory modality than to the visual modality, despite the fact that the strength of this effect varied with lead, being strongest at Cz. Most important, the cross-modality effect on N2 was not significant in patients. This is plotted in Figure 4 for N2 amplitudes at Cz.
ANCOVA results revealed that the relationship between parental socioeconomic status and the N2 attention effect was not significantly different for the two groups (F=0.32, df=1, 24, p=0.58). While the group effect was somewhat diminished in significance when parental socioeconomic status was considered (F=3.08, df=1, 25, p=0.09), socioeconomic status was not significantly correlated with the N2 effect for either healthy subjects (r=0.16, df=14, p=0.56) or patients (r=0.06, df=13, p=0.84). The effects of target detection accuracy on the N2 attention effect did not differ for the two groups (F=0.05, df=1, 27, p=0.82), and the group difference remained significant after controlling for accuracy (F=4.59, df=1, 28, p=0.04). N2 attention effects were not significantly related to total BPRS scores (r=–0.45, df=13, p=0.10).
As with N1, N2 was insensitive to within-modality attention. To rule out the possibility that this could be due to the countervailing effects of intensity and attention on N2, we assessed the effects of stimulus on N2 when attention was directed away from the auditory modality (visual attention) and found no stimulus intensity effects (Table 5).
N2 was also affected by a group-by-lead interaction, although neither the effects of group at each lead nor the effects of lead for each group were significant (Table 5).
As can be seen in Figure 1, N2 was not elicited during attention to the visual modality, and although its amplitude could be estimated as a minimum voltage within a window, its latency could not be measured with confidence. Hence, N2 latency was only analyzed during auditory attention in a three-way (group-by-stimulus-by-lead) ANOVA. There was a significant main effect of stimulus (F=6.2, df=1, 29, p<0.02) such that N2 to the soft speech sound (target) was delayed relative to the loud speech sound (nontarget). The lack of a group-by-stimulus interaction suggests that target detection is associated with delayed processing in both patients and comparison subjects.
Discussion
The principal finding from the present study was that normal cross-modal selective attention effects were evident in the auditory event-related potentials of schizophrenia patients at the earliest attention-modulated component, the P1, but were not sustained in the later N1 and N2 components. These results argue against a global impairment in frontally mediated executive function as the basis for auditory selective attention deficits in schizophrenia, since top-down modulation of auditory versus visual attention was clearly evident in the enhanced P1 to the speech sounds during auditory attention. Thus, the pattern of sparing and loss of attentional modulation of these early event-related potential components suggests that the disruption of cross-modal selective attention resulted from deficits downstream from the frontal lobes where selective attention is presumably initiated.
This task could be accomplished with at least two strategies, filtering and pigeon-holing. With filtering, a class of items is initially included or excluded from further processing based on a common stimulus feature (e.g., sensory modality). Stimuli within the attended modality would then be allocated processing resources, while those in the unattended modality would be excluded from further processing. Depending on task demands, an initial bifurcation can happen at a relatively early point in the processing stream and result in an elaborate hierarchical processing strategy, as successive classes of stimuli are rejected from further processing (29). With pigeon-holing, all items, including nontargets, are fully processed in order to categorize and act upon the designated target. While neither strategy is realistic if taken to extremes (30), there is evidence from event-related potential studies that hierarchical selective attention, or filtering, does occur in the auditory system in healthy comparison subjects (29) but is abnormal in patients with schizophrenia (22, 23).
The pattern of event-related potential results suggests that comparison subjects used the optimal strategy of filtering at all stages of the processing stream, while patients used this strategy early in processing but did not sustain it. That is, healthy subjects and schizophrenia patients showed evidence of cross-modal attention effects as early as 55 msec (P1). In comparison subjects, this effect was sustained until about 300 msec, as reflected by larger N1 (125 msec) and N2 (280 msec) responses to auditory stimuli during auditory relative to visual attention. By about 300 msec, there was also evidence of within-modality attention, with a prolongation of auditory target relative to nontarget processing. This evidence of within-modality attention was seen in both groups, culminating in correct button press responses to the targets. Although patients were less accurate in detecting the soft speech sounds, the event-related potentials are based on only correct trials.
The tendency for P1 to be augmented by cross-modal attention in patients is consistent with fMRI data collected during a cross-modal attention task from schizophrenia patients who demonstrated normal modulation of auditory processing in the auditory cortex (18), where P1 is probably generated (31). In that study, both patients and comparison subjects showed dorsolateral prefrontal cortical activation during the selective attention task, but patients showed less extensive activation in this region. The fact that reduced prefrontal activity was not associated with reduced modulation of auditory cortex in patients suggests that this reduced activity may have been related to other aspects of task performance such as maintenance of stimulus-response mapping rules or response selection. If N1 and N2 are generated in the secondary auditory cortex, it is surprising that Ramsey et al. (18) did not observe secondary auditory cortex activation during auditory attention in comparison subjects. However, neuromodulatory effects reflected in N1 and N2 may be too fast or too small to be picked up by hemodynamic imaging techniques. Event-related potentials and fMRI offer complementary, but not necessarily overlapping, information about brain processes.
The observation that P1, but not N1 and N2, is modulated by attention in schizophrenia patients suggests that executive control is successfully exerted over early but not later auditory cortical signals. There are a number of possible neuroanatomical explanations for this finding, bearing in mind the caveat that anatomical attributions from our data involve some speculation. One possible explanation is that the frontal lobe successfully initiates the processing biases inherent to selective attention, but a subset of the frontotemporal neural pathways targeting the auditory cortical generators of N1 and N2 are compromised. This could represent an instance of functional disconnectivity that has been proposed as a major pathophysiological mechanism in schizophrenia (32, 33). A related possibility is that frontotemporal circuits are intact, but corticocortical connections linking auditory regions involved in early and later auditory processing may be faulty, leading to a breakdown in selective attention subsequent to early processing reflected by the P1. Another possibility is that the frontotemporal circuits are intact, but the integrity of some neuronal groups in the auditory cortex may be compromised, failing to respond to the modulatory input from the frontal cortex. Indirect evidence for this view comes from research suggesting abnormalities of glutamatergic neurotransmission at N-methyl-d-aspartic acid receptors in layer V neurons of the auditory cortex (34).
While all of the possibilities discussed so far implicate abnormalities downstream from the frontal cortex where selective attention is presumably initiated, frontal lobe impairment cannot be ruled out as a contributor to the neurophysiological deficits in cross-modal selective attention observed in the patients. For example, it is possible that a single frontal lobe attentional mechanism normally enhances auditory processing in the P1-generating and N1/N2-generating auditory cortical structures, but its effectiveness decays faster in patients than in comparison subjects. That is, this mechanism can enhance auditory processing until about 50 msec in patients, but by 100 msec, its effects have waned. It is also possible that two distinct frontal lobe areas exert independent control over the auditory cortical regions generating P1 and those generating N1 and N2, with the first being spared in the patients and the second being dysfunctional.
Intact selective attention effects on P1 in patients indicate that some aspects of executive control are operating normally. This finding is consistent with N1 data reported previously (22, 23). Despite the similarity of findings among those studies and ours, the earlier reports highlighted the attentional dimensions that showed impairments in schizophrenia patients, giving less emphasis to the selective attention effects that were intact in patients and their implications for executive function integrity. While we emphasize the evidence showing normal early neurophysiological cross-modal selective attention effects in schizophrenia, ours is not the first study to report elements of normal and abnormal executive control in patients. Curtis et al. (35) noted that attenuated frontal activation in schizophrenia is task dependent. Sullivan et al. (36) provided evidence from a factor analytic study of Wisconsin Card Sorting Test scores in schizophrenia patients that executive dysfunction is not a unitary construct. More recently, Turken et al. (37) reported normal effects of task-set shifting, stimulus-response compatibility, and preparatory attention together with abnormal error monitoring in patients with schizophrenia, all of which are presumably mediated by frontal cortex.
It is important to consider the role of auditory hallucinations in our findings. Most of the patients (N=12 of 15) were hallucinators, perhaps contributing to the auditory selective attention deficits. However, no association was found between severity of hallucinations experienced by patients in the month preceding the study as rated by the BPRS and P1, N1, or N2 attention effects.
Limitations
Patients had more difficulty on the auditory discrimination task than did the comparison subjects. However, it is unlikely that this would account for the small cross-modal attention effects we observed in the patients. First, only trials associated with correct discrimination performance were included, and second, more difficult discriminations are associated with greater attentional engagement, and therefore, with larger, not smaller, cross-modal selective attention effects (29). The generalizability of these findings to women with schizophrenia is limited by the fact that the study includes only one woman. Furthermore, while 12 of the 15 patients were receiving a variety of atypical antipsychotic medications at the time of testing, the design of the study precludes analysis of whether atypical antipsychotics as a class contributed to improved selective attention (38) or if type of atypical antipsychotic medication influenced selective attention (39).
The present study suggests that cross-modal selective attention deficits in schizophrenia are complex, resulting from compromise of frontotemporal neural circuits or subsets of distributed neuronal groups subserving the filtering functions at different temporal stages of the auditory processing stream. The neurophysiological data presented here do not support the view that selective attention deficits in schizophrenia result from a singular impairment in top-down executive control. The data also underscore the utility of high temporal resolution event-related potentials in elucidating patterns of neurophysiological sparing and loss in a manner not possible with high spatial resolution hemodynamic imaging methods such as positron emission tomography (PET) or fMRI.
 |
 |
 |
 |
 |
Presented in part at the 41st annual meeting of the Society for Psychophysiological Research, Montreal, Oct. 10–14, 2001, and the 40th annual meeting of the American College of Neuropsychopharmacology, Waikoloa, Hawaii, Dec. 9–13, 2001. Received Jan. 7, 2003; revisions received May 6 and Sept. 23, 2003; accepted Sept. 29, 2003. From the Department of Psychiatry, Yale University School of Medicine, New Haven, Conn.; the Psychiatry Service, VA Connecticut Health Care System, West Haven, Conn.; the Department of Psychiatry and Behavioral Sciences, Stanford University School of Medicine, Stanford, Calif.; and the Psychiatry Service, VA Palo Alto Health Care System, Palo Alto, Calif. Address reprint requests to Dr. Mathalon, Psychiatry Service–116A, VA Connecticut Healthcare System, 950 Campbell Ave., West Haven, CT 06516; [email protected] (e-mail). Supported by grants from the National Institute of Mental Health (MH-40052, MH-58262) and the Department of Veterans Affairs. The authors thank Sontine Kalba for help with implementing the paradigm and testing subjects; Mark Rothrock, M.D., for recruiting patient volunteers to our studies; William O. Faustman, Ph.D., for performing diagnostic interviews and symptom ratings; and Margaret J. Rosenbloom for help preparing the manuscript.

Figure 1. Grand Average Event-Related Potential Responses at Cz to Loud and Soft Speech Sounds During Auditory and Visual Attention Tasks in Healthy Comparison Subjects and Schizophrenia Patients
aCross-modal attention.

Figure 2. P1 Amplitude Response at Cz to Soft Speech Sounds During Selective Attention Tasks for Healthy Comparison Subjects and Schizophrenia Patients

Figure 3. N1 Amplitude Response at Cz to Soft Speech Sounds During Selective Attention Tasks for Healthy Comparison Subjects and Schizophrenia Patientsa
aNote that y axis is inverted for ease of comparison of negative and positive components.

Figure 4. N2 Amplitude Response at Cz to Soft Speech Sounds During Selective Attention Tasks for Healthy Comparison Subjects and Schizophrenia Patientsa
aNote that y axis is inverted for ease of comparison of negative and positive components.
1. Kraepelin E: Dementia Praecox and Paraphrenia (1919). Translated by Barclay RM; edited by Robertson GM. New York, Robert E Krieger, 1971Google Scholar
2. Bleuler E: Dementia Praecox or the Group of Schizophrenias (1908). Translated by Zinkin J. New York, International Universities Press, 1950Google Scholar
3. Andreasen NC: A unitary model of schizophrenia: Bleuler’s “fragmented phrene” as schizencephaly. Arch Gen Psychiatry 1999; 56:781–787Crossref, Medline, Google Scholar
4. Meltzer HY: Treatment of schizophrenia and spectrum disorders: pharmacotherapy, psychosocial treatments, and neurotransmitter interactions. Biol Psychiatry 1999; 46:1321–1327Crossref, Medline, Google Scholar
5. Green MF: What are the functional consequences of neurocognitive deficits in schizophrenia? Am J Psychiatry 1996; 153:321–330Link, Google Scholar
6. Mirsky AF, Duncan CC: Etiology and expression of schizophrenia: neurobiological and psychosocial factors. Ann Rev Psychol 1986; 37:291–319Crossref, Medline, Google Scholar
7. Broadbent DE: Perception and Communication. Oxford, UK, Pergamon Press, 1958Google Scholar
8. Deutsch JA, Deutsch D: Attention: some theoretical considerations. Psychol Rev 1963; 70:80–90Crossref, Medline, Google Scholar
9. Broadbent DE: Decision and Stress. London, Academic Press, 1971Google Scholar
10. Broadbent DE: Stimulus set and response set: two kinds of selective attention, in Attention: Contemporary Theory and Analysis. Edited by Mostofsk DI. New York, Appleton-Century-Crofts, 1977, pp 51–60Google Scholar
11. Hillyard SA, Hink RF, Schwent VL, Picton TW: Electrical signs of selective attention in the human brain. Science 1973; 182:177–180Crossref, Medline, Google Scholar
12. Hansen JC, Hillyard SA: Endogenous brain potentials associated with selective auditory attention. Electroencephalogr Clin Neurophysiol 1980; 49:277–290Crossref, Medline, Google Scholar
13. Pantev C, Elbert T, Makeig S, Hampson S, Eulitz C, Hoke M: Relationship of transient and steady-state auditory evoked fields. Electroencephalogr Clin Neurophysiol 1993; 88:389–396Crossref, Medline, Google Scholar
14. Hackley SA, Woldorff M, Hillyard SA: Cross-modal selective attention effects on retinal, myogenic, brainstem, and cerebral evoked potentials. Psychophysiology 1990; 27:195–208Crossref, Medline, Google Scholar
15. Woods DL, Alho K, Algazi A: Intermodal selective attention, 1: effects on event-related potentials to lateralized auditory and visual stimuli. Electroencephalogr Clin Neurophysiol 1992; 82:341–355Crossref, Medline, Google Scholar
16. Jancke L, Mirzazade S, Shah NJ: Attention modulates activity in the primary and the secondary auditory cortex: a functional magnetic resonance imaging study in human subjects. Neurosci Lett 1999; 266:125–128Crossref, Medline, Google Scholar
17. Jancke L, Buchanan T, Lutz K, Shah N: Focused and nonfocused attention in verbal and emotional dichotic listening: an FMRI study. Brain Lang 2001; 78:349–363Crossref, Medline, Google Scholar
18. Ramsey NF, van Atteveldt N, Cahn W, Kahn R: Top down attentional modulation of primary auditory cortex in schizophrenia, in Proceedings From the Annual Meeting of the Organization for Human Brain Mapping. Minneapolis, OHBM, 2001Google Scholar
19. Taylor J, Jancke L, Shah N, Nosselt T, Schmitz N, Himmelback M, Kalenscher T, Muller-Gartner H: A three stage model of awareness: formulation and initial experimental support. Neuroreport 1998; 9:1787–1792Crossref, Medline, Google Scholar
20. Tzourio N, El Massioui F, Crivello F, Joliot M, Renault B, Mazoyer B: Functional anatomy of human auditory attention studied with PET. Neuroimage 1997; 5:63–77Crossref, Medline, Google Scholar
21. Pugh KR, Shaywitz BA, Fulbright RK, Byrd D, Skudlarski P, Katz L, Constable RT, Fletcher J, Lacadie C, Marchione K, Gore JC: Auditory selective attention: an fMRI investigation. Neuroimage 1996; 4:159–173Crossref, Medline, Google Scholar
22. Baribeau J, Picton TW, Gosselin JY: Schizophrenia: a neuro-physiological evaluation of abnormal information processing. Science 1983; 219:874–877Crossref, Medline, Google Scholar
23. Michie PT, Fox AM, Ward PB, Catts SV, McConaghy N: Event-related potential indices of selective attention and cortical lateralization in schizophrenia. Psychophysiology 1990; 27:209–227Crossref, Medline, Google Scholar
24. First MB, Spitzer RL, Gibbon M, Williams JBW: Structured Clinical Interview for DSM-IV Axis I Disorders. New York, Biometrics Research Department, New York State Psychiatric Institute, 1995Google Scholar
25. Headlund JL, Vieweg BW: The Brief Psychiatric Rating Scale (BPRS): a comprehensive review. J Operational Psychiatry 1980; 11:48–65Google Scholar
26. Overall JE, Hollister L, Pichot R: Major psychiatric disorders: a four-dimensional model. Arch Gen Psychiatry 1967; 16:146–151Crossref, Medline, Google Scholar
27. Gratton G, Coles MGH, Donchin E: A new method for off-line removal of ocular artifact. Electroencephalogr Clin Neurophysiol 1983; 55:468–484Crossref, Medline, Google Scholar
28. Duncan-Johnson CC, Donchin E: On quantifying surprise: the variation in event-related potentials with subjective probability. Psychophysiology 1977; 14:456–467Crossref, Medline, Google Scholar
29. Hansen JC, Hillyard SA: Selective attention to multidimensional auditory stimuli. J Exp Psychol 1983; 9:1–19Google Scholar
30. Treisman AM: Monitoring and storage of irrelevant messages in selective attention. J Verb Learn Verb Behav 1964; 3:449–459Crossref, Google Scholar
31. Woldorff MG, Gallen CC, Hampson SA, Hillyard SA, Pantev C, Sobel D, Bloom FE: Modulation of early sensory processing in human auditory cortex during auditory selective attention. Proc Natl Acad Sci USA 1993; 90:8722–8726Crossref, Medline, Google Scholar
32. Ford JM, Mathalon DH, Whitfield S, Faustman WO, Roth WT: Reduced communication between frontal and temporal lobes during talking in schizophrenia. Biol Psychiatry 2002; 21:485–492Crossref, Google Scholar
33. Friston KJ, Frith CD: Schizophrenia: a disconnection syndrome? Clin Neurosci 1995; 3:89–97Medline, Google Scholar
34. Javitt D, Jayachandra M, Lindsley R, Specht C, Schroeder C: Schizophrenia-like deficits in auditory P1 and N1 refractoriness induced by the psychomimetic agent phencyclidine (PCP). Clin Neurophysiol 2000; 111:833–836Crossref, Medline, Google Scholar
35. Curtis V, Bullmore E, Morris R, Brammer M, Williams S, Simmons A, Sharma T, Murray R, McGuire P: Attenuated frontal activation in schizophrenia may be task dependent. Schizophr Res 1999; 37:35–44Crossref, Medline, Google Scholar
36. Sullivan EV, Mathalon DH, Zipursky RB, Kersteen-Tucker Z, Knight RT, Pfefferbaum A: Factors of the Wisconsin Card Sorting Test as a test of dorsolateral prefrontal cortical function in schizophrenia and alcoholism. Psychiatry Res 1993; 46:175–199Crossref, Medline, Google Scholar
37. Turken AU, Vuilleumier P, Mathalon DH, Swick D, Ford JM: Are impairments of action monitoring and executive control true dissociative dysfunctions in patients with schizophrenia? Am J Psychiatry 2003; 160:1881–1883Link, Google Scholar
38. Keefe RS, Silva SG, Perkins DO, Lieberman JA: The effects of atypical antipsychotic drugs on neurocognitive impairment in schizophrenia: a review and meta-analysis. Schizophr Bull 1999; 25:201–222Crossref, Medline, Google Scholar
39. Bilder RM, Goldman RS, Volavka J, Czobor P, Hoptman M, Sheitman B, Lindenmayer J-P, Citrome L, McEvoy J, Kunz M, Chakos M, Cooper TB, Horowitz TL, Lieberman JA: Neurocognitive effects of clozapine, olanzapine, risperidone, and haloperidol in patients with chronic schizophrenia or schizoaffective disorder. Am J Psychiatry 2002; 159:1018–1028Link, Google Scholar