The Human Genome: Gene Expression Profiling and Schizophrenia
Schizophrenia is a complex psychiatric disorder without known causes or mechanisms and with divergent possibilities of pathological agents. Because the convergence of observations from a variety of lines of evidence has implicated the dorsal prefrontal cortex as a site of abnormalities in schizophrenia, we examined changes in gene expression from that region in postmortem brain samples, comparing matched pairs of subjects with schizophrenia and normal comparison subjects. Microarray technology provided an opportunity for application of gene expression analysis in an unbiased manner to a complex clinical disease. We designed a step-wise analysis beginning with a high-density cDNA microarray examination of approximately 8,000 gene transcripts in matched subject pairs. The microarray data were then analyzed by profiling more than 250 groups of functionally related gene products and testing these “gene groups” across subjects. Then, for those specific gene products showing a difference between schizophrenic and comparison subjects, the array differences were verified in additional tissue specimens by using standard molecular biological techniques. The image (left panel) shows a portion of the overall 8,000-gene microarray in which every individual spot represents a distinct gene. The red and green spots denote genes that show different expression levels between a subject with schizophrenia and the matched comparison subject, whereas the yellow spots indicate genes with similar levels of expression in the two subjects. A high-powered image of one of the spots (upper right) shows the difference between the subjects in NSF (N-ethylmaleimide-sensitive factor) expression. That difference is verified by using tissue sections and in situ hybridization analysis with a specific NSF probe (lower right). NSF is a protein that is involved in neuronal presynaptic secretory machinery and was a member of the gene group by that same name in this experiment. Expression for NSF was decreased in each of the 10 subjects with schizophrenia examined in this study. This investigation of a complex psychiatric illness such as schizophrenia yielded valuable data because it started with the powerful high-density cDNA microarray technique to identify gene candidates in an unbiased approach, used data mining statistics to find the gene group affected, and then confirmed alterations in the expression of individual genes by using conventional molecular biological analyses. This approach can serve to identify molecular candidates for complex diseases that are potentially important to the pathophysiology of the illness.
Address reprint requests to Dr. Tamminga, Maryland Psychiatric Research Center, University of Maryland, P.O. Box 21247, Baltimore, MD 21228; [email protected] (e-mail). The images are courtesy of the authors.
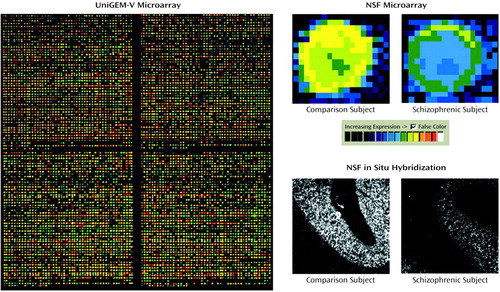
Figure.
mRNA from each of two tissue samples (one from a subject with schizophrenia and one from a comparison subject) was labeled with the fluorescent tag Cy3 (red) or Cy5 (green) and hybridized onto a UniGEM-V cDNA microarray (left panel). Each spot represents one of approximately 8,000 genes represented on the microarray. When the two images are superimposed, for each individual gene, yellow represents an equivalent level of expression in the two tissue samples, whereas green indicates greater expression in the sample labeled with Cy5, and red indicates greater expression in the sample labeled with Cy3. The gene for N-ethylmaleimide-sensitive factor (NSF), a synaptic protein (right panel), showed decreased expression in the subject with schizophrenia (and all others examined), both by microarray (upper right) and in situ hybridization (lower right) analyses.