Seasonal Variation of Violence in Norway
Abstract
OBJECTIVE: Seasonal variations of violence have been the subject of some controversy. Norway, situated between latitudes 58° and 72° N, has considerable seasonal variations of light and provides a good opportunity for studies of seasonality. METHOD: The monthly numbers of police reports of violent incidents in 1991–1997 were obtained for the entire Norwegian population of 4,450,000 inhabitants and separately for each of seven Norwegian cities at different latitudes. RESULTS: A total of 82,537 episodes of violence were recorded. There was a significant variation in violent incidents between months, with a minimum daily frequency of 28.7 in March and a maximum daily frequency of 35.1 in June. The frequency curve had one significant peak in May through June and another significant peak in October through November. The monthly frequency of violence correlated with the absolute value of monthly change in length of day from the previous month. In the seven cities the highest monthly ratio of observed to expected frequencies increased with latitude. With increasing latitude, the months with the largest increase in violence came later both in the spring and in the fall. CONCLUSIONS: There is a distinct pattern of seasonal variation in the frequency of violence that varies systematically with latitude. This pattern resembles the seasonal pattern of some forms of suicide, hospitalization for affective disorders, and mood and activity in the general population.
The existence and possible explanation of seasonal variations in the frequency of violence has been a question of some controversy. Some authors have described seasonal variation for numbers of homicides (1), whereas others find no such variation (2). We have found few reports of seasonal variation of mild and moderately violent acts outside institutions. Michael and Zumpe described a peak in the frequency of violence in the months with the highest temperatures in several locations in the United States (3, 4). Feldman and Jarmon reported a variation in the frequency of violence with changes in air pollution in Newark, N.J. (5). The seasonality of violence has been described in some studies of psychiatric inpatients and seems linked to patients with affective disorders (6–8).
Some psychiatric phenomena, such as affective disorders (9–15), suicide (2, 16, 17), and hospitalization for anorexia (18), have also been found to show seasonal variation. In the general population, seasonal variations in mood, weight, and times of sleep and activity have been demonstrated (9, 19–22). Of several physiological factors described both to have seasonal patterns and to be linked to violence, serotonin has received much attention (23–27).
Both social (16) and physical environmental factors have been suggested as causes of the seasonal patterns of human behavior. Among physical environmental factors, temperature (3, 28, 29), air pollution (5), and atmospheric pressure (30) have been suggested as possibilities. At least two hypotheses involving changes in light (1, 29, 31) have been suggested: 1) the length of day, with maximum impact at midsummer, is a significant factor for seasonal patterns of behavior; and 2) the change in length of day, with maximum impact at the equinoxes, has a major effect (7). Both hypotheses may include a few weeks’ delay for the light to sufficiently influence biological systems. Because the length of day varies with latitude, these hypotheses may imply different frequency patterns at different latitudes.
Norway is situated far north, with extreme seasonal variations of light and rather low temperatures during the summer; thus there is no effect from extremely hot weather. Only a small proportion of the population lives in urban areas affected by air pollution. The country is located from 58° to 72° N and appears to be well suited for the study of the influence of light on human behavior and seasonality.
The aim of the present study was to examine possible seasonal variations of violence in Norway. Based on studies of seasonal variations in the frequencies of other forms of human behavior (10, 32, 33), our hypotheses were that there are one or more peaks in the frequency of violent behavior, that the peaks are seen 1–2 months after the equinoxes, when the changes in the length of day are the largest, or that one peak in frequency is linked to one of the solstices. We also hypothesized that a seasonal variation in the frequency of violence changes with latitude in terms of 1) the magnitude in the range of monthly frequencies, 2) the magnitude of the highest ratio between the observed and the expected monthly frequencies, 3) the months in which the peaks in frequencies occur, and 4) the months in which the largest increases in violence from one month to the next occur.
Method
Population
Norway has a fairly stable population of 4,450,000 inhabitants, and the country is situated between latitudes 58° and 72° N. The climate is milder than at comparable latitudes in North America and Asia due to Gulf Stream warmth. The area located above the Arctic Circle (66° 30′ N), with 450,000 inhabitants, has periods of midnight sun during the summer and daytime polar nights in the winter. The rate of serious violent crimes in Norway is low, with an average of 42 homicides each year in 1991–1997 (0.9 per 100,000 inhabitants per year). All offenses reported to the police in Norway are recorded by Statistics Norway, Norway’s central institution for official data.
Incidents Included
At the end of each month each police district reports the number of violent incidents to Statistics Norway for that same month. All violent incidents reported to the police in 1991–1997, a total of 82,537, are included in this study. The monthly figures for the whole country were obtained from Statistics Norway. All homicides, attempted murders, and infliction of grievous bodily harm were included in the numbers; however, most of the incidents are assaults. Violence against police officers, rape, and attempted rape were excluded. These offenses are statistically reported elsewhere. In 1991–1997 the total number of these offenses was 8,383.
In addition, monthly numbers of violent incidents for each of the seven cities at different latitudes were independently obtained to reveal possible south-north patterns. The cities included were the largest city in each of the three counties north of the Arctic Circle and the four largest cities south of the Arctic Circle. The latitudes, numbers of inhabitants, maximum lengths of day, and the numbers of violent incidents for the cities are described in Table 1.
Assessments
The observed number of episodes in each month was the sum of the episodes in that month for all 7 years. On the basis of the expectation that the numbers of violent episodes were the same every day during the 7 years, the expected number of episodes in each month was calculated by taking into account the different numbers of days in each month and in leap years. The ratios between the observed and expected numbers of episodes for each month were calculated for the whole country and for each of the seven cities. The result from calculating the expected number of episodes was used in chi-square tests.
The mean monthly length of day was calculated as the mean time from sunrise to sunset in a month. Records of hours from sunrise to sunset for the seven cities in the study were obtained from the Institute of Theoretical Astrophysics, University of Oslo (personal communication).
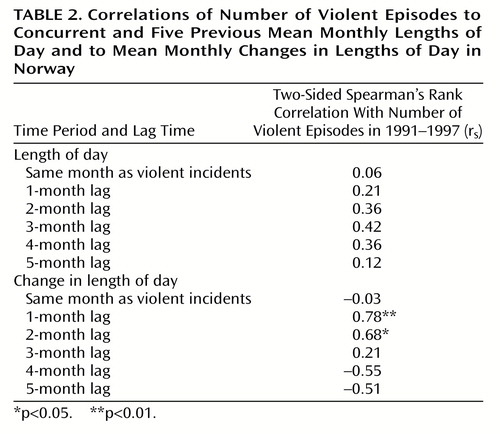
To describe the speed of change in the length of day for a specific month, the monthly change in length of day was defined as the mean monthly length of day in any month subtracted from the mean monthly length of day in the preceding month. To describe a delayed reaction, we correlated the change in length of day with the figures for the frequency of violence for each of the subsequent 5 months. To include both positive and negative changes in length of day as possible equivalent stressors, we used the absolute values of monthly changes in the length of day in the study. A ranking of the mean monthly length of day and of the monthly change in length of day would be the same in the whole northern hemisphere.
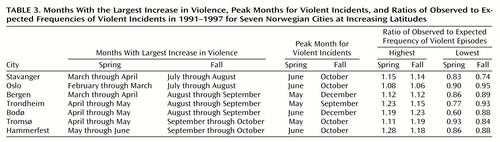
The range of the ratios for observed to expected frequencies for the 12 months and the highest monthly ratios for observed to expected frequencies were calculated for each of the seven cities. On the basis of the observation of two peaks of frequency for the whole country, the peak months in the seven cities were defined as the months in spring (January through June) and fall (July through December) with the highest ratios of observed to expected frequencies. The ratio of observed to expected frequencies for any month was subtracted from the ratio of observed to expected frequencies for the preceding month to calculate the monthly change in the frequency of violence, and the months with the largest increase in the frequency of violence were identified for spring and fall separately.
Statistics
The chi-square test for multinominals was used to measure overall deviations between months. The null hypothesis was that violent incidents occur with a frequency proportional to the length of the time interval. The 95% confidence intervals (CIs) were calculated by using the method described by Tiihonen et al. (1) and Wonnacott and Wonnacott (34). The 95% CIs for the ratio of observed to expected frequencies for a month could not contain 1 if we wished to conclude that the frequency for that month differed from the expected frequency.
Two-sided Spearman’s rank correlation coefficients (rs) were calculated between the observed number of violent episodes in a month and both the mean monthly length of day and the monthly change in length of day. We calculated these values with a delay of 1–5 months on the basis of the assumption that the effect of a change in daylight might not be immediate. Both the range of the ratios of observed to expected frequencies and the highest monthly ratios for observed to expected frequencies for each of the seven cities were correlated with the latitudes of the cities by using Pearson’s bivariate method.
The sequential numbers of the months (e.g., January=1, December=12) with peaks of violence incidents in the spring and fall for the seven selected cities were correlated with the latitudes of the same cities by using rs. The numbers of the months with the largest increase in violence in the spring and fall for each of the seven cities were correlated with the latitudes of the same cities by using rs.
Results
The seasonal profile of variations in violence, given as ratios of observed to expected frequencies of violence for each month, is shown in Figure 1. February, March, April, and August (95% CI lower than 1) and May, June, October, and November (95% CIs higher than 1) all had 95% CIs outside the range of 1 and produced results different from those expected. January, July, September and December had 95% CIs that contained 1. The frequency curve of the number of episodes peaked in May through June and again in October through November. There were nadirs of violent episodes in March and August and lower-than-expected values obtained from February through April and in August.
The mean daily frequency of episodes for each month varied between 28.74 for March and 35.11 for June. The monthly frequencies deviated significantly from expected values (χ2=343.08, df=11, p<0.0001).
Table 2 shows that there was no significant correlation between the monthly change in length of day and the frequency of violence in the same month, but there was a high and significant correlation between the frequency of violence for any month and the monthly change in length of day (rs=0.78, N=12, p<0.01). There was a smaller, but significant, correlation with a delay of 2 months (rs=0.68, N=12, p<0.05). The mean monthly length of day showed no significant correlations with the frequency of violence.
All seven cities included in the analysis had a peak month of violence in late spring and another peak month in the fall. The peak months and peak levels in the spring and fall for the seven cities are given in Table 3.
For the seven cities, the highest monthly ratio of observed to expected frequency of violent incidents correlated significantly with increasing latitude (r=0.78, N=7, p<0.05), but the range of the ratio of observed to expected frequency did not vary significantly with latitude (r=0.46, N=7, p>0.20). The order of the peak months in the spring (rs=–0.14, N=7, p>0.20) and the fall (rs=0.00, N=7, p=1.00) did not correlate with latitude. There was, however, a significant correlation between latitude and the numbers of the months with the largest increase in violence in the spring (rs=0.90, N=7, p<0.01) and in the fall (rs=0.95, N=7, p<0.01), indicating that the increase in violence later came further north, although the peak months showed no such displacement (see Table 3).
Discussion
In Norway the frequencies of violence vary between months, with a nadir in February through April, a peak in May or June, a weaker nadir in August, and another peak in October or November. There was a significant correlation between the monthly frequency of violence and the monthly change in length of day from the previous month. This finding supports the hypothesis that the change in length of day around the equinoxes may represent an environmental factor facilitating violent behavior and that the effect takes several weeks to establish.
In studies of seasonal variation of violence and other forms of human behavior, some authors have reported patterns of variations throughout the year, with a peak in the spring and another in the fall (16, 29, 32). Other authors have found only one peak (1, 11) or no seasonal variation at all (35). Methodological differences could explain some of these variations. The studies differ in the number of incidents or persons included as well as in the length and start of the time intervals studied. Both weeks (2), months (1, 15, 16), and seasons (11, 20, 35) have been defined as units of measurement. The use of seasons might possibly include both high and low frequencies in one unit and thus obscure existing variations. In addition, variations in geographical locations, climatic, and genetic and social factors could explain some differences. Summer temperatures are only moderately high in Norway, and we would expect high summer temperatures to play a lesser role in the annual variance of violence in Norway than in countries with hotter summers. Although air pollution cannot be ruled out as a contributor to the seasonal variation of violence, only a small proportion of the Norwegian population is exposed to variations in air pollution that have been described as inflicting variations in the frequency of violence activities in other studies (5). A possible role of cultural and social factors cannot be excluded.
Our finding of two peaks in the seasonal pattern of variation in the frequency of violence resembles the pattern of variations described for some forms of suicide (16, 17, 33), hospitalization for affective disorders (10, 14, 15), and mood and activity in the general population (9, 22). The finding of two peaks, correlated with changes in the length of day, is compatible with the hypothesis of seasonal variations, with peaks 1–2 months after the equinoxes, but not with seasonal variations linked to one of the solstices.
In the present study the highest monthly ratios of observed to expected frequency of violent incidents increased, and the months with the largest increase in violence occurred later both in the spring and in the fall with increasing latitude, but the magnitude of the seasonal variations did not increase significantly with higher latitude. Because the ranking of the monthly change in length of day was the same at all latitudes, other factors could have influenced the progressive delay in the timing of the seasonal upsurge in violent episodes with increasing latitude.
Studies of seasonal affective disorder have compared seasonal variation at different latitudes (36–39). Seasonal affective disorder seems to be more frequent at higher latitudes. This increase with latitude, however, seems to stop south of 60º N (36, 38). In the present study the highest monthly ratios of observed to expected frequencies for violence increased with latitude in the seven cities located between latitudes 59° and 71° N, but there was no significant correlation between the magnitude of the range of the monthly ratios of observed to expected frequencies and latitude.
Hakko et al. (32), while analyzing studies reporting seasonal variations in the frequency of suicide, found that a delay in peak frequency from spring toward summer was related to distance from the equator. In our study the change from low frequency to high frequency of violence in the general population came later with increasing distance from the equator, whereas the peak in violent incidents did not. The relation between the frequency peak and the speed in change in the length of day, and the postponement of the frequency changes with increasing latitude, makes it tempting to infer that the observed variations were heavily influenced by changes in light. The changes in the frequency of violence seem to be linked to changes in the length of day, not to the total length of day. This could explain why the frequency peaks in both the spring and fall. This tendency during fall has not been described before and therefore requires replication. The latitudinal postponement of the changes in the frequency of violent incidents needs some additional explanation.
How light could influence violent behavior is not clear, but low CSF 5-hydroxyindoleacetic acid and low serotonergic activity have been associated with violent behaviors (26, 27). From studies of the seasonality of mood disorders, which is also presumably linked to serotoninergic activity, there are indications that light may influence central nervous system serotoninergic activity (35). Violence and injury induced by light therapy have been reported (40).
Violence is a major problem, and the variations we observed are considerable, with the number of violent acts at peaks that were 21% higher than during the periods with the lowest frequency of violence. An understanding of the mechanisms behind these variations in violent behavior could possibly increase our understanding of human violence in general and the factors contributing to its regulation.
 |
 |
 |
Received April 13, 1999; revisions received Sept. 22, 1999, and Feb. 16, 2000; accepted March 9, 2000. From the Department of Psychiatry and Behavioural Medicine, the Medical Faculty, the Norwegian University of Science and Technology. Address reprint requests to Dr. Morken, Department of Psychiatry and Behavioural Medicine, NTNU, Box 3008 Lade, N-7002 Trondheim, Norway; gunnar.morken@ medisin.ntnu.no (e-mail).

Figure 1. Ratio of Observed to Expected Monthly Frequency for 82,537 Violent Incidents Reported to the Norwegian Police in 1991–1997
1.. Tiihonen J, Räsänen P, Hakko H: Seasonal variation in the occurrence of homicide in Finland. Am J Psychiatry 1997; 154:1711–1714Google Scholar
2.. Maes M, Cosyns P, Meltzer HY, De Meyer F, Peeters D: Seasonality in violent suicide but not in nonviolent suicide or homicide. Am J Psychiatry 1993; 150:1380–1385Google Scholar
3.. Michael RP, Zumpe D: Sexual violence in the United States and the role of season. Am J Psychiatry 1983; 140:883–886Link, Google Scholar
4.. Michael RP, Zumpe D: An annual rhythm in the battering of women. Am J Psychiatry 1986; 143:637–640Link, Google Scholar
5.. Feldman HS, Jarmon RG: Factors influencing criminal behavior in Newark: a local study in forensic psychiatry. J Forensic Sci 1979; 24:234–239Medline, Google Scholar
6.. D’Mello DA, McNeil JA, Msibi B: Seasons and bipolar disorder. Ann Clin Psychiatry 1995; 7:11–18Crossref, Medline, Google Scholar
7.. Roitman G, Orev E, Schreiber G: Annual rhythms of violence in hospitalized affective patients: correlation with changes in the duration of the daily photoperiod. Acta Psychiatr Scand 1990; 82:73–76Crossref, Medline, Google Scholar
8.. Coldwell JB, Naismith LJ: Violent incidents on special care wards in a special hospital. Med Sci Law 1989; 29:116–123Crossref, Medline, Google Scholar
9.. Wehr TA, Rosenthal NE: Seasonality and affective illness. Am J Psychiatry 1989; 146:829–839Link, Google Scholar
10.. Eastwood MR, Peacocke J: Seasonal patterns of suicide, depression and electroconvulsive therapy. Br J Psychiatry 1976; 129:472–475Crossref, Medline, Google Scholar
11.. Silverstone T, Romans S, Hunt N, McPherson H: Is there a seasonal pattern of relapse in bipolar affective disorders? a dual northern and southern hemisphere cohort study. Br J Psychiatry 1995; 167:58–60Crossref, Medline, Google Scholar
12.. Frangos E, Athanassenas G, Tsitourides S, Psilolignos P, Robos A, Katsanou N, Bugaris C: Seasonality of the episodes of recurrent affective psychoses: possible prophylactic interventions. J Affect Disord 1980; 2:239–247Crossref, Medline, Google Scholar
13.. Symonds RL, Williams P: Seasonal variation in the incidence of mania. Br J Psychiatry 1976; 129:45–48Crossref, Medline, Google Scholar
14.. Walter SD: Seasonality of mania: a reappraisal. Br J Psychiatry 1977; 131:345–350Crossref, Medline, Google Scholar
15.. Carney PA, Fitzgerald CT, Monaghan CE: Influence of climate on the prevalence of mania. Br J Psychiatry 1988; 152:820–823Crossref, Medline, Google Scholar
16.. Lester D: Seasonal variation in suicide deaths. Br J Psychiatry 1971; 118:627–628Crossref, Medline, Google Scholar
17.. Näyhä S: The bi-seasonal incidence of some suicides: experience from Finland by marital status, 1961–1976. Acta Psychiatr Scand 1983; 67:32–42Crossref, Medline, Google Scholar
18.. Götestam KG, Eriksen L, Heggestad T, Nielsen S: Prevalence of eating disorders in Norwegian general hospitals 1990–1994: admissions per year and seasonality. Int J Eat Disord 1998; 23:57–64Crossref, Medline, Google Scholar
19.. Kasper S, Wehr TA, Bartko JJ, Gaist PA, Rosenthal NE: Epidemiological findings of seasonal changes in mood and behavior: a telephone survey of Montgomery County, Maryland. Arch Gen Psychiatry 1989; 46:823–833Crossref, Medline, Google Scholar
20.. Schlager D, Schwartz JE, Bromet EJ: Seasonal variations of current symptoms in a healthy population. Br J Psychiatry 1993; 163:322–326Crossref, Medline, Google Scholar
21.. Haggag A, Eklund B, Linaker O, Götestam KG: Seasonal mood variation: an epidemiological study in northern Norway. Acta Psychiatr Scand 1990; 81:141–145Crossref, Medline, Google Scholar
22.. Okawa M, Shirakawa S, Uchiyama M, Oguri M, Kohsaka M, Mishima K, Sakamoto K, Inoue H, Kamei K, Takahashi K: Seasonal variation of mood and behaviour in a healthy middle-aged population in Japan. Acta Psychiatr Scand 1996; 94:211–216Crossref, Medline, Google Scholar
23.. Brewerton TD, Berrettini WH, Nurnberger JI Jr, Linnoila M: Analysis of seasonal fluctuations of CSF monoamine metabolites and neuropeptides in normal controls: findings with 5HIAA and HVA. Psychiatry Res 1988; 23:257–265Crossref, Medline, Google Scholar
24.. Losonczy MF, Mohs RC, Davis KL: Seasonal variations of human lumbar CSF neurotransmitter metabolite concentrations. Psychiatry Res 1984; 12:79–87Crossref, Medline, Google Scholar
25.. Maes M, Scharpé S, Verkerk R, D’Hondt P, Peeters D, Cosyns P, Thompson P, De Meyer F, Wauters A, Neels H: Seasonal variation in plasma l-tryptophan availability in healthy volunteers: relationships to violent suicide occurrence. Arch Gen Psychiatry 1995; 52:937–946Crossref, Medline, Google Scholar
26.. Lidberg L, Tuck JR, Asberg M, Scalia-Tomba GP, Bertilsson L: Homicide, suicide and CSF 5-HIAA. Acta Psychiatr Scand 1985; 71:230–236Crossref, Medline, Google Scholar
27.. Virkkunen M, Rawlings R, Tokola R, Poland RE, Guidotti A, Nemeroff C, Bissette G, Kalogeras K, Karonen SL, Linnoila M: CSF biochemistries, glucose metabolism, and diurnal activity rhythms in alcoholic, violent offenders, fire setters, and healthy volunteers. Arch Gen Psychiatry 1994; 51:20–27Crossref, Medline, Google Scholar
28.. Anderson CA: Temperature and aggression: ubiquitous effects of heat on occurrence of human violence. Psychol Bull 1989; 106:74–96Crossref, Medline, Google Scholar
29.. Souêtre E, Salvati E, Bélugou JL, Douillet P, Braccini T, Darcourt G: Seasonality of suicides: environmental, sociological and biological covariations. J Affect Disord 1987; 13:215–325Crossref, Medline, Google Scholar
30.. Mills CA: Suicides and homicides and their relation to weather changes. Am J Psychiatry 1934; 91:669–677Link, Google Scholar
31.. Wehr TA, Rosenthal NE, Sack DA: Environmental and behavioral influences on affective illness. Acta Psychiatr Scand Suppl 1988; 341:44–52Crossref, Medline, Google Scholar
32.. Hakko H, Räsänen P, Tiihonen J: Seasonal variation in suicide occurrence in Finland. Acta Psychiatr Scand 1998; 98:92–97Crossref, Medline, Google Scholar
33.. Meares R, Mendelsohn FA, Milgrom-Friedman J: A sex difference in the seasonal variation of suicide rate: a single cycle for men, two cycles for women. Br J Psychiatry 1981; 138:321–325Crossref, Medline, Google Scholar
34.. Wonnacott TH, Wonnacott R: Introductory Statistics. New York, John Wiley & Sons, 1990Google Scholar
35.. Partonen T, Lönnqvist J: Seasonal variation in bipolar disorder. Br J Psychiatry 1996; 169:641–646Crossref, Medline, Google Scholar
36.. Young MA, Meaden PM, Fogg LF, Cherin EA, Eastman CI: Which environmental variables are related to the onset of seasonal affective disorder? J Abnorm Psychol 1997; 106:554–562Google Scholar
37.. Potkin SG, Zetin M, Stamenkovic V, Kripke D, Bunney WE Jr: Seasonal affective disorder: prevalence varies with latitude and climate. Clin Neuropharmacol 1986; 9(suppl 4):181–183Google Scholar
38.. Magnusson A, Stefansson JG: Prevalence of seasonal affective disorder in Iceland. Arch Gen Psychiatry 1993; 50:941–946Crossref, Medline, Google Scholar
39.. Rosen LN, Targum SD, Terman M, Bryant MJ, Hoffman H, Kasper SF, Hamovit JR, Docherty JP, Welch B, Rosenthal NE: Prevalence of seasonal affective disorder at four latitudes. Psychiatry Res 1990; 31:131–144Crossref, Medline, Google Scholar
40.. Kripke DF, Risch SC, Janowsky D: Bright white light alleviates depression. Psychiatry Res 1983; 10:105–112Crossref, Medline, Google Scholar