Changes in Brain Function (Quantitative EEG Cordance) During Placebo Lead-In and Treatment Outcomes in Clinical Trials for Major Depression
Abstract
Objective: Decreases in prefrontal electroencephalogram (EEG) cordance that are detectable as early as 48 hours after the start of medication have been related to clinical outcome in treatment trials for major depressive disorder. The relationship between brain changes during the placebo lead-in phase and medication treatment outcome is unknown. The authors hypothesized that decreases in prefrontal cordance during the placebo lead-in phase would be associated with better clinical outcome in subjects treated with antidepressants. Method: Data were pooled examining 51 adults with major depressive disorder from two independent double-blind placebo-controlled trials. A 1-week single-blind placebo lead-in phase preceded 8 weeks of randomized treatment with medication (fluoxetine 20 mg or venlafaxine 150 mg) or placebo. The authors obtained quantitative EEG cordance measures at baseline and at the end of the placebo lead-in period. Relationships between regional cordance changes at the end of the placebo lead-in period and clinical outcome (the final 17-item Hamilton Rating Scale for Depression scores) were examined using multiple linear regression analysis. Results: As hypothesized, decreases in prefrontal cordance during the placebo lead-in period were associated with lower final Hamilton depression scale scores in subjects randomly assigned to medication. Prefrontal changes explained 19% of the variance in final Hamilton depression scale scores. Conclusions: Neurophysiological changes during a placebo lead-in period may serve as nonpharmacodynamic biomarkers of eventual treatment outcomes in clinical trials for major depressive disorder.
The placebo lead-in phase is common to many efficacy studies of antidepressant medications (1 , 2) . Typically, subjects receive from 3 to 14 days of single-blind treatment with placebo prior to random assignment to placebo or medication. This initial drug-free interval allows for the effects of the test drug to be evaluated without confounds of preexisting medication (3 , 4) . The placebo lead-in phase also has been used to assess symptom stability among subjects who meet initial screening criteria (5) . Subjects who meet response criteria or exhibit a 20%–25% reduction in symptoms during the lead-in phase are customarily excluded from participation in the postrandomization phase of the trial (1 , 5 , 6) .
Among subjects who are retained for participation and randomly assigned to a treatment condition, changes in symptoms during the placebo lead-in phase have been associated with endpoint outcomes. A retrospective analysis of 593 subjects demonstrated that subjects who showed some improvement in depressive symptoms as measured by the Clinical Global Impression improvement ratings (7) during the placebo lead-in period had a better prognosis, regardless of whether they were assigned to drug or placebo (2) . Changes in specific somatic complaints during the placebo lead-in period also have been associated with ultimate outcomes. A reanalysis of data from 537 depressed geriatric patients in a placebo-controlled trial of fluoxetine found that headache and somnolence during the lead-in phase were positively associated with response to medication and placebo, respectively (8) .
Although clinical changes during the lead-in phase have been examined, there have been no reports of brain imaging during the placebo lead-in phase and antidepressant outcomes in clinical trials for major depressive disorder. The vast majority of imaging studies in clinical trials for major depressive disorder have examined brain function at baseline (i.e., before the placebo lead-in phase) and at endpoint. Positron emission tomography (PET), functional magnetic resonance imaging (fMRI), and quantitative electroencephalogram (EEG) techniques have revealed endpoint differences in changes in brain function between responders and nonresponders to pharmacotherapy (9 – 13) , psychotherapy (10 , 14) , and placebo (12 , 15) . There is some evidence that changes in brain function precede clinical response in subjects treated with antidepressants. Several studies using quantitative EEG cordance have examined brain function at intermediate points during the treatment trial and have reported that prefrontal changes in theta band activity as early as 48 hours to 2 weeks after the start of medication are associated with final response (16 , 18) . One prior study in healthy subjects suggests that brain functional changes occurring prior to drug onset may be related to later drug effects. In a previous study, we reported an association between changes in prefrontal quantitative EEG cordance that started during the placebo lead-in phase and subsequent side effect burden during treatment with antidepressant medication (19) .
The relationship between neurophysiological changes during the placebo lead-in period and endpoint clinical outcome in depressed subjects treated with antidepressant medication is unknown. Early postrandomization decreases in prefrontal EEG theta activity have been associated with antidepressant response (16 , 17) , and decreases in prefrontal theta cordance during the placebo lead-in phase have been associated with later medication side effects (19) . These findings suggest that decreases in prefrontal cordance during the placebo lead-in period might predict clinical outcome in major depressive disorder subjects subsequently treated with antidepressant medication. Quantitative EEG theta cordance incorporates absolute and relative EEG power and has demonstrated sensitivity to both changes in depressive symptoms (15 , 16 , 18 , 20 , 21) and to pharmacodynamic effects of antidepressant medication (Leuchter et al., unpublished data). Functionally, quantitative electroencephalographic cordance across all frequency bands has a moderately strong association (r=0.58) with regional cerebral perfusion (22) . In the prefrontal electrodes specifically, theta surface EEG activity has been associated with activity in underlying anterior cingulate cortex as measured by magnetoencephalography and PET (23 – 25) . Previous research has linked pretreatment activity in the anterior cingulate cortex with clinical response to antidepressant medication (26 – 28) . Cordance changes in prefrontal electrodes during the placebo lead-in phase might reflect early modulation of anterior cingulate cortex activity that is related to later outcome.
In this study, we examined the relationship between regional changes in brain function (quantitative EEG theta cordance) during a 1-week placebo lead-in period and final clinical outcome among depressed subjects who were randomly assigned to antidepressant medication. Based upon observations of prior work, we hypothesized that changes in prefrontal cordance during the placebo lead-in phase would be associated with final clinical outcome.
Method
Participants
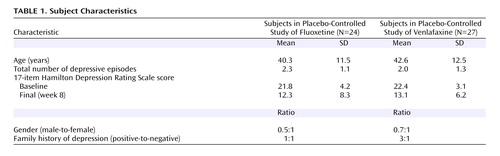
Fifty-one depressed adults participated in one of two independent randomized controlled trials conducted over a period of 24 months at the UCLA Laboratory of Behavior and Pharmacology, an outpatient research facility. Recruitment procedures, inclusion/exclusion criteria, and design features were identical for the two trials except for the medication and dosing. The trials utilized fluoxetine 20 mg (N=24) and venlafaxine 150 mg (N=27), respectively, as the active medication. Participants were recruited from UCLA Neuropsychiatric Hospital outpatient clinics and from community advertisement. All participants were diagnosed with major depressive disorder according to the Structured Clinical Interview for DSM–IV (29) and had a 17-item Hamilton depression scale score ³16 at study entry. Exclusion criteria were psychotic symptoms, cluster A or B axis II disorders, prior suicidal ideation, or any serious medical conditions known to affect brain function. Subjects were free of psychotropic medications for 2 weeks prior to enrollment, and psychotropic medications other than the study drug were not permitted for the duration of the trial. Subjects enrolled in the two trials did not differ significantly with respect to demographic characteristics, illness history, baseline illness severity, or final response ( Table 1 ) and therefore were pooled for analysis. In total, 25 participants were randomly assigned to medication and 26 to placebo. The UCLA Institutional Review Board reviewed and approved the protocols, and subjects provided written informed consent to participate.
Experimental Procedures
First, all subjects received a single-blind placebo treatment for 1 week. Subjects who met response criteria (Hamilton depression scale scores of ≤10) at the end of the placebo lead-in phase were removed from the study. Immediately following the lead-in phase, eligible subjects were randomly assigned to 8 weeks of double-blind treatment with medication or placebo. Subjects assigned to medication versus placebo did not differ significantly with respect to demographic characteristics or baseline regional measures of cordance. Dosing in the fluoxetine study was 20 mg/day for the entire 8 weeks. In the venlafaxine protocol, the daily dose escalated from 37.5 mg to 150 mg over 10 days. To preserve blinding, medication and placebo were dispensed in identical capsules, and the number of pills was escalated equally in both groups.
Subjects returned for follow-up visits 48 hours after randomization and weekly throughout the treatment phase. During each visit, a research nurse provided subjects with 15–25 minutes of unstructured counseling and problem-solving assistance. These sessions were mandated by the UCLA Institutional Review Board to address safety concerns about dispensing placebo to patients with significant depression. Clinical symptoms were evaluated using the Hamilton depression scale at each visit. At week 8, the blind was broken and subjects were debriefed.
Quantitative EEG Techniques
Recording procedures
EEG measures were obtained at seven time points: enrollment (baseline), end of the 1-week placebo lead-in, 48 hours after randomization, and at 1, 2, 4, and 8 weeks after treatment assignment. Recordings were performed using the QND system (Neurodata, Inc., Pasadena, Calif.), while subjects rested in the eyes-closed, maximally alert state in a sound-attenuated room with subdued lighting using procedures previously described (15 , 16 , 22 , 30–32) . Electrodes were positioned with an electrode cap (ElectroCap, Eaton, Ohio) using an extended international 10–20 system with 35 total recording electrodes ( Figure 1 ) (30) . Right infraorbital and left outer canthus electrodes were used to monitor eye movements. We collected data using a Pz reference montage and digitized the data at 256 samples/channel per second, with a high-frequency filter of 70 Hz and a low-frequency filter of 0.3 Hz. Data were reformatted by amplitude subtraction to construct a linked-ears reference and bipolar channel montages and were reviewed by a technologist for artifacts, including eye and muscle movements. A second technologist blinded to subject identity and treatment condition selected the first 20–32 seconds of artifact-free data for processing. This amount of data may be used to obtain reliable frequency spectra (32 , 33) . Absolute power (the intensity of energy in a frequency band in microvolts squared) was calculated in each of four frequency bands (0.5–4 Hz, 4–8 Hz, 8–12 Hz, and 12–20 Hz) using spectral analysis based on a fast Fourier transform.
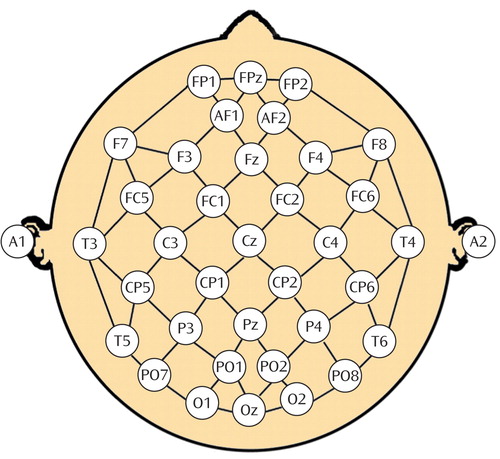
a This figure was created by Ian A. Cook (30).
Cordance calculations
Conventional quantitative EEG absolute (A) and relative (R) power measures were used to calculate cordance values for each electrode in each of the four frequency bands as described elsewhere (22) . First, EEG power values were computed using a reattributional electrode montage, yielding a stronger association between EEG and PET measures than traditional reference strategies (30) . Next, the absolute and relative power values for each electrode site ( s ) in each frequency band ( f ) were z-transformed to measure deviation from the mean values for that recording, yielding A norm(s,f) and R norm(s,f) , respectively. Last, the z scores were summed to yield a cordance value (Z) for each electrode in each frequency band where Z (s,f) =A norm(s,f) + R norm(s,f) . Analyses were performed on cordance measures from the theta frequency band (4–8 Hz) because previous work from this and other analyses has indicated that energy in the theta band is associated most strongly with changes in depressive symptoms (16 , 18 , 34) . We further limited the number of statistical comparisons by grouping electrodes into eight major regions ( Figure 1 ): prefrontal (Fp1, Fpz, Fp2), frontocentral (AF1, AF2), central (FC1, Cz, FC2), left temporal (T3, T5), right temporal (T4, T6), left parietal (P3, CP1, CP5), right parietal (P4, CP2, CP6), and occipital (O1, Oz, O2). Individual cordance values were averaged for electrodes in these groups to create regional measures. Regional changes during the placebo lead-in period were obtained by subtracting baseline cordance from the cordance value at the end of the 1-week placebo lead-in phase for each region.
Data Analysis
We used linear regression to assess the contributions of regional brain changes during the placebo lead-in period to final Hamilton depression scale scores in subjects who were assigned to active medication. Because we hypothesized that changes in the prefrontal region would be associated with the final outcome, the prefrontal variable was entered into the regression analysis first. In the next step, we entered the remaining seven regions using forward selection to assess whether other brain regions might predict outcome and, if so, to evaluate their relative contributions.
In addition, we conducted an analysis in the placebo group to explore relationships between regional brain changes during the placebo lead-in phase and final Hamilton depression scale scores. Because this analysis was not hypothesis-driven, all brain regions were entered in one block using forward selection.
Finally, we conducted a regression analysis on all subjects combined to test for potential interactions between treatment group assignment (medication or placebo) and brain region. In this analysis, we added the eight interaction terms into the model to examine whether any relationships between brain region and final Hamilton depression scale scores were moderated by group assignment.
Results
Medication Group Analysis
Changes in prefrontal cordance during the placebo lead-in phase were significantly associated with final Hamilton depression scale scores for subjects randomized to medication (F=5.28, df=1, 23, p=0.03). Decreases in prefrontal cordance were associated with lower final Hamilton depression scale scores. No other regions entered the second step of the model. The R 2 value was 0.187, indicating that approximately 19% of the variance in final Hamilton depression scale scores was explained by changes in prefrontal cordance at the end of the placebo lead-in period. The effect size was 0.23. According to Cohen (35) , this effect size falls between medium (0.15) and large (0.35).
In order to illustrate brain changes associated with final outcome during the placebo lead-in phase, we mapped cordance changes during the lead-in phase for subjects grouped as medication responders (final Hamilton depression scale scores ≤10) or medication nonresponders. Medication responders versus nonresponders differed significantly with respect to changes in the prefrontal region during the lead-in period (t=2.81, df=23, p=0.01) ( Figure 2 ).
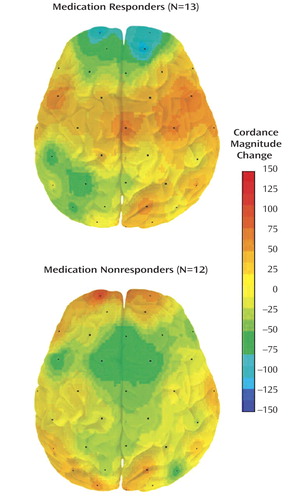
a Decreases are in blue; increases are red.
Placebo Group Analysis
In the placebo group, only the right temporal region entered the model (F=5.88, df=1, 24, p=0.02). Increases in right temporal cordance corresponded to lower final Hamilton depression scale scores. The R 2 value was 0.197, indicating that approximately 20% of the variance in the final Hamilton depression scale scores for the placebo group was explained by changes in the right temporal cordance at the end of the placebo lead-in phase.
Testing for Interaction Effects
Because the regression analyses of the medication and placebo groups yielded different brain regional changes associated with outcome, we evaluated potential interactions between regional brain changes and the two groups using a follow-up regression analysis that included interaction terms for each of the eight brain regions. The regression analysis of interaction terms did not reveal any significant interactions. Group changes did not interact significantly with changes in the prefrontal region (t=0.45, df=43, p=0.66) or the right temporal region (t=–0.50, df=43, p=0.62).
Discussion
This is the first study to examine the relationship between changes in brain function during the placebo lead-in phase and endpoint medication outcome. As hypothesized, decreases in prefrontal cordance during the placebo lead-in phase were associated with lower endpoint Hamilton depression scale scores in depressed subjects randomly assigned to antidepressant medication. Nineteen percent of the variance in clinical outcome in medication-treated subjects was predicted by neurophysiological changes occurring during the placebo lead-in phase, prior to the beginning of medication.
Why might neurophysiological changes during the placebo lead-in period be related to outcome? The placebo lead-in phase introduces a myriad of treatment-related factors, including exposure to the treatment milieu, interactions with study personnel, structured assessment, and pill administration. The initial experience of these factors may shape patient expectations and interpersonal relationships with treatment providers. Prior work has demonstrated that perceptions of the pharmacotherapeutic alliance (36) and pretreatment expectations of outcome (37) are important to pharmacotherapy outcomes in major depressive disorder. Expectations during the lead-in phase may be related specifically to receiving a pill. Cultural differences (38) and past experiences with medications could explain different beliefs and expectations aroused during the initial treatment with placebo. Individual differences in any of these factors could explain both differences in brain functional changes during the lead-in phase and differences in clinical outcome. In addition, antidepressant treatment history could influence patient expectations and neurophysiological changes during the placebo lead-in phase via classical conditioning. Prior experience with an active drug can produce conditioned responses during subsequent administration of placebo (39) . Moreover, brain changes during the lead-in phase could be influenced by genetic differences or stage or course of illness.
Regional quantitative EEG neurophysiological measures taken prior to medication may prove useful in predicting eventual clinical outcomes. Previous work has linked pretreatment baseline hyperactivation of the rostral anterior cingulate cortex (Brodmann’s areas 24 and 32) as measured by PET (26) and EEG theta (27 , 28) to antidepressant response. Our measure of the changes in prefrontal theta cordance might have reflected changes in underlying anterior cingulate cortex. Prior work has shown a positive association between theta activity recorded from prefrontal surface electrodes and activity in the anterior cingulate cortex as measured by magnetoencephalography (23 , 24) and PET (25) . Although our measures do not discriminate anterior cingulate cortex or its subdivisions, other studies have put forth functional neuroanatomical models specifically relating rostral anterior cingulate activity to treatment response (27, 40, 41).
The present finding has implications for interpreting other studies that examine changes in brain function associated with antidepressant outcomes in clinical trial settings. Most previous studies have examined brain changes occurring after the start of medication as compared to a pretreatment baseline, without concern for the placebo lead-in phase. Brain changes during the placebo lead-in phase may confound apparent medication effects associated with clinical outcomes in medication-treated subjects. In our study, the relationship between changes in prefrontal function during the placebo lead-in period and medication outcome suggests that some neurophysiological changes that are associated with endpoint antidepressant outcome reflect nonpharmacodynamic factors. Decreases in prefrontal cordance at the end of the placebo lead-in phase clearly were not an effect of medication; rather, this prerandomization neurophysiological change appeared to predict later response in the medication group. One strategy to separate neurophysiological changes that are purely nonpharmacodynamic from those that have a pharmacodynamic component would be to examine changes in brain function occurring at two intervals: 1) from pretreatment baseline to the end of the placebo lead-in phase and 2) from the end of the placebo lead-in phase to postrandomization time points. Although brain changes during the placebo lead-in phase are necessarily nonpharmacodynamic, the examination of brain changes from the end of lead-in period to postrandomization time points might reveal distinct neurophysiological changes that occur with drug onset.
Our exploratory analysis of subjects randomly assigned to placebo revealed that increases in right temporal cordance during the lead-in phase predicted 20% of the variance in final Hamilton depression scale scores. Changes in this brain region are interesting in light of prior work that has related temporal lobe abnormalities to major depressive disorder (42 – 44) . Although the placebo and medication group analyses yielded different brain regional predictors of outcome, because of the absence of a statistical group interaction we cannot conclude that changes in the right temporal region versus the prefrontal region differentially predicted outcomes of placebo versus medication. The relationship between changes in right temporal activity and treatment outcome merits further study (42) .
Several limitations of this study should be noted. First, because of the small sample size and relatively large number of predictor variables, future studies are necessary in order to corroborate our findings. Second, the study pooled subjects from two clinical trials using different antidepressant medications (venlafaxine, a mixed-action reuptake inhibitor, and fluoxetine, a selective serotonin reuptake inhibitor); changes in brain function during the placebo lead-in phase might differentially predict response to different classes of medication. Third, we were unable to determine the extent to which brain functional changes during the placebo lead-in period were influenced by placebo administration or other factors during the lead-in phase. Fourth, treatment outcome may have been influenced by other factors in addition to medication or placebo, such as the brief sessions with the research nurse. Fifth, because quantitative EEG cannot localize brain function with the same accuracy of other imaging techniques, other methods are needed to distinguish brain functional changes in the cortical and deep brain areas.
Conclusion and Future Directions
This study found that regional changes in brain function during the placebo lead-in phase were associated with clinical outcome in major depressive disorder subjects randomly assigned to antidepressant medication. Ultimate clinical outcome appeared to be predicted in part by neurophysiological changes that occurred during the first week of the clinical trial, in the absence of drug treatment, during the placebo lead-in phase. Future studies should examine how brain changes during the lead-in period may be associated with patient expectations, the therapeutic relationship, and treatment history.
1. Trivedi MH, Rush H: Does a placebo run-in or a placebo treatment cell affect the efficacy of antidepressant medications? Neuropsychopharmacology 1994; 11:33–43Google Scholar
2. Quitkin FM, McGrath PJ, Stewart JW, Ocepek-Welikson K, Taylor BP, Nunes E, Delivannides D, Agosti V, Donovan SJ, Ross D, Petkova E, Klein DF: Placebo run-in period in studies of depressive disorders: clinical, heuristic and research implications. Br J Psychiatry 1998; 173:242–248Google Scholar
3. Kramer M: Placebo run-in for antidepressant trials. Neuropsychopharmacology 1996; 15:105–107Google Scholar
4. Prien RF, Levine J: Research and methodological issues for evaluating the therapeutic effectiveness of antidepressant drugs. Psychopharmacol Bull 1984; 20:250–257Google Scholar
5. Landin R, DeBrota DJ, DeVries TA, Potter WZ, Demitrak MA: The impact of restrictive entry criterion during the placebo lead-in period. Biometrics 2000; 56:271–278Google Scholar
6. Rabkin JG, Stewart JW, McGrath PJ, Markowitz JS, Harrison W, Quitkin FM: Baseline characteristics of 10-day placebo washout responders in antidepressant trials. Psychiatry Res 1987; 21:9–22Google Scholar
7. Guy W: Early clinical drug evaluation unit (ECDEU), in Assessment Manual of Psychopharmacology. Rockville, Md, Department of Health, Education and Welfare, 1976Google Scholar
8. Ackerman DL, Greenland S, Bystritsky A, Small GW: Side effects and time course of response in a placebo-controlled trial of fluoxetine for the treatment of geriatric depression. J Clin Psychopharmacology (Berl) 2000; 20:658–665Google Scholar
9. Brody AL, Saxena S, Silverman DHS, Alborzian S, Fairbanks LA, Phelps ME, Huang S, Wu H, Maidment K, Baxter LR: Brain metabolic changes in major depressive disorder from pre- to post-treatment with paroxetine. Psychiatry Res: Neuroimaging 1999; 91:127–139Google Scholar
10. Brody AL, Saxena S, Stoessel P, Gillies LA, Fairbanks LA, Alborzian S, Phelps ME, Huang S, Wu H, Ho ML, Ho MK, Au SC, Maidment K, Baxter LR: Regional brain metabolic changes in patients with major depression treated with either paroxetine or interpersonal therapy. Arch Gen Psychiatry 2001; 58:631–640Google Scholar
11. Mayberg HS, Brannan SK, Tekell JL, Silva JA, Mahurin RK, McGinnis S, Jerabek PA: Regional metabolic effects of fluoxetine in major depression: serial changes and relationship to clinical response. Biol Psychiatry 2000; 48:830–843Google Scholar
12. Mayberg HS, Silva JA, Brannan SK, Tekell JL, Mahurin RK, McGinnis S, Jerabek PA: The functional neuroanatomy of the placebo effect. Am J Psychiatry 2002; 159:728–737Google Scholar
13. Seminowicz DA, Mayberg HS, McIntosh AR, Goldapple K, Kennedy S, Segal Z, Rafi-Tari S: Limbic-frontal circuitry in major depression: a path modeling metanalysis. Neuroimage 2004; 22:409–418Google Scholar
14. Goldapple K, Segal Z, Garson C, Lau M, Bieling P, Kennedy S, Mayberg H: Modulation of cortical-limbic pathways in major depression: treatment-specific effects of cognitive behavior therapy. Arch Gen Psychiatry 2004; 61:34–41Google Scholar
15. Leuchter AF, Cook IA, Witte EA, Morgan M, Abrams M: Changes in brain function of depressed subjects during treatment with placebo. Am J Psychiatry 2002; 159:122–129Google Scholar
16. Cook IA, Leuchter AF, Morgan M, Witte E, Stubbeman WF, Abrams M, Rosenberg S, Uijtdehaage SHJ: Early changes in prefrontal activity characterize clinical responders to antidepressants. Neuropsychopharmacology 2002; 27:120–131Google Scholar
17. Iosifescu D, Greenwald S, Devlin P, Alpert J, Hamil S, Fava M: Frontal EEG predicts clinical response to SSRI treatment in major depressive disorder. Poster presented at the 44th Annual Meeting of the New Clinical Drug Evaluation Unit (NCDEU); 2004Google Scholar
18. Cook IA, Leuchter AF: Prefrontal changes and treatment response prediction in depression. Semin Clin Neuropsychiatry 2001; 6:113–120Google Scholar
19. Hunter AM, Leuchter AF, Morgan ML, Cook IA, Abrams M, Siegman B, DeBrota DJ, Potter WZ: Neurophysiologic correlates of side effects in normal subjects randomized to venlafaxine or placebo. Neuropsychopharmacology 2005; 30:792–799Google Scholar
20. Cook IA, Leuchter AF, Uijtdehaage SH, Osato S, Holschneider DH, Abrams M, Rosenberg-Thompson S: Altered cerebral energy utilization in late life depression. J Affect Disord 1998; 49:89–99Google Scholar
21. Leuchter AF, Cook IA, Uijtdehaage SH, Dunkin J, Lufkin RB, Anderson-Hanley C, Abrams M, Rosenberg-Thompson S, O’Hara R, Simon SL, Osato S, Babaie A: Brain structure and function and the outcomes of treatment for depression. J Clin Psychiatry 58(suppl 16):22–31, 1997Google Scholar
22. Leuchter AF, Uijtdehaage SHJ, Cook IA, O’Hara R, Mandelkern M: Relationship between brain electrical activity and cortical perfusion in normal subjects. Psychiatry Res 1999; 90:125–140Google Scholar
23. Asada H, Fukudea Y, Tsunoda S, Yamaguchi M, Tonoike M: Frontal midline theta rhythms reflect alternative activation of prefrontal cortex and anterior cingulate cortex in humans. Neurosci Lett 1999; 274:29–32Google Scholar
24. Ishii R, Shinosaki K, Ukai S, Inouye T, Ishihara T, Yoshimine T, Hirabuki N, Asada H, Kihara T, Robinson SE, Takeda M: Medial prefrontal cortex generates frontal midline theta rhythm. Neuroreport 1999, 10:675–679Google Scholar
25. Leuchter AF, Cook IA, Greenwald SD, Kofol T: Prefrontal EEG cordance correlates with anterior cingulate perfusion. Poster presented at the Annual Meeting of the American Psychiatric Association; 2004Google Scholar
26. Mayberg HS, Brannan SK, Mahurin RK, Jerabek PA, Brickman JS, Tekell JL, Silva JA, McGinnis S, Glass TG, Martin CC, Fox PT: Cingulate function in depression: a potential predictor of treatment response. Neuroreport 1997; 8:1057–1061Google Scholar
27. Pizzagalli D, Pascual-Marqui RD, Nitschke JB, Oakes TR, Larson CL, Abercrombie HC, Schaefer SM, Koger JV, Benca RM, Davidson RJ: Anterior cingulate activity as a predictor of degree of treatment response in major depression: evidence from brain electrical tomography analysis. Am J Psychiatry 2001; 158:405–415Google Scholar
28. Pizzagalli DA, Oakes TR, Davidson RJ: Coupling of theta activity and glucose metabolism in the human rostral anterior cingulate cortex: an EEG/PET study of normal and depressed subjects. Psychophysiology 2003; 40:939–949Google Scholar
29. First M, Spitzer R, Gibbon M, Williams J: Structured Clinical Interview for DSM-IV Axis I Disorders (patient ed.). New York, Biometrics Research Department, NY State Psychiatric Institute; 1994Google Scholar
30. Cook IA, O’Hara R, Uijtdehaage SH, Mandelkern M, Leuchter AF: Assessing the accuracy of topographic EEG mapping for determining local brain function. Electroencephalography Clin Neurophysiol 1998; 107:408–414Google Scholar
31. Cook IA, Leuchter AF, Witte E, Abrams M, Uijtdehaage SH, Stubbeman W, Rosenberg-Thompson S, Anderson-Hanley C, Dunkin JJ: Neurophysiologic predictors of treatment response to fluoxetine in major depression. Psychiatry Res 1999; 85:263–273Google Scholar
32. Leuchter AF, Newton TF, Cook IA, Walter DO, Rosenberg-Thompson S, Lachenbruch PA: Changes in brain functional connectivity in Alzheimer-type and multi-infarct dementia. Brain 1992; 115:1543–1561Google Scholar
33. Brenner RP, Ulrich RF, Reynolds CF: EEG spectral findings in healthy, elderly men and women—sex differences. Electroencephalogr Clin Neurophysiol 1995; 94:1–5Google Scholar
34. Ulrich G, Haug HJ, Stieglitz RD, Fahndrich E: EEG characteristics of clinically defined on-drug-responders and non-responders—a comparison clomipramine vs. maprotiline. Pharmacopsychiatry 1988; 21:367–368Google Scholar
35. Cohen J: Statistical Power for the Behavioral Sciences (2nd ed). Hillsdale, NJ, Lawrence Erlbaum Associates, 1988Google Scholar
36. Weiss M, Gaston L, Propst A, Wisebord S, Zicherman V: The role of the alliance in the pharmacologic treatment of depression. J Clin Psychiatry 1997; 58:196–204Google Scholar
37. Krell HV, Leuchter AF, Morgan M, Cook IA, Abrams M: Subject expectations of treatment effectiveness and outcome of treatment with an experimental antidepressant. J Clin Psychiatry 2004; 65:1174–1179Google Scholar
38. Moerman DE, Jonas WB: Deconstructing the placebo effect and finding the meaning response. Ann Intern Med 2002; 136:471–476Google Scholar
39. Ader R: The role of conditioning in pharmacotherapy, in The Placebo Effect, Harrington A (ed.). Cambridge, Mass, Harvard University Press, 1997Google Scholar
40. Mayberg HS: Limbic-cortical dysregulation: a proposed model of depression. J Neuropsychiatry Clin Neurosci 1997; 9:471–481Google Scholar
41. Mayberg HS, Liotti M, Brannan SK, McGinnis S, Mahurin RK, Jerabek PA, Silva JA, Tekell JL, Martin CC, Lancaster JL, Fox PT: Reciprocal limbic-cortical function and negative mood: converging PET findings in depression and normal sadness. Am J Psychiatry 1999; 156:675–682Google Scholar
42. Post RM, DeLisi LE, Holcomb HH, Uhde TW, Cohen R, Buchsbaun MS: Glucose utilization in the temporal cortex of affectively ill patients: positron emission tomography. Biol Psychiatry 1987; 22:545–553Google Scholar
43. Soares JC, Mann JJ: The functional neuroanatomy of mood disorders. J Psychiatr Res 1997; 3:393–432Google Scholar
44. Drevets WC: Functional neuroimaging studies of depression: The anatomy of melancholia. Annu Rev Med 1998; 49:341–361Google Scholar