Ferritin Levels and Their Association With Regional Brain Volumes in Tourette’s Syndrome
Abstract
Objective: A previous small study showed lower serum ferritin levels in subjects with Tourette’s syndrome than in healthy subjects. The authors measured peripheral iron indices in a large group of Tourette’s syndrome and comparison subjects and explored associations of ferritin levels with regional brain volumes. Method: Ferritin was measured in 107 children and adults (63 Tourette’s syndrome, 44 comparison); serum iron was measured in 73 (41 Tourette’s syndrome, 32 comparison). Magnetic resonance imaging scans were used to measure volumes of the basal ganglia and cortical gray matter. Results: Ferritin and serum iron were significantly lower in the Tourette’s syndrome subjects, although still within the normal range. No association was found between tic severity and either iron index. In the Tourette’s syndrome subjects, ferritin did not correlate significantly with caudate volume but did correlate positively with putamen volume. In the comparison subjects, ferritin correlated inversely with caudate volume but did not correlate significantly with putamen volume. Irrespective of diagnosis, ferritin correlated positively with volumes of the sensorimotor, midtemporal, and subgenual cortices. Conclusions: The lower peripheral ferritin and iron levels in persons with Tourette’s syndrome are consistent with findings in other movement disorders and suggest that lower iron availability may have a causal role in the pathophysiology of tic disorders. Lower iron stores may contribute to hypoplasia of the caudate and putamen, increasing vulnerability to developing tics or to having more severe tics. Lower iron stores may also contribute to smaller cortical volumes and consequently to reduced inhibitory control of tics.
Tourette’s syndrome is a childhood-onset movement disorder that likely involves anatomical and functional disturbances of the basal ganglia (1) as well as dysfunction of the dopaminergic systems (2 , 3) . A number of movement disorders and other neurological diseases are associated with alterations in brain iron, particularly in the striatum (4) . The distribution of nonheme iron in the brain parallels that of dopamine (5) . Thus, nonheme iron is highly concentrated in structures of the extrapyramidal system, with the greatest concentrations located in the globus pallidus, followed by the red nucleus, substantia nigra, putamen, and dentate and caudate nuclei. Substantial concentrations of nonheme iron are also present in the cerebral cortex, particularly the motor cortex (6) .
Iron has many biological functions in the brain. It affects the sensitivity of dopamine D 2 receptors and is also required for myelination (7) . As a component of many enzymes, it is involved in oxidation, hydroxylation, and peroxidation reactions and can affect the concentration of neurotransmitters (8) . Considerable evidence from both animal and human studies indicates that iron is important for normal neurological functioning and development (9) . For example, iron deficiency in newborn rats results in depletion of brain iron that persists after iron supplementation and is associated with permanent behavioral deficits (10) . Similarly, children who have severe, chronic iron deficiency in infancy exhibit persistent motor, cognitive, behavioral, and emotional impairment more than 10 years after iron therapy, despite normalization of peripheral iron status (11) . The role of abnormal iron metabolism in specific neurological diseases is still unclear, and differing pathophysiological mechanisms for the effects of disturbed iron metabolism likely exist for particular disorders. For example, iron-mediated oxidative injury may be important in the pathogenesis of Parkinson’s and Alzheimer’s diseases, whereas the effects of iron on the dopaminergic systems have been emphasized in restless legs syndrome, neuroleptic-induced parkinsonism, and akathisia (4 , 8 , 12) . Both mechanisms are considered important in tardive dyskinesia (13) .
Because the blood-brain barrier blocks cells in the brain from exposure to nonheme iron in the plasma, how well peripheral iron indices correlate with central iron content is unclear. Moreover, the association of central with peripheral iron levels appears to be influenced by multiple factors, including age, iron deficiency, and antipsychotic use (14 , 15) . Whereas some investigators have reported that the quantity of nonheme iron in the human brain is largely independent of body iron stores (6) , iron deficiency in rats has been shown to decrease nonheme iron in the brain by more than 40% (16) , and a positive correlation (r=0.6) was found between serum and CSF ferritin in individuals with restless legs syndrome (17) . Accumulation of iron in the basal ganglia has also been reported in individuals with hemochromatosis (18 , 19) , which is characterized by systemic iron overload, and a modestly higher level of brain iron was found in a mouse model for this disease (20) .
Although the association of central with peripheral iron levels remains poorly understood, alterations in peripheral iron indices have been reported in a number of movement disorders. In some studies, peripheral ferritin and iron levels were lower in subjects with restless legs syndrome (21 , 22) , akathisia (12 , 13) , Parkinson’s disease (23) , and attention deficit hyperactivity disorder (ADHD) (24) than in healthy comparison subjects, and ferritin level correlated positively with the severity of tardive dyskinesia (25) . Other studies have shown no significant association of iron indices with these disorders (17 , 26–30) . In general, however, the most consistent findings of abnormal iron indices in persons with movement disorders have been reported for serum ferritin.
Ferritin is the most widely used marker of total body iron stores. It exhibits less variability than does serum iron (31 , 32) , and it declines before serum iron when iron stores are depleted (33) . In healthy subjects, ferritin correlates inversely with total-iron binding capacity (34) . In the only study of peripheral iron indices in Tourette’s syndrome of which we are aware, serum ferritin, but not serum iron or transferrin, was lower in 14 subjects with the disorder than in 14 comparison subjects (35) .
We report iron indices in a large group of Tourette’s syndrome and comparison subjects recruited to participate in a variety of studies of childhood neuropsychiatric disorders. The majority of these subjects underwent anatomical magnetic resonance imaging (MRI) scans with measurement of basal ganglia and regional cortical volumes. The primary aim of this study was to replicate in a large subject group our prior finding that blood ferritin is lower in Tourette’s syndrome subjects than in comparison subjects (35) . In addition, we explored whether serum iron and total-iron binding capacity would differ between the two diagnostic groups. If group differences were found for any of the three iron indices, we planned to explore whether they correlated with tic severity. Finally, we explored whether volumes of the basal ganglia and cortical gray matter correlated with ferritin levels.
Method
Subject Recruitment and Characterization
Subjects with Tourette’s syndrome were recruited from the Tic and Obsessive-Compulsive Disorders Specialty Clinic at the Yale Child Study Center and through the local chapter of the Tourette Syndrome Association. Healthy comparison subjects were recruited from a list of 10,000 names purchased from a telemarketing company. The names were identified by the company as representing individuals whose ages were within a specified range and whose residences were within particular ZIP codes (chosen to match the ages and ZIP codes for the subjects with Tourette’s syndrome). Individuals from the list were selected for contact by using a random number generator. Approximately 10% of the eligible comparison families who were contacted participated. They received the same diagnostic evaluation as the other subjects. Written informed consent was obtained from all adult participants and the parents of all child participants after the study was completely described to them. Assent was obtained from all child participants. Families were paid for participation. The institutional review boards at New York State Psychiatric Institute, Columbia University College of Physicians and Surgeons, and Yale University School of Medicine approved the study.
The subjects were ages 7–57 years and were predominantly right-handed. They included individuals with a primary diagnosis of Tourette’s syndrome, with or without a lifetime diagnosis of obsessive-compulsive disorder (OCD) or combined-type ADHD, and healthy comparison subjects. Neuropsychiatric diagnoses were established through clinical evaluation and administration of the Schedule for Tourette and Other Behavioral Syndromes (36) . This is a structured diagnostic interview used extensively in family studies of Tourette’s syndrome. Two child psychiatrists (including B.S.P.) used all available clinical and investigational materials in a best-estimate diagnostic procedure.
The exclusionary criteria for the subjects with Tourette’s syndrome included another movement disorder or a major psychiatric disorder other than OCD or ADHD that antedated the onset of tics. The exclusionary criteria for the comparison subjects included a current axis I disorder or any history of a tic disorder, OCD, ADHD, psychotic disturbance, or severe major depression. Exclusionary criteria for both groups included a history of neurological illness, any prior seizure, a history of head trauma with loss of consciousness, a history of pervasive developmental disorder, an IQ below 80, ongoing substance abuse, or prior substance dependence.
Ratings of current and worst-ever severity of tic, OCD, and ADHD symptoms were obtained by using, respectively, the Yale Global Tic Severity Scale (37) , the adult or child version of the Yale-Brown Obsessive Compulsive Scale (38) , and the DuPaul-Barkely ADHD Rating Scale (39) . Intraclass correlation coefficients (ICCs) for videotaped training interviews of clinicians administering the Yale Global Tic Severity Scale and the Yale-Brown Obsessive Compulsive Scale were greater than 0.90. Full-scale IQ in the children was estimated by using the Kaufman Brief Intelligence Test (40) , and in the adults IQ was measured by using scores on two performance subscales of the WAIS-R (block design and object assembly) and three verbal WAIS-R subscales (information, digit span, and vocabulary). Socioeconomic status was quantified by using the Hollingshead Four-Factor Index of Social Status.
Laboratory Procedures
Ferritin, iron, and total-iron binding capacity were measured at the Yale-New Haven Hospital Clinical Chemistry Laboratory. Blood samples were collected throughout the day (the iron indices have no consistent diurnal variation) (32) . Ferritin was measured in serum or plasma. Values obtained for serum and plasma ferritin were highly correlated (r=0.99), and serum ferritin was measured with coefficients of variation of 4.0% and 7.8% for low (67 ng/ml) and high (423 ng/ml) quality control samples, respectively. Serum iron was assayed with coefficients of variation of 1.2% and 1.7% observed for low (62 m g/dl) and high (221 m g/dl) quality control samples. Total-iron binding capacity was determined in serum by using kits for unsaturated-iron binding capacity with coefficients of variation of 7.0% and 5.2% for low (102 μg/dl) and high (143 μg/dl) quality control samples.
MRI Scanning
MRI scans were obtained by using a single 1.5-T GE Signa scanner (GE Medical Systems, Milwaukee) within 2 weeks of collection of the blood samples. Head positioning was standardized by using canthomeatal landmarks. A three-dimensional spoiled-gradient echo sequence was obtained (repetition time, 24 msec; echo time, 5 msec; flip angle, 45°; frequency encoding superior/inferior; no wrap; 256×192 matrix; field of view, 30 cm; two excitations; slice thickness, 1.2 mm; and 124 contiguous slices encoded for sagittal slice reconstructions to yield 1.17×1.17×1.2-mm voxels).
Morphometric analyses were performed by means of Analyze 7.5 software (Biomedical Imaging Resource, Mayo Foundation, Rochester, Minn.) with operators blinded to subject characteristics and hemisphere (images were randomly flipped left-to-right before analysis). Before region definition, large-scale variations in image intensity were removed and brain positioning was standardized by using the anterior and posterior commissures (AC-PC line) and standard midline landmarks. An isointensity contour function was used in conjunction with manual editing to isolate the cerebrum.
Whole brain volume was used as a covariate in the statistical analyses to control for generalized scaling effects within the brain. The brain was divided into hemispheres by using a curvilinear plane positioned through standard midline landmarks. Each hemisphere was divided into eight anatomical sectors by a method shown to be reliable and valid. These eight sectors were the dorsal prefrontal, premotor, sensorimotor, parieto-occipital, orbitofrontal, subgenual, midtemporal, and inferior occipital cortices (41) .
The gray scale values of “pure” representations of cortical gray and white matter were sampled bilaterally at four standard locations throughout the brain (frontal, temporal, occipital, and parietal regions) to differentiate cortical gray from white matter. These four values were averaged for each tissue type. A global threshold whose value was halfway between the average gray matter and average white matter values was invoked to provide an initial rough classification of cortical gray and white matter throughout the cerebrum. This classification was then hand-edited in all three views.
The procedures for defining the basal ganglia nuclei (caudate, putamen, and globus pallidus) are described elsewhere (42) .
Interrater reliability was assessed on 20 scans for measurement of the cerebral subdivisions and on 10 scans for measurement of whole brain volume, the cortical gray and white matter segmentation, and the basal ganglia nuclei. ICCs calculated by using a two-way random-effects model (43) were >0.98 for each of the cerebral subdivisions, >0.99 for whole brain volume, >0.98 for the cortical gray and white matter segmentation, >0.95 for the caudate and putamen nuclei, and >0.90 for the globus pallidus nucleus.
Statistical Analyses
Iron indices
Statistical analyses were performed by using SPSS version 11.5 (SPSS, Chicago). Analysis of covariance (ANCOVA) was used to test the a priori hypothesis that ferritin would be lower in the subjects with Tourette’s syndrome than in the comparison subjects. A log 10 transformation was performed on the ferritin levels to normalize the distribution (34) . ANCOVA was also used in exploratory analyses to assess whether serum iron and total-iron binding capacity differed between the two groups.
Age and sex were included in the models as covariates, as iron stores tend to be lower in young children, adolescents during growth spurts (44) , and menstruating females. The age-by-sex interaction was included in the ferritin analysis as a covariate, because the increase in ferritin with age has different patterns in males and females (45) . We included lifetime diagnoses of OCD and ADHD as covariates to account for the possible influence of comorbidity on iron status. Several other covariates related to current psychopharmacologic treatment were investigated. These included treatment with any psychotropic medication and treatment with each of the following medication classes: typical antipsychotics, α 2 agonists, selective serotonin reuptake inhibitors, and tricyclic antidepressants (no subject was taking an atypical antipsychotic or stimulant). In the analyses of ferritin and total-iron binding capacity, these covariates were statistically nonsignificant and were excluded from the final models. Some of these covariates were statistically significant in the serum iron analysis, and models with and without these covariates are reported.
We also explored the correlation of ferritin and iron levels with the severity of tic symptoms in the subjects with Tourette’s syndrome. In separate multiple regression models, ferritin level (log 10 transformed) and iron level were each regressed on current and worst-ever motor, phonic, and total tics as measured by the Yale Global Tic Severity Scale, with age, sex, and lifetime diagnoses of OCD and ADHD included as predictors. The age-by-sex interaction was included in the models for the ferritin analyses.
Within the Tourette’s syndrome and the healthy comparison groups, we assessed the correlation of ferritin level (log 10 transformed) with serum iron level. A chi-square statistic was used to test whether the correlations differed between the two groups.
The significance level for all analyses was set at p<0.05 (two-tailed).
Association of ferritin levels with regional brain volumes
These statistical analyses were performed by using SAS version 9.0 (SAS Institute, Cary, N.C.). We explored whether the correlations of ferritin level (log 10 transformed) with basal ganglia and cortical gray matter volumes differed between the Tourette’s syndrome and comparison subjects. If no such differences were found, we assessed whether, regardless of diagnosis, the correlations of ferritin levels with regional brain volumes varied by region. For all these analyses, we used linear mixed-effects models (PROC MIXED) with repeated measures over regional domains.
The models included the within-subjects factor of hemisphere with two levels (left and right). They also included the within-subjects factor of region: in the basal ganglia models, this factor had three levels (caudate, putamen, and globus pallidus); in the cortex models, it had eight levels (dorsal prefrontal, orbitofrontal, premotor, subgenual, sensorimotor, parieto-occipital, midtemporal, and inferior occipital cortices). Diagnosis (Tourette’s syndrome or comparison) was a between-subjects factor in all models. The covariates were age, sex, lifetime diagnoses of OCD and ADHD, and whole brain volume. The interaction of whole brain volume and region and other two- and three-way interactions were included. Nonsignificant interactive terms were eliminated by backward stepwise regression. The significance level for all analyses was set at p<0.05 (two-tailed).
Results
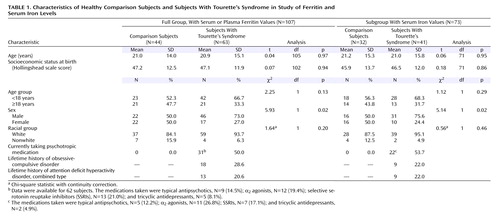
Blood ferritin levels were determined for 63 subjects with Tourette’s syndrome and 44 healthy comparison subjects. Because of sample volume limitations, serum iron levels were obtained for 41 subjects with Tourette’s syndrome and 32 comparison subjects, and serum total-iron binding capacity was determined for the same 41 Tourette’s syndrome subjects and for 31 of those 32 comparison subjects. Demographic measures were comparable in the two groups except that the Tourette’s syndrome group had a significantly higher proportion of male subjects in the full group and the subgroup with serum iron and total-iron binding capacity levels ( Table 1 ).
Group Differences in Iron Indices
Confirming our a priori hypothesis, blood ferritin levels were significantly lower in the Tourette’s syndrome subjects than in the healthy comparison subjects (t=2.28, df=106, p=0.03) although still within the normal clinical range. The mean for the Tourette’s group was 55.0 ng/ml (SD=54.3) (log 10 transformed: mean=1.61, SD=0.31), and the mean for the comparison group was 72.2 ng/ml (SD=72.8) (log 10 transformed: mean=1.68, SD=0.39). The normal range for males is 18–370 ng/ml, and for females it is 9–120 ng/ml.
Like ferritin, serum iron was within the normal range (males, 60–180 μg/dl; females, 50–170 μg/dl) in both groups but was significantly lower (t=2.38, df=72, p=0.02) in the Tourette’s syndrome subjects (mean=81.6, SD=24.8 m g/dl) than in the healthy comparison subjects (mean=90.6, SD=29.0 μg/dl). Although treatment with any psychotropic medication, when added as a covariate, was statistically significant (t=2.19, df=72, p=0.03), the effect of diagnosis (Tourette’s syndrome or comparison group) remained highly significant in this model (t=3.24, df=72, p=0.002). When treatment with each specific medication class was added separately to the model as a covariate, only treatment with an α 2 agonist was significantly associated with serum iron level (t=2.08, df=72, p=0.04). Serum total-iron binding capacity was within the normal range (250–450 μg/dl) in both groups and did not significantly differ (t=0.23, df=71, p=0.82) between the Tourette’s syndrome subjects (mean=333.9 μg/dl, SD=54.9) and the healthy comparison subjects (mean=338.4 μg/dl, SD=63.3).
Levels of ferritin (log 10 transformed) and serum iron were not significantly intercorrelated in the Tourette’s syndrome subjects (r=0.08, N=41, p=0.64) or in the healthy comparison subjects (r=0.34, N=32, p=0.06). Moreover, the correlations did not significantly differ between groups (χ 2 =1.27, df=1, p=0.26).
Age and Sex Effects
In the ANCOVA model for the ferritin analysis, the interaction between age and sex was highly significant (t=5.56, df=106, p<0.001), indicating that the effect of each covariate depended on the other. This was consistently reported in prior studies of iron indices, and our replication of it supports the validity of our data. In males, ferritin levels increase from adolescence to adulthood; in females, ferritin remains low during the menstrual years and only increases after menopause. A point of some disagreement is whether in males ferritin continues to increase throughout adulthood or plateaus in the early 30s. The weight of evidence suggests that ferritin levels plateau, and in our study group nonlinear curve fitting (not presented) was in agreement with this pattern (45) .
Furthermore, we found that the mean serum iron level was significantly lower in females than in males (t=3.13, df=72, p=0.003), but the effect of age was nonsignificant (t=0.39, df=72, p=0.70). In the analysis of total-iron binding capacity, the effects of both sex (t=0.34, df=71, p=0.73) and age (t=1.80, df=71, p=0.08) were nonsignificant. Our findings of a sex effect for serum iron and the absence of a sex effect for total-iron binding capacity are consistent with the results of previous studies of iron indices. Others have reported, however, that serum iron rises substantially during childhood and then declines steadily during adulthood, while total-iron binding capacity has a mainly uninterrupted gradual decline with increasing age (46) . The absence of a significant age effect for both iron and total-iron binding capacity in our group of children and adults is likely due to the smaller group size and the considerable variability of serum iron levels (31 , 32) .
Association of Iron Indices With Tic Severity
Neither ferritin (log 10 transformed) nor serum iron level correlated significantly with current or worst-ever motor, phonic, or total tics, as reflected by scores on the Yale Global Tic Severity Scale, in the subjects with Tourette’s syndrome (p>0.2 for all).
Association of Ferritin With Regional Brain Volumes
Volumetric measurements of basal ganglia nuclei were obtained for 61 of the 63 Tourette’s syndrome subjects and 43 of the 44 healthy comparison subjects. These 104 subjects are a subgroup of 284 subjects (154 Tourette’s syndrome, 130 comparison) from a previously published study of basal ganglia volumes in persons with Tourette’s syndrome (42) . We detected a significant interaction of region, diagnostic group (Tourette’s syndrome or comparison), and log 10 ferritin level (F=4.86, df=2, 197, p=0.009), indicating that the association of ferritin level with basal ganglia volume depended on the diagnostic group and the specific basal ganglia nucleus. We then considered separately the caudate, putamen, and globus pallidus, and we detected a significant interaction between diagnostic group and log 10 ferritin level for the caudate (t=2.66, df=198, p=0.009) and the putamen (t=2.41, df=198, p=0.02) but not for the globus pallidus (t=0.41, df=198, p=0.68) ( Figure 1 ). The complete model is available on request.

a Parameter estimates (β) and 95% confidence intervals (CIs) determined with linear mixed-effects models indicated that in the Tourette’s syndrome subjects ferritin correlated positively with putamen volume (β=332.31, 95% CI=35.43 to 629.19; t=2.19, df=199, p=0.03) but did not correlate significantly with the volume of the caudate (β=73.01, 95% CI=–214.19 to 360.20; t=0.50, df=199, p=0.62) or globus pallidus (β=–10.29, 95% CI=–135.45 to 114.87; t=0.16, df=199, p=0.87). In the comparison subjects, ferritin correlated inversely with caudate volume (β=–431.99, 95% CI=–694.18 to –169.80; t=3.23, df=199, p=0.002) but did not correlate significantly with the volume of the putamen (β=–141.63, 95% CI= –412.72 to 129.46; t=1.02, df=199, p=0.31) or globus pallidus (β= –43.82, 95% CI=–156.30 to 68.66; t=0.76, df=199, p=0.45). The caudate and putamen volumes of Tourette’s syndrome subjects who had lower ferritin levels were both smaller than the volumes of comparison subjects with lower ferritin levels.
b Regional brain volume was adjusted for whole brain volume.
Volumetric measurements of cortical gray matter were obtained for 61 of the 63 Tourette’s syndrome subjects and 42 of the 44 healthy subjects. These 103 subjects are a subsample of 286 subjects (155 Tourette’s syndrome, 131 comparison) from a previously published study of regional brain and ventricular volumes in persons with Tourette’s syndrome (39) . The associations between ferritin and regional cortical volumes did not vary significantly between diagnostic groups (interaction of region, diagnostic group, and log 10 ferritin: F=1.38, df=7, 185, p=0.22; interaction of diagnostic group and log 10 ferritin: F=1.88, df=1, 195, p=0.17). Regardless of diagnosis, however, the associations of ferritin with cortical volumes varied by region (interaction of region and log 10 ferritin: F=2.04, df=7, 196, p=0.05). Parameter estimates (β) and 95% confidence intervals (CIs) indicated that log 10 ferritin correlated positively and significantly with the volume of the sensorimotor cortex (β=2328.97, 95% CI=676.08 to 3981.86; t=2.76, df=197, p=0.006), midtemporal cortex (β=1442.38, 95% CI=314.95 to 2569.81; t=2.51, df=197, p=0.01), and subgenual cortex (β=1979.57, 95% CI=689.20 to 3269.94; t=3.01, df=197, p=0.003).
Discussion
The major findings of this study are that peripheral ferritin and iron levels were significantly lower in subjects with Tourette’s syndrome than in healthy comparison subjects, although on average they were still within the normal clinical range. We also detected significant differences between Tourette’s syndrome and the comparison subjects in the associations of ferritin level with the volumes of the caudate and putamen. Irrespective of diagnosis, ferritin correlated positively and significantly with the volumes of the sensorimotor, midtemporal, and subgenual cortices. No association was found between the severity of tic symptoms and ferritin or iron level.
Iron and Tourette’s Syndrome
The cause of the lower ferritin and iron levels in persons with Tourette’s syndrome is unclear. One explanation could be a genetically based alteration in iron metabolism that has not yet been identified in people with the disorder. For example, a basal ganglia disease, neuroferritinopathy, was mapped by linkage analysis to 19q13.3, a locus containing the gene for ferritin light polypeptide ( FTL ). Brain histochemistry revealed abnormal aggregates of ferritin and iron in these patients, but their serum ferritin levels were low (47) . Tourette’s syndrome and lower iron indices, in other words, could be linked by a common underlying genetic disturbance that both creates the diathesis for the disorder and alters iron metabolism. Our study, however, provides no evidence to support this possibility, and in fact the absence of a between-group difference in the association of ferritin with serum iron provides some evidence against it.
Alternatively, the lower ferritin and iron levels in the Tourette’s syndrome group could represent a reduction in iron stores that was caused by reduced dietary intake, impaired absorption, blood loss, or increased physiologic requirements in the subjects with the disorder (48) . Having Tourette’s syndrome, however, seems unlikely in itself to predispose a person to develop any of these conditions.
We must therefore consider the final possibility that the association of lower iron indices with Tourette’s syndrome derived instead from a causal influence of lower iron availability on the development or exacerbation of tics in our study group. This interpretation, which we favor, is credible given the role of brain iron in the dopaminergic systems (8) and the significant associations that we detected between iron indices and regional brain volumes. If we are correct, then persons with Tourette’s syndrome in the general population who happen to have lower iron stores will have more severe tics, even if their iron indices are within the range of normal interindividual variability. Consequently, these individuals would be more likely to be recruited into a research study than would comparison subjects with relatively low iron stores.
Iron and Dopaminergic Neurotransmission
The molecular pathways by which iron could alter the genetic expression or severity of tic symptoms are unknown. Nonetheless, the importance of iron in the dopaminergic systems (8) and the likely involvement of these systems in Tourette’s syndrome (2 , 3) suggest that iron may influence tic symptoms through its effects on dopaminergic neurotransmission. Iron is required for the hydroxylation of tyrosine to l -dopa, which is then decarboxylated to dopamine. Iron deficiency in rats, however, has been associated with high extracellular dopamine levels in the striatum, a finding that may be explained by a low density of dopamine transporters (7) . Rat studies have also shown that iron deficiency decreases D 2 receptor density in the striatum and either decreases or increases D 2 receptor density in the cortex. Conversely, injection of ferric chloride directly into the rat brain leads to D 2 receptor supersensitivity. Both iron deficiency and intracerebral injection of ferric chloride are associated with altered behavioral responses to dopamine agonists or antagonists (16 , 49 , 50) . The mechanism by which iron influences D 2 receptor sensitivity is not fully understood, but it has been suggested that iron could be part of the receptor, have a role in the synthesis of the receptor protein, or alter the receptor’s conformation (16) .
Correlations of Ferritin Level With Basal Ganglia Volumes
The symptoms of Tourette’s syndrome are thought to arise from anatomical and functional disturbances in cortical-striatal-thalamic-cortical circuits. MRI studies of the disorder suggest that anatomical and functional disturbances in the basal ganglia portions of these circuits, especially in the caudate nucleus, are trait abnormalities that render individuals vulnerable to tics (51) . For example, smaller caudate volumes were found in both children and adults with Tourette’s syndrome, and putamen and globus pallidus volumes were smaller in affected adults but not children (42) . Our study extends these findings by suggesting that Tourette’s syndrome may be associated with disruptions in the correlations of ferritin with caudate and putamen volumes.
Ferritin level correlated inversely with caudate volume in the healthy comparison subjects but not in the subjects with Tourette’s syndrome, suggesting that a normal association of ferritin with caudate volume is disrupted in persons with the disorder. In contrast, ferritin level did not correlate with putamen volume in the comparison subjects, but it did correlate positively with putamen volume in the Tourette’s syndrome group, suggesting that the disorder is associated with the development of an abnormal correlation between ferritin and the volume of the putamen. The caudate and putamen, however, did share the feature of being smaller in the Tourette’s syndrome subjects who had lower ferritin levels than in the comparison subjects who had lower ferritin levels ( Figure 1 ). Lower iron stores might therefore have contributed to the development of the disorder in these individuals by helping to induce, by unknown mechanisms, the relative hypoplasia of both nuclei.
Correlations of Ferritin Level With Regional Cortical Volumes
Whereas disturbances in the basal ganglia may produce the diathesis for tics, the cortical components of cortical-striatal-thalamic-cortical circuits, particularly prefrontal cortices, seem to be involved in the expression and modulation of tic symptoms (51) . Larger prefrontal volumes have been reported in children with Tourette’s syndrome and may represent a compensatory process that attenuates the severity of tics (41) . In our study, ferritin correlated positively with volumes of the sensorimotor, midtemporal, and subgenual cortices across diagnostic groups. Thus, lower ferritin levels in both groups of subjects may have contributed to smaller cortical volumes. Only in the group with Tourette’s syndrome, however, would these smaller volumes contribute to a smaller inhibitory influence on tic symptoms. This interpretation represents an additional or alternative explanation of how lower iron availability could have a causal influence on the development or exacerbation of tics, leading to the recruitment of subjects with lower iron indices into the Tourette’s syndrome group.
Limitations and Future Directions
Our study has several limitations. First, the findings provide information about associations but not necessarily causation. Second, we obtained only peripheral iron measures, and the association between peripheral and brain iron levels is unclear. Third, we did not assess subjects specifically for sources of iron depletion, namely blood loss, inadequate dietary intake, and malabsorption syndromes, nor did we specifically assess causes of higher ferritin levels, such as inflammation, liver disease, iron supplementation, and blood transfusion (33) . Nevertheless, detailed medical histories for all subjects indicated no ill health at the time of the study. Fourth, the iron indices did not correlate significantly with the severity of tic symptoms. Detecting this correlation may have been especially difficult, however, given the large fluctuations in tic severity at any given age and the complicated trajectories of tic symptoms and iron indices across the wide age range of our participants. Finally, the statistical analyses relating ferritin level to the imaging data were exploratory in nature, and the multiple comparisons involved may have resulted in chance findings.
Despite these limitations, our findings suggest that iron may play an important role in the pathophysiology of Tourette’s syndrome, and they have implications for research into the etiology and treatment of the disorder. For example, genes involved in iron metabolism should be considered in genetic studies of Tourette’s syndrome. In addition, a treatment study of iron supplementation for persons with Tourette’s syndrome should be considered, as it has been for other conditions. An open trial of iron supplementation was reported to reduce the severity of symptoms in adults with restless legs syndrome (21) , and another produced mixed results in boys with ADHD (52) . Some have argued that the available evidence justifies a controlled study of iron supplementation for akathisia (12 , 13) , and iron restriction has been suggested as a potential therapeutic intervention for tardive dyskinesia (25) .
A study of iron supplementation in Tourette’s syndrome would be particularly informative if it included MRI scans to measure iron content in brain tissue before and after treatment. High-field MRI of regional variations in brain iron has been proposed as a potential biomarker that could be incorporated into pharmacological treatment studies for neurological disorders associated with pathological involvement of iron (53) . Although some controversy exists about the degree to which MRI-based measures in the brain, such as T 2 relaxation times, reflect the effects of iron deposits, numerous studies suggest that T 2 times are indeed sensitive measures of brain iron deposition (54) . These values, moreover, are dramatically lower than normal in the brains of patients with Hallervorden-Spatz disease or aceruloplasminemia, conditions of excess deposition of brain iron (53) . Thus, MRI-based measures of T 2 times yoked to a study of iron supplementation in persons with Tourette’s syndrome could help clarify the role of iron in the pathophysiology of this disorder.
Conclusions
If lower iron availability does contribute to the development of tics or to their severity, it is likely neither necessary nor sufficient for developing Tourette’s syndrome. Current models of the pathophysiology of Tourette’s syndrome posit that the development and clinical manifestations of a tic disorder are determined by an individual’s particular combination of multiple risk factors, which include genetic vulnerability, disturbances in brain regions that support self-regulatory functions, neuroendocrine influences, and additional epigenetic determinants (51) . Lower iron stores may represent an additional risk factor that, together with other variables, leads to the development or exacerbation of tics.
1. Peterson BS: Neuroimaging studies of Tourette syndrome: a decade of progress. Adv Neurol 2001; 85:179–196Google Scholar
2. Wolf SS, Jones DW, Knable MB, Gorey JG, Lee KS, Hyde TM, Coppola R, Weinberger DR: Tourette syndrome: prediction of phenotypic variation in monozygotic twins by caudate nucleus D 2 receptor binding. Science 1996; 273:1225–1227 Google Scholar
3. Ernst M, Zametkin AJ, Jons PH, Matochik JA, Pascualvaca D, Cohen RM: High presynaptic dopaminergic activity in children with Tourette’s disorder. J Am Acad Child Adolesc Psychiatry 1999; 38:86–94Google Scholar
4. Pinero D, Connor JR: Iron in the brain: an important contributor in normal and diseased states. Neuroscientist 2000; 6:435–453Google Scholar
5. Hill JM: The distribution of iron in the brain, in Brain Iron: Neurochemistry and Behavioral Aspects. Edited by Youdim MB. London, Taylor & Francis, 1988, pp 1–24Google Scholar
6. Hallgren B, Sourander P: The effect of age on the non-haemin iron in the human brain. J Neurochem 1958; 3:41–51Google Scholar
7. Beard JL, Connor JR: Iron status and neural functioning. Annu Rev Nutr 2003; 23:41–58Google Scholar
8. Sachdev P: The neuropsychiatry of brain iron. J Neuropsychiatry Clin Neurosci 1993; 5:18–29Google Scholar
9. Beard J: Iron deficiency alters brain development and functioning. J Nutr 2003; 133(1 suppl):1468S–1472SGoogle Scholar
10. Ben-Shachar D, Ashkenazi R, Youdim MB: Long-term consequence of early iron-deficiency on dopaminergic neurotransmission in rats. Int J Dev Neurosci 1986; 4:81–88Google Scholar
11. Lozoff B, Jimenez E, Hagen J, Mollen E, Wolf AW: Poorer behavioral and developmental outcome more than 10 years after treatment for iron deficiency in infancy. Pediatrics 2000; 105(4):e51Google Scholar
12. Brown KW, Glen SE, White T: Low serum iron status and akathisia. Lancet 1987; 1:1234–1236Google Scholar
13. Barton A, Bowie J, Ebmeier K: Low plasma iron status and akathisia. J Neurol Neurosurg Psychiatry 1990; 53:671–674Google Scholar
14. Crowe A, Morgan EH: Iron and transferrin uptake by brain and cerebrospinal fluid in the rat. Brain Res 1992; 592:8–16Google Scholar
15. Ben-Shachar D, Livne E, Spanier I, Leenders KL, Youdim MB: Typical and atypical neuroleptics induce alteration in blood-brain barrier and brain 59 FeCl 3 uptake. J Neurochem 1994; 62:1112–1118 Google Scholar
16. Youdim MB, Ben-Shachar D, Yehuda S: Putative biological mechanisms of the effect of iron deficiency on brain biochemistry and behavior. Am J Clin Nutr 1989; 50:607–617Google Scholar
17. Earley CJ, Connor JR, Beard JL, Malecki EA, Epstein DK, Allen RP: Abnormalities in CSF concentrations of ferritin and transferrin in restless legs syndrome. Neurology 2000; 54:1698–1700Google Scholar
18. Berg D, Hoggenmuller U, Hofmann E, Fischer R, Kraus M, Scheurlen M, Becker G: The basal ganglia in haemochromatosis. Neuroradiology 2000; 42:9–13Google Scholar
19. Nielsen JE, Jensen LN, Krabbe K: Hereditary haemochromatosis: a case of iron accumulation in the basal ganglia associated with a parkinsonian syndrome. J Neurol Neurosurg Psychiatry 1995; 59:318–321Google Scholar
20. Moos T, Trinder D, Morgan EH: Cellular distribution of ferric iron, ferritin, transferrin and divalent metal transporter 1 (DMT1) in substantia nigra and basal ganglia of normal and beta2-microglobulin deficient mouse brain. Cell Mol Biol 2000; 46:549–561Google Scholar
21. O’Keeffe ST, Gavin K, Lavan JN: Iron status and restless legs syndrome in the elderly. Age Ageing 1994; 23:200–203Google Scholar
22. Ekbom KA: Restless legs syndrome. Neurology 1960; 10:868–873Google Scholar
23. Logroscino G, Marder K, Graziano J, Freyer G, Slavkovich V, LoIacono N, Cote L, Mayeux R: Altered systemic iron metabolism in Parkinson’s disease. Neurology 1997; 49:714–717Google Scholar
24. Konofal E, Lecendreux M, Arnulf I, Mouren MC: Iron deficiency in children with attention-deficit/hyperactivity disorder. Arch Pediatr Adolesc Med 2004; 158:1113–1115Google Scholar
25. Wirshing DA, Bartzokis G, Pierre JM, Wirshing WC, Sun A, Tishler TA, Marder SR: Tardive dyskinesia and serum iron indices. Biol Psychiatry 1998; 44:493–498Google Scholar
26. Nemes ZC, Rotrosen J, Angrist B, Peselow E, Schoentag R: Serum iron levels and akathisia. Biol Psychiatry 1991; 29:411–413Google Scholar
27. Torsdottir G, Kristinsson J, Sveinbjornsdottir S, Snaedal J, Johannesson T: Copper, ceruloplasmin, superoxide dismutase and iron parameters in Parkinson’s disease. Pharmacol Toxicol 1999; 85:239–243Google Scholar
28. Sachdev P: Tardive akathisia, tardive dyskinesia, and serum iron status. J Clin Psychopharmacol 1994; 14:147–149Google Scholar
29. Berger K, von Eckardstein A, Trenkwalder C, Rothdach A, Junker R, Weiland SK: Iron metabolism and the risk of restless legs syndrome in an elderly general population—the MEMO-study. J Neurol 2002; 249:1195–1199Google Scholar
30. Millichap JG, Yee MM, Davidson SI: Serum ferritin in children with attention-deficit hyperactivity disorder. Pediatr Neurol 2006; 34:200–203Google Scholar
31. Lammi-Keefe CJ, Lickteig ES, Ahluwalia N, Haley NR: Day-to-day variation in iron status indexes is similar for most measures in elderly women with and without rheumatoid arthritis. J Am Diet Assoc 1996; 96:247–251Google Scholar
32. Dale JC, Burritt MF, Zinsmeister AR: Diurnal variation of serum iron, iron-binding capacity, transferrin saturation, and ferritin levels. Am J Clin Pathol 2002; 117:802–808Google Scholar
33. Worwood M: Serum ferritin. CRC Crit Rev Clin Lab Sci 1979; 10:171–204Google Scholar
34. Cook JD, Lipschitz DA, Miles LE, Finch CA: Serum ferritin as a measure of iron stores in normal subjects. Am J Clin Nutr 1974; 27:681–687Google Scholar
35. Peterson BS, Gore JC, Riddle MA, Cohen DJ, Leckman JF: Abnormal magnetic resonance imaging T 2 relaxation time asymmetries in Tourette’s syndrome. Psychiatry Res 1994; 55:205–221 Google Scholar
36. Pauls DL, Hurst CR: Schedule for Tourette and Other Behavioral Syndromes. New Haven, Conn, Yale University Child Study Center, 1996Google Scholar
37. Leckman JF, Riddle MA, Hardin MT, Ort SI, Swartz KL, Stevenson J, Cohen J: The Yale Global Tic Severity Scale: initial testing of a clinician-rated scale of tic severity. J Am Acad Child Adolesc Psychiatry 1989; 28:566–573Google Scholar
38. Goodman WK, Price LH, Rasmussen SA, Mazure C, Fleischmann RL, Hill CL, Heninger GR, Charney DS: The Yale-Brown Obsessive Compulsive Scale, I: development, use, and reliability. Arch Gen Psychiatry 1989; 46:1006–1011Google Scholar
39. DuPaul GJ: Parent and teacher ratings of ADHD symptoms: psychometric properties in a community-based sample. J Clin Child Psychol 1991; 20:245–253Google Scholar
40. Kaufman AS, Kaufman NL: KBIT-2: Kaufman Brief Intelligence Test, 2nd ed. Circle Pines, Minn, American Guidance Service, 2004Google Scholar
41. Peterson BS, Staib L, Scahill L, Zhang H, Anderson C, Leckman JF, Cohen DJ, Gore JC, Albert J, Webster R: Regional brain and ventricular volumes in Tourette syndrome. Arch Gen Psychiatry 2001; 58:427–440Google Scholar
42. Peterson BS, Thomas P, Kane MJ, Scahill L, Zhang Z, Bronen R, King R, Leckman JF, Staib L: Basal ganglia volumes in patients with Gilles de la Tourette syndrome. Arch Gen Psychiatry 2003; 60:415–424Google Scholar
43. Shrout PE, Fleiss JL: Intraclass correlations: uses in assessing rater reliability. Psychol Bull 1979; 86:420–428Google Scholar
44. Baynes RD: Assessment of iron status. Clin Biochem 1996; 29:209–215Google Scholar
45. Custer EM, Finch CA, Sobel RE, Zettner A: Population norms for serum ferritin. J Lab Clin Med 1995; 126:88–94Google Scholar
46. Yip R, Johnson C, Dallman PR: Age-related changes in laboratory values used in the diagnosis of anemia and iron deficiency. Am J Clin Nutr 1984; 39:427–436Google Scholar
47. Curtis AR, Fey C, Morris CM, Bindoff LA, Ince PG, Chinnery PF, Coulthard A, Jackson MJ, Jackson AP, McHale DP, Hay D, Barker WA, Markham AF, Bates D, Curtis A, Burn J: Mutation in the gene encoding ferritin light polypeptide causes dominant adult-onset basal ganglia disease. Nat Genet 2001; 28:350–354Google Scholar
48. Ross EM: Evaluation and treatment of iron deficiency in adults. Nutr Clin Care 2002; 5:220–224Google Scholar
49. Erikson KM, Jones BC, Hess EJ, Zhang Q, Beard JL: Iron deficiency decreases dopamine D 1 and D 2 receptors in rat brain. Pharmacol Biochem Behav 2001; 69:409–418 Google Scholar
50. Csernansky JG, Csernansky CA, Bonnet KA, Hollister LE: Dopaminergic supersensitivity follows ferric chloride-induced limbic seizures. Biol Psychiatry 1985; 20:723–733Google Scholar
51. Spessot AL, Peterson BS: Tourette’s syndrome: a multifactorial, developmental psychopathology, in Developmental Psychopathology, vol 2: Developmental Neuroscience, 2nd ed. Edited by Cicchetti D, Cohen DJ. New York, John Wiley & Sons, 2006Google Scholar
52. Sever Y, Ashkenazi A, Tyano S, Weizman A: Iron treatment in children with attention deficit hyperactivity disorder: a preliminary report. Neuropsychobiology 1997; 35:178–180Google Scholar
53. Schenck JF, Zimmerman EA: High-field magnetic resonance imaging of brain iron: birth of a biomarker? NMR Biomed 2004; 17:433–445Google Scholar
54. Hikita T, Abe K, Sakoda S, Tanaka H, Murase K, Fujita N: Determination of transverse relaxation rate for estimating iron deposits in central nervous system. Neurosci Res 2005; 51:67–71Google Scholar