Genetic Load on Amygdala Hypofunction During Sadness in Nonaffected Brothers of Schizophrenia Patients
Abstract
OBJECTIVE: In a previous study, the authors reported that patients with schizophrenia show subcortical-limbic hypoactivity during sadness. In this study, they capitalized on those findings in order to assess the genetic influence of negative mood experience in schizophrenia patients. Brain activity was measured during mood induction in patients with schizophrenia and their first-degree nonaffected relatives. METHOD: Functional magnetic resonance imaging was used to investigate 13 male patients with schizophrenia, their nonaffected brothers (N=13), and a group of 26 individually matched healthy subjects unrelated to the siblings during induction of sad and happy moods as well as during a cognitive control task. A regional analysis was applied to investigate a possible subcortical-limbic dysfunction in relatives. RESULTS: Mood induction was successful in all groups according to subjective ratings. During sadness induction, the patients and their nonaffected siblings demonstrated less activity in the amygdala compared with the healthy group of nonrelatives. Other regions of interest, such as the left orbitofrontal cortex, the left superior temporal cortex, and the left precuneus/posterior cingulate revealed significant group differences only between patients and nonrelated healthy subjects. During positive mood induction, no group differences could be found in the amygdala. CONCLUSIONS: Following induction of sad mood, both patients with schizophrenia and their nonaffected brothers displayed reduced brain activity in the amygdala. Such hypoactivity is likely to represent a genetic influence and indicates that efficient compensatory mechanisms capable of preventing the onset of the illness must exist in nonaffected relatives.
First-degree relatives of patients with schizophrenia have an increased risk of developing schizophrenia and display psychopathological, behavioral, and neurobiological characteristics that are attenuated versions of those seen in patients. Accordingly, this special group of subjects can provide unique insights on the genetic influences impinging over neurobehavioral features of schizophrenia and thus contribute to differentiating between trait and state characteristics.
Affective dysfunctions can be observed frequently in first-degree relatives of patients with schizophrenia, although often to a lesser extent. For instance, first-degree relatives of patients with schizophrenia present a higher prevalence of schizotypal personality traits than matched comparison subjects (1). Such traits can be found together with social isolation (2) and negative symptoms such as inadequate affect, social withdrawal, and curiosities in behavior and language (1, 3). The similarity of affective disturbances in patients with schizophrenia and their first-degree relatives suggests a common neural source behind such altered emotional processing, possibly in subcortical-limbic areas. This issue can be addressed by exploring whether first-degree relatives of patients with schizophrenia display altered brain anatomy or dysfunctional neural responses.
Altered brain anatomy in first-degree relatives of schizophrenia patients has been revealed by structural neuroimaging studies. Several subcortical structures (hippocampus, amygdala, thalamus) have shown comparable volume reductions in patients with schizophrenia and first-degree relatives (4–8). Hence, the affected regions comprise the brain network known to be implicated during emotional processing.
Neurobiological function in first-degree relatives of patients with schizophrenia is also affected. For instance, cognitive tasks evoke reduced regional cerebral blood flow in prefrontal and anterior cingulate regions in relatives of patients with schizophrenia compared with healthy subjects (9). O’Driscoll et al. (5) suggested that subtle frontal dysfunctions during eye tracking could represent a trait marker in relatives. However, another study found no evidence for neural trait markers in members of multiply affected families during verbal fluency tasks (10), despite reports showing several cognitive impairments in nonaffected relatives (11–13). The inconsistency of these results might depend on contingent factors like the cognitive task at hand, the neuroimaging method, or the size of the relatives’ cohort. Alternatively, it might be argued that in the context of schizophrenia, emotional rather than cognitive markers might prove more robust for characterizing genetic influences of brain (dys)function.
Here, we explored whether the behavioral disturbances observed, to different degrees, in patients with schizophrenia and their first-degree relatives can be traced back to their neural substrates. In light of the specific dysfunctions evoked by emotional processing in both groups, we used functional magnetic resonance imaging (fMRI) during manipulation of affective states and cognitive processing in matched groups of male patients with schizophrenia, their nonaffected brothers, and healthy volunteers unrelated to the siblings. This approach allowed us to dissociate cerebral dysfunction related to emotional processing from more general cognitive abnormalities. Given the wealth of work pointing to structural and functional alterations of the amygdaloid complex in patients with schizophrenia (14–16), we have focused our analysis on this crucial node of the cerebral network involved in emotional processing, testing the hypothesis that nonaffected relatives reveal amygdala dysfunctions similar to those previously found in patients with schizophrenia (14).
Method
Subjects
Participants were between 18 and 45 years of age and comprised three groups: male patients with schizophrenia (N=13), their nonaffected brothers (N=13), and healthy volunteers unrelated to the siblings (N=26). Patients were recruited at the Departments of Psychiatry of the Universities of Bonn and Düsseldorf and were either inpatients or outpatients. The nonaffected brothers had never received any psychiatric diagnosis or undergone any psychological or psychiatric treatment (i.e., psychotropic medication) in their lifetime. The fMRI measurements took place at the Research Center Jülich. Patients were included in the study if they had a healthy unaffected male sibling who was willing to participate in the study. If there was more than one unaffected brother, only one sibling was included (depending on consent to participate). Patients met DSM-IV criteria for schizophrenia as determined with the Structured Clinical Interview for DSM-IV (17), which was performed by an experienced psychiatrist and psychologist. Patients with lifetime psychiatric comorbidity per DSM-IV (with the exception of substance abuse) were excluded. For all subjects, the usual exclusion criteria for MRI were applied (neurological disease, disorders that affect cerebral metabolism, age under 18 and over 46, Mini-Mental State Examination score <20). After complete description of the study, written informed consent was obtained. The local institutional review board approved the protocol.
The mean age of the patients was 32.8 years (SD=8.5, range=21–44). Mean duration of illness was 11.5 years (SD=8.0, range=2–26), with a mean of 5.3 previous hospitalizations (SD=5.8, range=1–19). The nonaffected brothers were a mean age of 33.8 years (SD=8.7, range=20–46). The mean parental education was 10.8 years (SD=2.4, range=9–15.5).
Psychopathological status was assessed with the Positive and Negative Syndrome Scale for schizophrenia (18). Significant differences were found between patients and their brothers on all scales (positive symptoms: mean=11.7 [SD=4.3] versus 7.8 [SD=1.4], respectively [t=3.2, df=14.4, p=0.01]; negative symptoms: mean=18.3 [SD=7.9] versus 9.2 [SD=5.4] [t=3.4, df=24, p=0.002]; general psychopathology: mean=31.4 [SD=12.5] versus 18.2 [SD=5.2] [t=3.5, df=16.1, p=0.003]; total: mean=61.5 [SD=23.2] versus 35.2 [SD=11.4] [t=3.7, df=17.5, p=0.002]. All patients but one were receiving neuroleptics (mean=331.9 mg/day in chlorpromazine equivalents, SD=267.0, range=0–816.7); eight were taking typical neuroleptics, and four were taking atypical neuroleptics. Intelligence was estimated with the German MWT-B (multiple-choice test of verbal crystallized premorbid intelligence). There was no difference in score between the patients (mean=28.9, SD=4.6) and their brothers (mean=31.3, SD=4.0) (t=–1.3, df=22, p=0.20).
Volunteer subjects (N=26) were screened by comprehensive assessment procedures. These subjects were healthy (no lifetime DSM-IV diagnosis, no first-degree relatives with psychiatric diseases) and chosen as matched pairs to both sibling groups corresponding to age (plus or minus 1 year), gender, and parental education (plus or minus 1 year). Mean age was 33.4 years (SD=8.1, range=21–46), and mean parental education was 12.1 years (SD=3.8, range=9–18). One-way analyses of variance (ANOVAs) for age and parental education with group as between-subject factor revealed no significant group differences in age (F=0.04, df=2, 49, p=0.96) or parental education (F=1.04, df=2, 49, p=0.36).
Procedure
Subjects participated in a standardized mood induction procedure, described previously (19). Stimuli consisted of happy and sad facial expressions. The instructions were as follows: “During this task, I would like you to try to become happy [sad]. To help you do that, I will be showing you slides with faces expressing happiness [sadness]. Look at each face and use it to help you to feel happy [sad].”
Subjects moved on to the next face in a self-paced manner by pressing response buttons. The cognitive control condition consisted of a gender differentiation task requiring subjects to determine the gender of the character portrayed on each slide. As in the other conditions, subjects responded by pressing one of two response buttons in a self-paced manner. Progression rates (i.e., number of stimuli seen by the subjects in the different conditions) were not significantly different in the three groups (two-way ANOVA with group as a between-subject factor and emotion category as a within-subject factor). Only the expected main effect for emotion category appeared: more faces were processed during the cognitive control condition (mean=99.8, SD=33.3) than during induction of happiness (mean=22.3, SD=19.7) or sadness (mean=22.6, SD=20.2) (F=172.61, df=2, 92, p=0.0001).
The dependent measure for quantifying the mood induction effect was the Positive and Negative Affect Schedule (20), a 5-point unipolar intensity scale that includes 20 items for factor-referenced emotional descriptors for orthogonal positive and negative dimensions.
Subjects participated in three conditions (happiness induction, sadness induction, gender differentiation) while fMRI data were acquired (Figure 1). Three additional fMRI tasks were also performed afterward by the subjects, reported elsewhere (21). The three conditions were administered in counterbalanced order (Latin square design) with the cognitive control condition amid the two emotion induction conditions to minimize carryover effects. Total scanning time was about 1 hour including the three-dimensional data set.
Cerebral activation was measured with fMRI, based on echo planar imaging using blood-oxygen-level-dependent (BOLD) contrast. The fMRI brain images were acquired using a 1.5-T Scanner (Siemens). The acquisition of a three-dimensional data set (256×256×128 sagittal, field of view=230 mm, TE=4.4 msec, TR=11.4 msec, α=15°) was followed by transaxial functional images (echo planar imaging, 64×64, 30 slices, voxel size: 3×3×4 mm3, TE=66 msec, TR=4 seconds, α=90°) covering the whole brain and positioned parallel to the intercommissural line (anterior commissure-posterior commissure).
Each mood induction condition included alternating baseline (N=4) and activation phases (N=3), each comprising 15 whole brain acquisitions. The first baseline included three additional scans (prescan period), hence each condition included 108 measurements with a duration of 7 minutes 12 seconds. Baseline phases were resting baselines. Subjects had to remain calm with eyes open. The three conditions were separated by 3-minute breaks. After each of these conditions, subjective ratings were assessed with the Positive and Negative Affect Schedule during breaks.
Data Analysis
Subjective ratings
The dependent measure for quantifying the mood induction effect was derived from the positive and negative scores of the Positive and Negative Affect Schedule. A repeated-measures ANOVA with three factors, mood induction (happy, sad), Positive and Negative Affect Schedule score (positive, negative) and group (patients, nonaffected brothers, and nonrelated healthy subjects) as between-subject variables was performed to check the mood induction effect. The scale-by-mood induction interaction served as a test for the hypothesis.
fMRI
The fMRI data analysis was performed using SPM 99 (http://www.fil.ion.ucl.ac.uk/spm). For preprocessing, functional data were realigned to the 10th image. Inspection of the brain volumes yielded no spatial offset of more than one voxel in any of the subjects. The first three images were discarded. Data analysis was performed for blocks of activation related to baseline phases. Hence, after coregistration, stereotaxic normalization, and smoothing (10-mm isotropic Gaussian filter), statistical parametric maps were calculated by using the stimulation time courses (baseline versus activation as a delayed boxcar convolved with a hemodynamic response function) as regressors, independently for each subject. Contrast images for each emotional condition and each subject were created contrasting the emotional (sadness, happiness) and the cognitive control condition. The group analysis was performed according to a random effect model, applying one-sample t tests per group per contrast. Between-group comparisons were performed on these contrast images with a one-way ANOVA.
Capitalizing on our previous work (14, 22) and on the basis of the conceptual arguments delineated in the introduction, we tested our hypothesis of hypoactivity in the amygdala of first-degree relatives of patients with schizophrenia on the basis of a defined volume of interest around this region. This procedure ensures an enhanced sensitivity (reduced type II errors) without affecting the specificity of the results. We further verified group differences with a second-order analysis on the relative signal change in each volume of interest (left and right amygdala). For this, signal time courses were extracted at the regional maxima of activation in the contrast images for sadness induction versus cognitive control task and happiness induction versus cognitive control task in each group at a threshold of p=0.05 (based on the one-sample t test). The relative signal change (SC) during induction of sadness and happiness was calculated as SCACT–SCBL, where SCACT and SCBL refer to the mean signal change during activation and baseline, respectively. These relative signal changes served as dependent measures in a repeated measures ANOVA (SAS) with group (patients, nonaffected brothers, nonrelated healthy subjects) as a between-subject factor and laterality (left, right) as a repeated measurements factor. Our crucial concern here was being able to measure BOLD signal from the amygdala (i.e., a concern related to image quality) rather than being able to measure a difference in BOLD signal between conditions (i.e., a concern related to functional responses). In this context, the issue of within-group differences in amygdala activation becomes an issue of intersubject variability in structural anatomy and magnetic resonance susceptibility rather than functional variability.
We also assessed group differences in neural activity across six volumes of interest (spheres of 16-mm radius, centered on the thalamus, precuneus, anterior cingulate, and orbitofrontal, superior temporal, dorsolateral prefrontal cortices) in light of their expected involvement in emotional processing. The statistical threshold used in these anatomically constrained analyses was p<0.05 corrected for the search volume over each volume of interest.
Covariation of BOLD effect with emotion measures, psychopathology, and medication
Pearson correlations were calculated between psychopathological assessments, BOLD effect, and subjective ratings. Relative signal change was correlated with mean subjective effect for sadness after we controlled for the baseline Positive and Negative Affect Schedule score before mood induction. Additionally, the effect of neuroleptic dose (in chlorpromazine equivalents) on signal intensity changes was examined.
Results
Subjective Ratings
ANOVA of the Positive and Negative Affect Schedule data yielded a scale-by-mood induction interaction (F=41.4, df=1, 49, p<0.0001), with no between-group effects and a main effect for emotion (F=124.1, df=1, 49, p<0.0001). During induction of happy mood there was more positive affect (relatives: mean=31.4 [SD=8.8]; patients: mean=28.0 [SD=8.4]; comparison subjects: mean=28.3 [SD=6.9]) than negative affect (relatives: mean=11.2 [SD=1.7]; patients: mean=13.9 [SD=3.8]; comparison subjects: mean=12.0 [SD=3.6]). For sad mood the reverse was observed: more negative affect (relatives: mean=15.5 [SD=5.8]; patients: mean=17.5 [SD=6.7]; comparison subjects: mean=16.2 [SD=5.2]) and less positive affect (relatives: mean=24.3 [SD=8.8]; patients: mean=24.5 [SD=7.5]; comparison subjects: mean=22.9 [SD=7.4]). The cognitive control condition revealed more positive affect (mean=29.9, SD=7.7) than negative affect (mean=12.3, SD=4.4) in relatives. The same applied for patients (mean=26.4 [SD=7.8] versus 16.4 [SD=6.6], respectively) and comparison subjects (mean=27.5 [SD=7.0], versus mean=12.8 [SD=3.9]).
Activation Differences During Sadness Induction
We assessed amygdala activation in a subset of subjects with reliable BOLD signal in this region (nine of 13 schizophrenia patients, 10 of 13 nonaffected brothers, and 19 of 26 healthy subjects unrelated to the siblings). The ANOVA (based on all subjects, however those with lacking data are disregarded during the calculation) was performed on the volume of interest index and revealed a significant main effect for group (F=3.44, df=2, 29, p<0.046), without significant interactions. Post hoc t tests were used for the mean relative volume of interest irrespective of laterality to decompose the group effect. Nonaffected relatives and patients with schizophrenia demonstrated no significant differences and hence the two groups were combined for further analysis. Healthy comparison subjects showed significantly more amygdala activation than patients and their brothers (t=3.0, df=36, p=0.004) (Figure 2 and Figure 3).
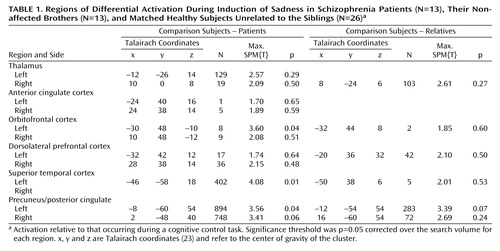
Regional group differences for the SPM ANOVA were only significant when contrasting patients and nonrelated healthy subjects (Table 1). Significantly higher brain activation in healthy subjects than in the schizophrenia patients was found in the left orbitofrontal area, the left superior temporal cortex, and the left precuneus extending into the posterior cingulate with a similar tendency in the right precuneus/posterior cingulate. A tendency was also observed for higher brain activity in the left precuneus/posterior cingulate in healthy subjects unrelated to the sibling groups compared with the nonaffected brothers of the schizophrenia patients.
Activation Differences During Happiness Induction
A volume of interest analysis was also performed following induction of happy mood. Five patients, 11 nonaffected brothers, and 20 healthy subjects unrelated to the siblings showed activation in the amygdala. The ANOVA revealed no significant main effect for the group nor any significant interaction.
Similar to the induction of sad mood, a significantly higher activation in the healthy subjects unrelated to the siblings compared with the patients was observed in the left thalamus only following the SPM ANOVA (SPM(T)=3.63, p<0.04). Furthermore, the nonaffected brothers revealed significantly more activation than patients in the right precuneus/posterior cingulate.
Covariation of BOLD Effect With Emotion Measures, Psychopathology, and Medication
In comparison subjects, signal intensities in the amygdala increased with intensified subjective experience of sadness (r=–0.46, df=24, p=0.04). In nonaffected relatives and patients with schizophrenia this correlation failed to reach significance (r=–0.15). Significant correlations between amygdala activation during sad mood and psychopathological data could not be found. Furthermore, the correlation between chlorpromazine equivalents and volume of interest was not significant in patients (r=0.42, df=11, p=0.27).
Discussion
In the present study, we assessed possible effects of genetic load on regional cerebral dysfunction. Both patients with schizophrenia and their nonaffected brothers showed a specific reduction in amygdala activity during negative mood induction compared with healthy subjects unrelated to the siblings, despite matched subjective experience of negative mood state.
Dysfunctional Activation Patterns of Schizophrenia Patients and Their Nonaffected Brothers
Amygdala
Both patients with schizophrenia and their nonaffected brothers failed to show amygdala activation comparable to unrelated healthy subjects during sad mood induction, as suggested by the group differences in our second-order analysis. Moreover, a lack of significant correlation between subjective ratings and signal change in the amygdala accompanied this result. In contrast, healthy male subjects demonstrated amygdala activation as a correlate of sad mood (Figure 3), which confirmed previous results (22, 24, 25). Furthermore, these results also corroborate and enhance the earlier finding of a lack of amygdala activation in another sample of patients with schizophrenia during negative mood (14) as well as a lack of correlation with subjective ratings. A similar amygdala dysfunction has been found by others during emotional tasks (15, 26). Since the patient group of the present study had a more stable and remitted psychopathological status (GAS score: mean=64.1 [SD=18.1]; illness duration: mean=11.5 years [SD=8.0]; treatment dose: mean=331.9 mg/day in chlorpromazine equivalents [SD=267.0]) than the group investigated by Schneider et al. (GAS score: mean=53.0 [SD=12.6]; illness duration: mean=8.5 years [SD=7.4]; treatment dose: mean=504.1 mg [SD=341.7]), this points to stable dysfunctions. Moreover, nonaffected siblings were not medicated but displayed comparable amygdala dysfunction to the medicated patients. Accordingly, medication could not fully account for these effects. Since this subcortical limbic dysfunction during negative affect is already present in nonaffected relatives, this implies that these functional deficits are genetically modulated and that the impairments can be identified before the onset of the disease in high-risk groups. Our findings also suggest that, given the crucial role played by the amygdala during processing and experience of emotions (14, 22, 24–28), it is conceivable that dysfunction in this area may be causal for the emotional impairments and affective symptoms found in nonaffected relatives and in patients.
Furthermore, the subclinical degree of psychopathology displayed by our first-degree relatives of patients with schizophrenia, together with the absence of any treatment, indicates that nonaffected relatives possess compensatory behavioral strategies and brain mechanisms against the observed amygdala hypofunction. We suggest that these mechanisms are represented by frontal, temporal, and parietal cortical areas. The differences between schizophrenia patients and their nonaffected brothers found in these regions can account for symptomatic differences between the two groups and may be the consequence of environmental effects. In first-degree relatives of patients with schizophrenia, amygdala dysfunction during mood induction might be rebalanced by an otherwise intact cerebral network, found in unaffected orbitofrontal, temporal, and precuneus/posterior cingulate functions. Accordingly, this cortical network might still be able to regulate emotional experience despite amygdala dysfunction.
Other brain regions
We found significant differences during induction of sad mood only between schizophrenia patients and the nonrelated healthy subjects. They were restricted to the left hemisphere and were found in the orbitofrontal region, the superior temporal cortex, and the precuneus/posterior cingulate. Here, patients showed regional hypoactivation relative to comparison subjects. One exception was observed for the left precuneus/posterior cingulate, in which a tendency for similar hypofunction was observed in the first-degree relatives. During induction of happy mood, patients showed a significantly smaller activation than comparison subjects only in the left thalamus. Since the other group contrasts remained nonsignificant for both mood states, a final conclusion with respect to trait or state characteristics of these dysfunctions cannot be drawn.
Nevertheless, it is conceivable that hypoactivation in the prefrontal and temporal cortices of patients may be a consequence of amygdala dysfunction, since these regions are highly interconnected with the amygdala and seem to constitute the cerebral network implicated in the experience of emotion (29). The involvement of the orbitofrontal cortex in emotional processing has been frequently described, particularly its importance in emotional regulation (30) and in emotional and moral judgments (31). The activation in the superior temporal cortex may reflect its involvement in facial emotion perception, relevant during our mood induction procedure (32), but also more complex social cognition processes (30). The role of the precuneus as well as posterior cingulate in emotion processing is still unclear. Although activation in this region has been reported during different mood induction procedures (33, 34), the precuneus is more consistently associated with memory processes, especially episodic retrieval (35) and recall (36). It might be relevant to note that these processes are likely to be evoked during our mood induction procedures. Finally, thalamic participation during sadness as well as happiness (28) has also been documented. Hypoactivation in these areas may correspond to the specific dysfunctions described in patients, such as deficits in emotional facial processing, memory, and emotion regulation. Moreover, regional dysfunctions correspond to previously described affected regions mostly during nonemotional functions (e.g., references 37, 38).
Methodological Considerations
The amygdala is known to be prone to serious susceptibility artifacts that make fMRI investigations in this region particularly challenging. We have adopted conservative methods of data analysis, balancing sensitivity and specificity through the use of a principled region-of-interest approach. However, this approach does not allow us to make inferences over the whole brain.
Considering our previous fMRI results revealing gender differences in healthy subjects applying the same task (22), only men have been investigated in order to analyze a homogeneous sample, leaving gender effects unaddressed. Also, the specific features of the activation pattern during mood induction in each group are beyond the scope of this paper. Finally, it should be noted that in this study there were no significant hemispheric lateralization effects for the amygdala, similar to our previous report (14). Furthermore, we cannot exclude that our findings may be somehow related to stronger requirements for movement selection or incidental verbalizations during the cognitive control period, as compared with the mood conditions. However, given that our analysis involved direct subtractions of the cognitive control from these conditions, any spurious activation related to stronger selection or verbalization during the control period would not have emerged. On the other hand, we cannot exclude that strong and localized deactivations related to such processes occurring during the control condition might have been misattributed to increased neural responses induced by the mood conditions. However, the choice of the cognitive task allowed us to take full advantage of our previous neuroimaging experiments (14, 22), using the same stimulus material with a cognitive demand.
Our findings of dysfunction in the amygdala of first-degree relatives of patients with schizophrenia confirm morphological investigations demonstrating structural abnormalities in this region (4, 39). However, by the same token, it might be argued that structural deficits could account for brain dysfunctions verified with neuroimaging methods. For instance, high-risk individuals revealed higher volumes than patients but lower volumes than healthy comparison subjects (6). In patients with schizophrenia these volume reductions are frequent and well documented. In a review of 49 MRI studies by Shenton and colleagues (40), 74% reported volume reductions in this medial temporal lobe structure. We cannot rule out the possibility that volume differences may exist between groups and may underlie functional differences. However, we have previously reported that amygdala volume could not account for differences in functional activity between patients and comparison subjects (14).
Conclusions
We have shown that following negative mood induction, both patients with schizophrenia and their nonaffected brothers displayed reduced brain activity in a crucial region of the subcortical-limbic circuit of emotion processing. Conversely, subjective emotional experiences were comparable across groups. This result points to an influence of genetic loading in cerebral dysfunctions relevant to emotion processing and emphasizes the role of the amygdala for negative affect. Furthermore, our results highlight how compensatory mechanisms probably influenced by environmental effects might be able to prevent clinically relevant symptoms despite amygdala impairments.
 |
Received March 25, 2003; revision received Dec. 10, 2003; accepted Dec. 23, 2003. From the Department of Psychiatry and Psychotherapy, University of Düsseldorf; the Institute of Medicine Research Center, Jülich, Germany; the F.C. Donders Centre for Cognitive Neuroimaging, Nijmegen, the Netherlands; and the Department of Psychiatry, University of Homburg, Germany. Address reprint requests to Dr. Habel, Department of Psychiatry and Psychotherapy, University of Aachen, Pauwelsstr. 30, 52074 Aachen, Germany; [email protected] (e-mail). This work was supported by the German Research Foundation DFG, Schn 362/10–1 and Schn 362/13–1. The authors thank B. Elghawaghi, I. Dani, H. Greenland, M. Grosse-Ruyken (deceased), U. Pfeiffer, U. Felger, V. Backes, S. Schramm, N. Seiffert, and B. Bewernick for assistance and support. The authors also thank R.C. Gur and R.E. Gur for stimulus material and advice and E. Moser for advice.

Figure 1. Experimental Design of 108 fMRI Measurements Obtained From Schizophrenia Patients (N=13), Their Nonaffected Brothers (N=13), and Matched Healthy Subjects Unrelated to the Siblings (N=26) During Induction of Sadness and Happiness and a Cognitive Control Taska
aEach condition was applied as a blocked design with three activation phases separated by resting baselines. The cognitive control condition was a gender differentiation task.

Figure 2. Subcortical Brain Activation During Induction of Sadness in Schizophrenia Patients (N=13), Their Nonaffected Brothers (N=13), and Matched Healthy Subjects Unrelated to the Siblings (N=26)a
aGroup activations (one-sample t test) depict the contrast between sadness induction and the cognitive control task for all groups. Data is presented in neurological convention (right is right). Stronger amygdala-hippocampal activation (extending to the parahippocampal gyrus) could be observed in comparison subjects relative to schizophrenia patients and their nonaffected brothers. Further clusters of activation can be seen in the inferior frontal gyrus of patients and comparison subjects as well as in the medial temporal gyrus of relatives and comparison subjects. These are regions of importance during mood experiences. However, with the focus of this study being on between-group comparisons, group differences in these regions were not significant.

Figure 3. Mean Signal Time Courses of Amygdala Activation During Induction of Sadness in Schizophrenia Patients, Their Nonaffected Brothers, and Matched Healthy Subjects Unrelated to the Siblingsa
aMean signal time course in the amygdala during sad mood induction in the three groups.
1. Torgersen S, Onstad S, Skre I, Edvardsen J, Kringlen E: “True” schizotypal personality disorder: a study of co-twins and relatives of schizophrenic probands. Am J Psychiatry 1993; 150:1661–1667Link, Google Scholar
2. Kirkpatrick SU, Ross DE, Walsh D, Karkowski L, Kendler KS: Family characteristics of deficit and nondeficit schizophrenia in the Roscommon Family Study. Schizophr Res 2000; 45:57–64Crossref, Medline, Google Scholar
3. Nuechterlein KH, Asarnow RF, Subotnik KL, Fogelson DL, Payne DL, Kendler KS, Neale MC, Jacobson KC, Mintz J: The structure of schizotypy: relationships between neurocognitive and personality disorder features in relatives of schizophrenic patients in the UCLA Family Study. Schizophr Res 2002; 54:121–130Crossref, Medline, Google Scholar
4. Seidman LJ, Faraone SV, Goldstein JM, Goodman JM, Kremen WS, Toomey R, Tourville J, Kennedy D, Makris N, Caviness VS, Tsuang MT: Thalamic and amygdala-hippocampal volume reductions in first-degree relatives of patients with schizophrenia: an MRI-based morphometric analysis. Biol Psychiatry 1999; 46:941–954Crossref, Medline, Google Scholar
5. O’Driscoll GA, Florencio PS, Gagnon D, Wolff AV, Benkelfat C, Mikula L, Lal S, Evans AC: Amygdala-hippocampal volume and verbal memory in first-degree relatives of schizophrenic patients. Psychiatry Res 2001; 107:75–85Crossref, Medline, Google Scholar
6. Lawrie SM, Whalley HC, Abukmeil SS, Kestelman JN, Donnelly L, Miller P, Best JJ, Owens DG, Johnstone EC: Brain structure, genetic liability, and psychotic symptoms in subjects at high risk of developing schizophrenia. Biol Psychiatry 2001; 49:811–823Crossref, Medline, Google Scholar
7. Steel RM, Whalley HC, Miller P, Best JJ, Johnstone EC, Lawrie SM: Structural MRI of the brain in presumed carriers of genes for schizophrenia, their affected and unaffected siblings. J Neurol Neurosurg Psychiatry 2002; 72:455–458Medline, Google Scholar
8. Falkai P, Honer WG, Alfter D, Schneider-Axmann T, Bussfeld P, Cordes J, Blank B, Schönell H, Steinmetz H, Maier W, Tepest R: The temporal lobe in schizophrenia from uni- and multiply affected families. Neurosci Lett 2002; 325:25–28Crossref, Medline, Google Scholar
9. Blackwood DH, Glabus MF, Dunan J, O’Carroll RE, Muir WJ, Ebmeier KP: Altered cerebral perfusion measured by SPECT in relatives of patients with schizophrenia: correlations with memory and P300. Br J Psychiatry 1999; 175:357–366Crossref, Medline, Google Scholar
10. Spence SA, Liddle PF, Stefan MD, Hellewell JS, Sharma T, Friston KJ, Hirsch SR, Frith CD, Murray RM, Deakin JF, Grasby PM: Functional anatomy of verbal fluency in people with schizophrenia and those at genetic risk: focal dysfunction and distributed disconnectivity reappraised. Br J Psychiatry 2000; 176:52–60Crossref, Medline, Google Scholar
11. Deakin FW, Simpson MD, Slater P, Hellewell JS: Familial and developmental abnormalities of front lobe function and neurochemistry in schizophrenia. J Psychopharmacol 1997; 11:133–142Crossref, Medline, Google Scholar
12. Michie PT, Kent A, Stienstra R, Castine R, Johnston J, Dedman K, Wichmann H, Box J, Rock D, Rutherford E, Jablensky A: Phenotypic markers as risk factors in schizophrenia: neurocognitive functions. Aust NZ J Psychiatry 2000; 34(suppl):S74-S85Google Scholar
13. Dollfus S, Lombardo C, Benali K, Halbecq I, Abadie P, Marie RM, Brazo P: Executive/attentional cognitive functions in schizophrenic patients and their parents: a preliminary study. Schizophr Res 2002; 53:93–99Crossref, Medline, Google Scholar
14. Schneider F, Weiss U, Kessler C, Salloum JB, Posse S, Grodd W, Müller-Gärtner H-W: Differential amygdala activation in schizophrenia during sadness. Schizophr Res 1998; 34:133–142Crossref, Medline, Google Scholar
15. Gur RE, McGrath C, Chan RM, Schroeder L, Turner T, Turetsky BI, Kohler C, Alsop D, Maldjian J, Ragland JD, Gur RC: An fMRI study of facial emotion processing in patients with schizophrenia. Am J Psychiatry 2002; 159:1992–1999Link, Google Scholar
16. Shenton M, Gerig G, McCarley R, Szekely G, Kikinis R: Amygdala-hippocampal shape differences in schizophrenia: the application of 3D shape models to volumetric MR data. Psychiatry Res 2002; 115:15–35Crossref, Medline, Google Scholar
17. Wittchen H-U, Zaudig M, Fydrich T: Strukturiertes klinisches Interview für DSM-IV: SKID [Structured Clinical Interview for DSM-IV: SCID]. Göttingen, Germany, Hogrefe, 1997Google Scholar
18. Kay SR, Fiszbein A, Opler LA: The Positive and Negative Syndrome Scale (PANSS) for schizophrenia. Schizophr Bull 1987; 13:261–276Crossref, Medline, Google Scholar
19. Schneider F, Gur RC, Gur RE, Muenz LR: Standardized mood induction with happy and sad facial expressions. Psychiatry Res 1994; 51:19–31Crossref, Medline, Google Scholar
20. Watson D, Clark LA, Tellegen A: Development and validation of brief measures of positive and negative affect: the PANAS scales. J Pers Soc Psychol 1988; 54:1063–1070Crossref, Medline, Google Scholar
21. Schneider F, Habel U, Klein M, Toni I, Zilles K, Falkai P, Shah NJ: Behavioral correlates of olfactory stimulation in non-affected brothers of schizophrenia patients, submittedGoogle Scholar
22. Schneider F, Habel U, Kessler C, Salloum JB, Posse S: Gender differences in regional cerebral activity during sadness. Hum Brain Mapp 2000; 9:226–238; correction, 2001; 13:124Google Scholar
23. Talairach J, Tournoux P: Co-Planar Stereotaxic Atlas of the Human Brain: Three-Dimensional Proportional System. Stuttgart, Germany, Georg Thieme, 1988Google Scholar
24. Schneider F, Gur RE, Harper Mozley L, Smith RJ, Mozley PD, Censits DM, Alavi A, Gur RC: Mood effects on limbic blood flow correlate with emotional self-rating: a PET study with oxygen-15 labeled water. Psychiatry Res Neuroimaging 1995; 61:265–283Crossref, Medline, Google Scholar
25. Schneider F, Grodd W, Weiss U, Klose U, Mayer KR, Nägele T, Gur RC: Functional MRI reveals left amygdala activation during emotion. Psychiatry Res 1997; 76:75–82Crossref, Medline, Google Scholar
26. Taylor SF, Liberzon I, Decker LR, Koeppe RA: A functional anatomic study of emotion in schizophrenia. Schizophr Res 2002; 58:159–172Crossref, Medline, Google Scholar
27. Aalto S, Naatanen P, Wallius E, Metsahonkala L, Stenman H, Niem PM, Karlsson H: Neuroanatomical substrata of amusement and sadness: a PET activation study using film stimuli. Neuroreport 2002; 13:67–73Crossref, Medline, Google Scholar
28. Lane RD, Reiman EM, Ahern GL, Schwartz GE, Davidson RJ: Neuroanatomical correlates of happiness, sadness, and disgust. Am J Psychiatry 1997; 154:926–933Link, Google Scholar
29. Carmichael ST, Price JL: Limbic connections of the orbital and medial prefrontal cortex in macaque monkeys. J Comp Neurol 1995; 363:615–641Crossref, Medline, Google Scholar
30. Moll J, Oliveira-Souza R, Eslinger PJ, Bramati IE, Mourao-Miranda J, Andreiuolo PA, Pessoa L: The neural correlates of moral sensitivity: a functional magnetic resonance imaging investigation of basic and moral emotions. J Neurosci 2002; 22:2730–2736Crossref, Medline, Google Scholar
31. Moll J, Eslinger PJ, Oliveira-Souza R: Frontopolar and anterior temporal cortex activation in a moral judgment task: preliminary functional MRI results in normal subjects. Arq Neuropsiquiatr 2001; 59:657–664Crossref, Medline, Google Scholar
32. Narumoto J, Okada T, Sadato N, Fukui K, Yonekura Y: Attention to emotion modulates fMRI activity in human right superior temporal sulcus. Brain Res Cogn Brain Res 2001; 12:225–231Crossref, Medline, Google Scholar
33. Paradiso S, Johnson DL, Andreasen NC, O’Leary DS, Watkins GL, Boles Ponto LL, Hichwa RD: Cerebral blood flow changes associated with attribution of emotional valence to pleasant, unpleasant, and neutral visual stimuli in a PET study of normal subjects. Am J Psychiatry 1999; 156:1618–1629Link, Google Scholar
34. Teasdale JD, Howard RJ, Cox SG, Ha Y, Brammer MJ, Williams SCR, Checkley SA: Functional MRI study of the cognitive generation of affect. Am J Psychiatry 1999; 156:209–215Abstract, Google Scholar
35. Zysset S, Huber O, Ferstl E, von Cramon DY: The anterior frontomedian cortex and evaluative judgment: an fMRI study. Neuroimage 2002; 15:983–991Crossref, Medline, Google Scholar
36. Andreasen NC, O’Leary DS, Cizadlo T, Arndt S, Rezai K, Watkins GL, Boles Ponto LL, Hichwa RD: Remembering the past: two facets of episodic memory explored with positron emission tomography. Am J Psychiatry 1995; 152:1576–1585Link, Google Scholar
37. Perlstein WM, Carter CS, Noll DC, Cohen JD: Relation of prefrontal cortex dysfunction to working memory and symptoms in schizophrenia. Am J Psychiatry 2001; 158:1105–1113Link, Google Scholar
38. Braus DF, Weber-Fahr W, Tost H, Ruf M, Henn FA: Sensory information processing in neuroleptic-naive first-episode schizophrenic patients: a functional magnetic resonance imaging study. Arch Gen Psychiatry 2002; 59:696–701Crossref, Medline, Google Scholar
39. Lawrie SM, Whalley H, Kestelman JN, Abukmeil SS, Byrne M, Hodges A, Rimmington JE, Best JJK, Owens DGC, Johnstone EC: Magnetic resonance imaging of brain in people at high risk of developing schizophrenia. Lancet 1999; 353:30–33Crossref, Medline, Google Scholar
40. Shenton ME, Dickey CC, Frumin M, McCarley RW: A review of MRI findings in schizophrenia. Schizophr Res 2001; 49:1–52Crossref, Medline, Google Scholar