Revising and Assessing Axis II, Part I: Developing a Clinically and Empirically Valid Assessment Method
Abstract
OBJECTIVE: Personality pathology is difficult to measure. Current instruments have problems with validity and rely on a direct-question format that may be inappropriate for the assessment of personality. In addition, they are designed specifically to address current DSM-IV categories and criteria, which limits their utility in making meaningful revisions of those criteria. These problems suggest the need for consideration of alternative approaches to assessing and revising axis II. METHOD: This article describes the development and validation of an assessment tool designed to allow clinicians to provide detailed, clinically rich personality descriptions in a systematic and quantifiable form (the Shedler-Westen Assessment Procedure, or SWAP-200). A total of 797 randomly selected psychiatrists and psychologists used the SWAP-200 to describe either an actual patient or a hypothetical, prototypical patient with one of 14 personality disorders (one of the 10 DSM-IV axis II disorders or one of four disorders included in the appendix or in DSM-III-R) or a healthy, high-functioning patient. RESULTS: The data yielded aggregated descriptions of actual patients in each diagnostic category (N=530) as well as aggregated descriptions of hypothetical, prototypical patients (N=267). SWAP-200 descriptions of patients with personality disorders showed high convergent and discriminant validity on a variety of criteria. The diagnostic procedure lends itself to both categorical and dimensional personality disorder diagnoses. Descriptions of individual patients resemble MMPI profiles, based on the degree of match between the patient’s profile and a criterion group, except that they are based on clinician observation rather than self-report. CONCLUSIONS: The SWAP-200 represents an approach to the measurement and classification of personality disorders that has potential for refining axis II categories and criteria empirically in ways that are both psychometrically and clinically sound.
Since its inception, the system for classifying personality disorders in axis II has undergone important changes based on research, but it remains clinically and empirically problematic (1). Some of the major problems include the following:
1. The categories and criteria are not empirically based and often disagree with empirical findings from cluster and factor analyses (2–6).
2. Comorbidity of axis II disorders is too high; a patient who receives one personality disorder diagnosis often receives four to six out of a possible 10 (6–8), suggesting a lack of discriminant validity of the constructs, assessment instruments, or both.
3. It artificially dichotomizes continuous variables (the diagnostic criteria) into present/absent, which is neither theoretically nor statistically sensible.
4. It lacks the capacity to weight criteria that differ in their diagnostic importance (9).
5. It fails to consider personality strengths, which might rule out personality disorder diagnoses for some patients. For example, differentiating between a patient with narcissistic personality disorder and a much healthier patient with prominent narcissistic dynamics may not be a matter of counting symptoms but of noting the extent to which the patient has positive qualities that contraindicate a narcissistic diagnosis, such as the capacity to love, experience genuine empathy, elicit affection from others, and sustain meaningful friendships.
6. It fails to address the range of personality pathology found in patients who seek treatment but do not fall within the 10 personality disorder categories now included in axis II (10, 11). Patients often seek treatment because of recurring dysfunctional relationships, pervasive inhibitions, enduring problems of self-esteem regulation, and so forth, but many such problems cannot now be diagnosed on either axis I or axis II. In a recent study (11) Westen and Arkowitz-Westen collected data from a random national sample of experienced psychiatrists and psychologists on 714 nonpsychotic patients who they currently treat for personality pathology, defined as enduring, maladaptive patterns of emotion, thought, motivation, or behavior that lead to distress or dysfunction. Only 39.4% of these patients were diagnosable on axis II, and this percentage remained relatively stable regardless of the clinician’s theoretical orientation or the patient’s axis I diagnosis.
7. Axis II commits arbitrarily to a categorical approach to personality and personality diagnosis. It may be more useful to conceptualize borderline pathology, for example, on a continuum ranging from none through moderate to severe, rather than classifying borderline personality disorder as present or absent. Alternatively, categorical and dimensional approaches may be complementary, or each may be appropriate under certain circumstances (12).
8. The categories and criteria are not as clinically useful as they might be. For example, knowing whether a person has avoidant personality disorder or dependent personality disorder tells us little about which treatments to use, which personality processes to target for treatment, and so on.
9. The instruments that assess personality disorders do not meet criteria for validity that are normally expected in personality research (13), and they show poor test-retest reliability at intervals greater than 6 weeks (14, 15). The lack of test-retest reliability is troubling given that personality disorders are, by definition, enduring and stable over time.
PROBLEMS WITH CURRENT ASSESSMENT INSTRUMENTS
As many, including members of the DSM-IV task force, have argued, these and other problems suggest that axis II requires considerable revision, and the work groups charged with this task have taken considerable steps over the last two decades to do so. However, the task of refining axis II constructs, categories, and diagnostic criteria has been made more difficult by problems with the instruments designed to assess them. Validity coefficients tend to be very weak by psychometric standards (13). For example, Skodol et al. (16) found only marginal associations among diagnoses made by two of the major axis II instruments and the LEAD (longitudinal expert evaluation using all available data) standard (17). Perry (13) found that the average kappa coefficient (an index of agreement [18]) between any two instruments was only 0.25, a value that would be unacceptable in any other area of psychological research. Validity data are particularly weak for self-report measures (19).
The relatively weak validity of instruments to assess personality disorders no doubt has multiple causes. One possibility is that the measures do not work well because DSM-IV itself does not categorize disorders optimally. No instrument can effectively measure categories that do not exist in nature. Another, and we believe equally important, explanation is that the instruments have inadvertently diverged too far from clinical diagnostic practice. All existing instruments—whether self-report questionnaires or structured interviews—rely heavily on direct questions derived from axis II criteria, a method modeled after axis I instruments. This method may not, however, be appropriate for making axis II diagnoses. Asking a patient who presents with depression, “Has your weight changed?” or “Do you have thoughts of killing yourself?” is common and essential in clinical practice. It is a different matter to ask patients with personality disorders to report on their personalities, especially when lack of insight and self-understanding is characteristic of many personality disorders. For example, one widely used instrument (20) asks, “Have you ever been told that you seemed like a shallow or superficial kind of person?” to assess histrionic personality disorder; another (21) asks, “Do you feel that your situation is so special that you require preferential treatment?” to assess narcissistic personality disorder.
In fact, practicing clinicians do not find such questions useful in diagnosing personality pathology. Westen (10) surveyed a national probability sample of over 1,800 experienced psychiatrists and psychologists and asked them to rate the extent to which they rely on various methods to diagnose personality disorders. Among the methods rated were 1) asking patients direct questions derived from axis II criteria (as current research instruments do), 2) listening to patients’ narratives about their lives and relationships and drawing inferences about repeating patterns, and 3) observing patients’ behavior toward them in the consulting room. The clinicians rated each method on a 7-point scale (1=“I rely on it very much,” 7=“I rely on it very little”). The results made clear that clinicians rely primarily on inferences they draw from patients’ narrative descriptions of their lives and relationships (mean=1.4) and from patients’ behavior toward the interviewer in the consulting room (mean=1.5). Clinicians find direct questions derived from axis II criteria of limited value in making axis II diagnoses (mean=5.0), although they do rely on such questions to make axis I diagnoses. Thus, axis I instruments mirror clinical procedure, but axis II instruments do not. This pattern of findings emerged regardless of clinicians’ theoretical orientation.
Does this divergence from clinical practice matter? We believe it does. Given that the most obvious way to assess a disorder is to ask the person if he or she has the symptoms, it is striking that clinicians of all theoretical orientations avoid this method. The reason is straightforward: Although some symptoms of personality disorders (e.g., self-cutting in a borderline patient) can and should be inquired about directly, others are best assessed through a functional analysis of personality (11, 22). Such a functional approach is familiar, for example, in the context of a mental status examination. We do not assess intelligence by asking people, “If you were to be asked the meanings of some words, how well would you do?” Rather, we ask them the meanings of words. The same is true of assessing thought disorder in patients who lack insight. We do not ask, “How would you do on a test of proverbs?” Rather, we ask them the meaning of some proverbs and make judgments about their ability to go to the appropriate level of abstraction. Clinicians report doing the same in assessing personality: If they want to know if a patient lacks empathy, they do not ask the person if he or she lacks empathy. Rather, they listen to the way the person describes interactions with significant others, they observe how he or she responds in the room with the interviewer, and they draw their own conclusions.
Personality disorder instruments were once more clinically grounded. The Diagnostic Interview for Borderline Patients (23) was a 90-minute interview that involved considerable clinical probing. However, the problem of comorbidity of axis II disorders led researchers to search for ways to assess all personality disorders at one time; otherwise, a study of borderline personality disorder might include, for example, a substantial number of schizotypal patients in the borderline sample. An unintended byproduct of this effort toward comprehensive assessment was that the method shifted from a clinically sound one, encompassing a mixture of some direct questions and many indirect probes about relationships, stressful encounters, and so on, to what has evolved toward an interviewer-administered self-report questionnaire. This is particularly true of the latest instruments, such as the Structured Clinical Interview for DSM-III-R Personality Disorders (21), which attempts to assess all personality disorders in 30 minutes after the patient has first completed a questionnaire. (That constitutes less than 30 seconds to assess each of the more than 70 diagnostic criteria in axis II.)
Beyond the divergence from clinical methods, several lines of evidence suggest a priori that assessing personality processes with direct questions is not an optimal strategy, particularly in patients with personality disorders for whom lack of self-knowledge and perspective-taking ability is diagnostic (24). Recent research documents a crucial distinction between explicit (consciously accessible) and implicit (consciously inaccessible) processes in the realms of memory, cognition, and affect. For example, memory researchers distinguish between explicit memory, which refers to conscious memory for facts and events, and implicit memory, which is not consciously accessible but is expressed through behavior (through associations or demonstration of skills, such as playing a complex piece on the piano) (25). A considerable array of psychological and neurophysiological studies suggests that the same distinction holds for affective and motivational processes (26). In short, what we can observe and infer about personality may be very different from what a patient can describe to us.
Further, many studies document the distorting effects of psychological defenses on self-report data, especially when people are asked questions that have implications for self-esteem. For example, findings have been reported in several independent literatures that measures related to psychological defensiveness (e.g., repressive coping style, attachment style) predict discrepancies between self-reported anxiety and objective physiological measures of anxiety (27–29). Shedler and colleagues (28) found that subjects who report psychological health, but whose descriptions of childhood memories reveal conflict and unconscious distress, show a pattern of physiological reactivity predictive of heart disease.
THE PRESENT STUDY
The problems in conceptualizing and measuring personality disorders are formidable. Studies of personality disorders over the past 15 years have made considerable strides in increasing our understanding of the course and etiology of some personality disorders, particularly borderline and antisocial personality disorder (1). The problems described earlier in this article, however, suggest that we should continue to search for alternative methods of assessment. Further, as Livesley (1) has argued, one of the greatest impediments to increasing knowledge about personality disorders is that current research efforts largely assume the validity of the current nosology, rather than systematically testing alternatives.
This article is the first of a two-part study designed to test the adequacy of a more clinically near method of assessing personality disorders. The method may be useful not only for assessment and diagnosis but for revision of axis II categories and criteria. The study relies on the Shedler-Westen Assessment Procedure-200 (SWAP-200), which is an implementation of the “Q-Sort” method of personality assessment (described later). The SWAP-200 includes not only items (diagnostic criteria) that reflect the diagnostic criteria in axis II but also a substantial number of descriptors of personality derived from the literature on personality and personality disorders, from the clinical observation of hundreds of clinicians, and from pilot studies designed to maximize its comprehensiveness. We report on a sample of 797 patients with personality disorders who were described by a random national sample of experienced psychiatrists and psychologists through use of the SWAP-200 assessment procedure. This first article describes the development of the method, the reasons we believe it might prove useful, and initial evidence for its validity. Part II represents a step toward refining axis II categories and criteria empirically. It describes an alternative, empirically derived taxonomy of personality disorders based on cluster analysis, a set of statistical procedures that can identify naturally occurring clusters or groups of patients on the basis of their similarity.
DEVELOPMENT OF THE SWAP-200
The Q-sort method is one of the most empirically successfully methods employed by personality researchers in the study of normal personality (30–35). Researchers using the Q-sort method in longitudinal studies have been able, for example, to predict patterns of personality and drug use in late adolescence prospectively from data collected in preschool (35). Despite the demonstrated value of the Q-sort method, it has rarely been extended to the study of personality disorders. Because the results of this study hinge on the Q-sort method and on the SWAP-200 more specifically, we will describe both in some detail.
What Is a Q-Sort?
A Q-sort, in the context of personality disorders, is a set of statements that describe different aspects of personality and psychological functioning. Each statement may describe a given patient well, somewhat, or not at all. The statements are printed on separate index cards. A clinician or interviewer with a thorough knowledge of the patient arranges (sorts) the cards into categories, on the basis of the degree to which the statements describe the patient, from those that are inapplicable or not descriptive to those that are highly descriptive. Thus, a Q-sort relies on the judgments of a clinician-observer, not on the self-reports of the patient.
The SWAP-200 is an assessment instrument that uses the Q-sort method. The SWAP-200 contains 200 personality-descriptive statements, which clinicians must sort into eight categories. The first category, which is assigned a value of 0 for data analytic purposes, contains statements that the clinician judges irrelevant or inapplicable to the patient. The last category, which is assigned a value of 7, contains statements that are highly descriptive of the patient. Intermediate categories contain statements that apply to varying degrees. Thus, the SWAP-200 provides a numerical score ranging from 0 to 7 for each of 200 personality-descriptive statements or items. The statements provide a standard vocabulary with which clinicians can express their observations and inferences.
Use of this standard vocabulary allows clinicians to provide psychological descriptions of patients in a form that can be quantified, compared with descriptions provided by other clinicians, and analyzed statistically. SWAP-200 statements are written in a manner close to the data (e.g., “Tends to be passive and unassertive” or “Living arrangements are chaotic and unstable”), and statements that require inference about internal processes are written in clear and unambiguous language (e.g., “Is unable to describe important others in a way that conveys a sense of who they are as people; descriptions lack fullness and color” or “Tends to blame others for own failures or shortcomings; tends to believe his/her problems are caused by external factors”). Writing items in this way minimizes idiosyncratic and unreliable interpretive leaps. This is similar to the efforts of the axis II work groups, who have been progressively refining diagnostic criteria so that they are closer to the data. The items in the SWAP-200 differ from axis II criteria, however, in two major respects. First, we have attempted to operationalize subtle psychological constructs, such as defensive processes, that the framers of axis II excluded because of their concern that such processes could not be measured reliably. Second, we have expanded the range of items considerably, to capture aspects of functioning of potential clinical importance that axis II does not address (such as motives, conflicts among motives, affect regulation strategies, aspects of personality pathology not severe enough to warrant current axis II diagnoses, and areas of healthy or adaptive functioning) (see also references 3 and 36).
The Q-sort method requires that clinicians assign a specified number of statements to each category. In the SWAP-200, for example, clinicians must place exactly eight items in category 7 (the most descriptive items), exactly 10 items in category 6 (next most descriptive), and so on. In other words, the clinician does not have discretion about how many items to put in each category. In psychometric terms, the clinician must arrange the SWAP-200 items into a fixed distribution. Use of a fixed distribution has important psychometric advantages over standard rating procedures. Although this requirement increases the time required of the clinician (since he or she must count the statements in each category and rearrange them to obtain the correct numbers), the psychometric advantages far outweigh the inconvenience. Completing a SWAP-200 description of a patient takes approximately 45 minutes.
Advantages of a Fixed Distribution
A detailed discussion of the psychometric advantages of a fixed distribution is beyond the scope of this paper (see reference 31 for a detailed discussion), but one important advantage is that it minimizes measurement error. Consider the situation with rating scales, where raters can use any value as often as they wish. Invariably, certain raters will tend toward extreme values (e.g., values of 1 and 7 on a 1–7 rating scale), and certain raters will tend toward middle values. Thus, some differences in ratings are due to the style or “calibration” of the rater, not to real differences between the patients being rated. The Q-sort method, with its fixed distribution, eliminates this kind of measurement error, since all clinicians must use each value the same number of times. If the use of a standard item set provides clinicians with a common vocabulary, the use of fixed distribution can be said to give them a shared grammar (31). Thus, when any clinician places an item in category 7, the meaning is exactly the same: This is one of the eight items out of the 200 in the item set that is most defining of this patient’s personality (because category 7 includes only eight items).
We went to considerable trouble to ensure that the fixed distribution we imposed on clinicians was appropriate for describing a wide range of patients and was not just an arbitrary constraint. We 1) included a broad range of items in the SWAP-200, including items that assess psychological strengths, to ensure there would always be enough items that truly belong in the higher (most descriptive) categories, regardless of the patient’s degree of disturbance; 2) investigated how clinicians used the SWAP-200 items when we did not impose a fixed distribution, to determine the distribution clinicians used naturally; and 3) adjusted the distribution repeatedly, on the basis of experience from videotaped interviews of a wide range of patients (from relatively healthy to relatively disturbed), so that it would be appropriate across the spectrum of personality pathology.
The fixed distribution of SWAP-200 items resembles the right half of a normal distribution (i.e., bell-shaped curve): Many items receive values of 0, 1, and 2 (i.e., not descriptive), but only a few receive values of 7 (i.e., highly descriptive). We chose this distribution because 1) we are measuring primarily abnormal traits, which by definition are not present in most people most of the time; 2) this is the distribution that, in fact, emerges with most measures of psychopathology, such as the Beck Depression Inventory (on which most people have scores of 0 and progressively fewer have higher scores); and 3) this distribution closely matched the average distribution that clinicians used naturally, when we did not impose a fixed distribution.
Development of the SWAP-200 Item Set
The value of a Q-sort depends entirely on the clarity, comprehensiveness, and relevance of the statements it contains. An initial draft of the item set was written by the second author and the item set was revised, refined, and expanded by both authors over a period of 7 years (37). The final item set incorporates constructs from a mixture of sources: DSM-III-R and DSM-IV axis II criteria; selected axis I items that could reflect personality pathology (e.g., depression and anxiety); clinical literature on personality disorders written over the past 50 years (e.g., references 38–40); research on coping and defense mechanisms (28, 41–43); research on interpersonal pathology in patients with personality disorders (44, >45); research on normal personality traits and psychological health (31, 46, 47); research on the psychological characteristics of personality disorders conducted since the development of axis II (see reference 1); extensive pilot interviews in which observers watched videotaped interviews of patients with personality disorders and tried to describe them by using the Q-sort procedure; and the clinical experience of the authors.
Most important, the SWAP-200 items reflect the feedback of several hundred clinicians who used the instrument to describe their patients. Each time a clinician used the instrument, we asked one critical question: “Were you able to describe the things you consider most psychologically important about this patient?” We added, edited, rewrote, and revised the items until nearly all of the clinicians could answer “yes” nearly all of the time. We also revised, combined, or deleted items that were redundant or not diagnostic, on the basis of the results of item analysis.
What Can Be Done With Q-Sort Data?
Creating composite descriptions
The Q-sort method allows researchers to combine descriptions of different patients, to obtain a composite personality description of a particular type of patient. This is accomplished by averaging the values assigned to each SWAP-200 item across a number of patients. For example, if a number of experienced clinicians provide SWAP-200 descriptions of a hypothetical, prototypical patient with histrionic personality disorder, we can average the values they assign to the SWAP-200 items to obtain a composite description of the prototypical histrionic patient.
A fortunate statistical consequence of averaging is that only items ranked highly (given high scores) by all clinicians will have high ranking in the composite description. If clinical consensus about the importance of an item is lacking, the item will not achieve a high ranking in the composite description. Thus, by listing the SWAP-200 items with the highest values in the composite description of the hypothetical, prototypical histrionic patient, we obtain a listing of the psychological features that virtually all clinicians consider important to the diagnosis. The composite description can be said to reflect the core consensual understanding of the clinicians.
Similarly, if we create a composite description of a group of actual histrionic patients, only SWAP-200 items ranked highly for all patients will have a high ranking in the composite description. Thus, an examination of the highest-ranking items from the composite description will reveal the important psychological features that actual histrionic patients have in common. This represents a purely empirical procedure for determining the defining characteristics of histrionic patients.
Terminology
When we create a composite personality description of hypothetical, prototypical patients with a given personality disorder (i.e., hypothetical patients who illustrate the diagnostic category in its purest form), we will refer to that composite as a diagnostic prototype. We will create a diagnostic prototype for each personality disorder and refer, for example, to the borderline diagnostic prototype or the histrionic diagnostic prototype. The diagnostic prototype is a richly detailed description of the personality disorder that reflects the clinical and theoretical understanding of many practicing clinicians.
When we create a composite personality description of actual patients in a given diagnostic category, we will refer to that composite as a composite description. We will create a composite description for each personality disorder and refer, for example, to the borderline composite description or the histrionic composite description. The composite description is a richly detailed description of actual patients with the personality disorder. It is important to keep these terms in mind while reading the remainder of this article because we will use them extensively in the sections that follow.
How similar are the patients who make up a composite?
The degree of similarity or overlap in the SWAP-200 descriptions of any two patients is measured by the familiar correlation coefficient. (A SWAP-200 description of a patient is one column by 200 rows of data, where row 1 contains the value given to SWAP-200 item 1, row 2 contains the value given to SWAP-200 item 2, and so on; with descriptions of two patients, the two columns of data can be correlated.) The degree of similarity among three or more patients is measured by coefficient alpha (48), which reflects the correlations among all possible pairs of SWAP-200 descriptions. Thus, coefficient alpha is an index of the similarity (internal consistency) of the individual SWAP-200 descriptions that make up a diagnostic prototype (average description across hypothetical, prototypical patients) or a composite description (average description across actual patients). When alpha is high, the personality descriptions are very similar; when alpha is low, the personality descriptions have little in common.
Thus, it becomes possible to ask, for example, to what extent clinicians who describe hypothetical, prototypical patients with borderline personality disorder agree about the features that constitute the diagnosis. This is an important question, given the debate about whether borderline personality disorder is a distinct and meaningful diagnosis at all. If coefficient alpha for the diagnostic prototype is low, this would indicate that different clinicians use the diagnostic term differently, with poor agreement about what constitutes borderline personality disorder. If coefficient alpha is high, this would indicate that there is good agreement among clinicians about the defining features of borderline personality disorder.
With composite descriptions of actual patients, coefficient alpha measures the degree of similarity among the patients. For example, a high alpha coefficient for a composite description of actual patients diagnosed with borderline personality disorder would indicate that the patients have important features in common and therefore represent a coherent diagnostic group. Conversely, a low alpha coefficient would suggest that the patients do not share important psychological characteristics and that borderline personality disorder is a “catch-all” diagnostic category, as some have claimed, made up of patients with little in common. Thus, the Q-sort method may help address some of the debates in the literature about whether certain diagnoses do or do not reflect “real” syndromes. (Coefficient alpha is most often used as a measure of internal consistency of the items making up a test, such as an IQ test. The measure indicates the extent to which differences in test scores reflect true differences versus measurement error; thus, if alpha=0.95, 95% of the variation in IQ scores is due to true differences in intelligence, and 5% is due to measurement error. The same psychometric principles apply when alpha is used to assess consistency across multiple observers. In this context, it provides a measure of the extent to which differences between patients’ SWAP-200 descriptions reflect true differences in their personalities, rather than measurement error attributed to idiosyncrasies of the rater.)
An Alternative Approach to Diagnostic Assessment
When we ask clinicians to describe hypothetical, prototypical patients who illustrate a given diagnostic category in its purest form and average those descriptions together, the resulting diagnostic prototype reflects the core consensual understanding of the clinicians concerning the diagnostic category. This diagnostic prototype can then serve as a template for the personality disorder, and we can compare individual patients to this template to see how well they match. The degree of similarity or match is measured by the familiar correlation coefficient. We will refer to a correlation between an individual patient’s SWAP-200 description and a diagnostic prototype as a personality disorder score. Thus, we can compute 15 personality disorder scores, one for each diagnostic prototype (10 disorders currently in axis II, four disorders in the appendix or in the previous version of DSM, plus a prototype for healthy, high-functioning patients). The personality disorder scores tell us how closely a patient matches the diagnostic prototype for each personality disorder. This assessment method has been used effectively in personality research (33) but has rarely been applied to personality disorders.
This strategy represents an approach to psychiatric diagnosis that is fundamentally different from the current approach. Instead of asking clinicians or research assistants to make final personality disorder diagnoses, which are often unreliable, the SWAP procedure quantifies the clinician’s behavioral observations and clinical inferences, and the personality disorder score assesses the match between the clinician’s observations and any diagnostic prototype. Thus, diagnosis can be reported dimensionally, since the match between a patient’s profile and a given diagnostic prototype may range from none through moderate to high.
Recent evidence suggests that clinicians can, in fact, make behavioral observations and clinical inferences reliably using the SWAP-200. To assess interrater reliability of clinicians’ behavioral observations and inferences, we conducted a pilot reliability study in which clinicians conducted or observed a videotaped personality diagnostic interview resembling an initial three-session intake process. In this study (37), interrater reliability was r=0.75; in our most recent series of pilot subjects, reliability increased to r=0.81. (When Q-sort assessments are made by interview, the average of two independent judges’ assessments is used to achieve acceptable levels of interrater reliability because the interview requires substantial inference and does not provide the kind of yes/no answers frequently offered by patients in current axis II interviews.)
In addition to gauging the match between a patient and a diagnostic prototype or template, the SWAP-200 also can provide a narrative description of a patient’s most salient diagnostic features. We can rank order the SWAP-200 items for a given patient, from those assigned the highest values to those assigned the lowest, and read off the items with the highest values to obtain the narrative description. This can be useful for writing a case formulation of the patient, because it allows the clinician to anchor clinical, narrative descriptions with reliable SWAP-200 items that have clear, consensually understood meanings. We will provide an example of this approach in part II. Because of its ability to provide both quantitative and narrative data, the Q-sort method has potential for helping bridge the gap that too often exists between research and clinical perspectives.
Identifying Natural Groupings of Patients
The most important task in developing a meaningful classification system for personality disorders (or any classification system) is identifying naturally occurring groupings, i.e., patients who share important psychological features. One set of statistical procedures designed to accomplish this is known as “Q-analysis.” Q-analysis originally found application among biologists conducting taxonomic research, to help classify species. It has also been applied successfully to the study of normal human personality (30–35) but not yet to the study of personality disorders. Q-analysis groups patients into clusters of patients who are similar to each other and dissimilar to patients in other clusters. Thus, the method holds promise for identifying and refining diagnostic categories on the basis of hard empirical findings rather than relying primarily on intuitive judgments and committee decisions. Part II of this two-part series uses the SWAP-200 data for this purpose.
METHOD
Subjects
Subjects were experienced psychologists and psychiatrists obtained from a random national sample. To obtain the sample of clinicians, we contacted 3,000 psychiatrists from the register of the American Psychiatric Association who indicated an interest in personality disorders and 4,000 psychologists from the American Psychological Association, selected from the three primary divisions that draw clinicians (the divisions of clinical psychology, psychotherapy, and psychoanalysis). For both psychiatrists and psychologists, the selection procedure included a computer search to exclude clinicians with less than 3 years’ practice after training/licensure. The clinicians were asked if they might be willing to participate in a project that would require approximately an hour of their time.
Over 2,400 clinicians responded, for a return rate of approximately 33%. Roughly one-third of the respondents were psychiatrists and two-thirds were psychologists. The clinicians tended to have multiple institutional affiliations: 31% worked in hospitals at least part-time, 20% worked in clinics, 82% had private practices, and 11% worked in forensic settings. Of the 2,400 who expressed an interest, approximately 800 returned the materials; 797 provided relatively complete data. This percent response rate does not appear to reflect any form of selection bias due to experience, theoretical orientation, and so on, but appears to reflect the fact that the clinicians were not paid; in a similar, funded study in which we could pay participating clinicians an honorarium, we obtained a response rate greater than 70%.
Procedure
We focused in this study on current and recent DSM axis II diagnoses. We included not only the 10 personality disorder diagnoses included in DSM-IV but also diagnoses that were included in DSM-III-R and subsequently dropped, as well as diagnoses included in the appendices to DSM-III-R and DSM-IV (depressive, passive-aggressive, self-defeating, and sadistic personality disorders). Because these diagnoses have been the topic of debate, our intent was to cover the broadest sweep of patients with personality disorders. As an initial research step, we surveyed all participating clinicians to determine which diagnostic categories of patients they were currently treating (by providing a list of all personality disorders and asking clinicians to indicate the diagnoses of patients they currently had in treatment). On the basis of their responses, we asked two-thirds of the clinicians to use the SWAP-200 to describe a current, actual patient from a specific diagnostic category. We asked the other one-third to use the SWAP-200 to describe a hypothetical, prototypical patient from a specific diagnostic category, following the instructions below (with antisocial personality disorder used here as an example):
We are asking you to use the SWAP-200 to describe a hypothetical patient with an antisocial personality disorder. We do not want you to describe a real patient. Rather, we are interested in learning what the term “antisocial personality disorder” connotes for you. We would like you to describe a prototypical antisocial patient, a hypothetical person who illustrates antisocial personality disorder in its purest form.
In addition to asking for descriptions of patients with personality disorders, we asked for descriptions of healthy, high-functioning patients (both hypothetical, prototypical patients and actual patients) without personality disorders. Each clinician was asked for a description of only one type of patient.
We solicited twice as many SWAP-200 descriptions of actual patients as of hypothetical, prototypical patients because we were more interested in data on actual patients and because prior research found high agreement among clinicians in their descriptions of prototypical patients (37). Because of the high agreement concerning prototypical patients, we could obtain statistically reliable and stable descriptions of personality disorders by compositing the descriptions of as few as 15 hypothetical, prototypical personality disorder patients (with alpha coefficients in the 0.90s, indicating high internal consistency or reliability). To ensure an adequate number of patients in diagnostic categories that were underrepresented because of low frequency, we contacted an additional 200 clinicians by using the same procedure to target categories in which we had obtained too few patients.
The procedure yielded data on 530 actual and 267 prototypical patients. In addition to data from the SWAP-200, we asked clinicians to complete a form that asked them for demographic information about themselves and the patient, developmental and genetic history data as best they could provide it, Global Assessment of Functioning Scale rating, and up to three axis I diagnoses for the patient. In addition, we provided the clinicians with a list of all personality disorders and had them rate the extent to which the patient met criteria for each disorder, on a 1–7 rating scale (1=not at all, 4=has some features, 7=fully meets criteria).
Statistical Analyses
The aim of this investigation was to assess the validity of the SWAP-200 as a method for assessing personality disorders. We did so in three ways. First, we examined whether actual patients with a personality disorder diagnosis resembled the diagnostic prototype for that personality disorder. The diagnostic prototype is essentially a prediction made by other clinicians about what characteristics should be observed in patients with a given personality disorder. A high correlation between the composite description of actual patients with a personality disorder and the diagnostic prototype for that personality disorder shows convergent validity; lower correlations between the composite description and diagnostic prototypes for unrelated personality disorders show discriminant validity.
The second way of assessing validity looked at the relations between personality disorder scores and clinicians’ 7-point ratings of the extent to which patients met diagnostic criteria for each personality disorder, independent of the clinician’s categorical diagnosis of the patient. Recall that a personality disorder score is a correlation between a patient’s SWAP-200 description and a diagnostic prototype, indicating the degree of match. Thus, a patient might receive a score of 0.54 for borderline personality disorder, –0.23 for schizoid personality disorder, 0.09 for paranoid personality disorder, and so on, on the basis of the match between the patient’s SWAP-200 description and the diagnostic prototypes provided by independent clinicians. If the SWAP-200 is a valid assessment tool, personality disorder scores and clinicians’ ratings for the same personality disorder should correlate highly (convergent validity), and personality disorder scores and clinicians’ ratings for different diagnoses should not correlate highly (discriminant validity).
A third way of examining validity sets aside diagnosis and focuses instead on the ability of the SWAP-200 to predict patients’ general level of functioning, as measured by the Global Assessment of Functioning Scale. Thus, we computed a personality disorder score to gauge the match between each patient’s SWAP-200 description and the diagnostic prototype for healthy, high-functioning patients (the terminology is somewhat awkward here, since “healthy, high-functioning” is not a diagnosis). We then examined the correlation between the healthy, high-functioning personality disorder score and Global Assessment of Functioning Scale. A high correlation would provide additional evidence for the validity of the SWAP-200 as an assessment tool, independent of clinician diagnosis.
RESULTS
Characteristics of Participating Clinicians
A total of 797 clinicians (63.6% men and 36.4% women) participated; 32.2% were psychiatrists and 67.8% were psychologists. The clinicians were, on average, highly experienced: The average number of years since residency/licensure was 18.14 (SD=9.80). Nearly half (48.6%) reported a primary psychodynamic orientation, 29.4% eclectic, 14.4% cognitive behavior, 4.8% biological, and 2.0% systemic. The relatively high percentage of psychodynamic clinicians in the group reflects the fact that 1) most psychiatrists who expressed an interest in personality disorders (a selection criterion) tended to lean toward psychodynamic approaches, and 2) we sampled from three divisions of the American Psychological Association, each of which includes psychodynamic practitioners (the divisions of psychotherapy, clinical psychology, and psychoanalysis). In prior research, we did not find substantial differences in the ways practitioners with different theoretical orientations used the SWAP-200 instrument (37).
Characteristics of Patients
Patient age averaged 40.9 years (SD=11.6); 53.1% of the patients were women. Sex ratios for specific disorders were largely as expected on the basis of ratios reported in DSM-IV (e.g., 93.1% of antisocial patients were men, whereas 92.7% of borderline patients were women), although some disorders were split more evenly than expected (e.g., of sadistic personality disorder patients, 36.8% were women; of narcissistic, 36.1% were women; and of paranoid, 46.9% were women). Of the healthy, high-functioning patients, 75% were women. The sample was 93.8% Caucasian; 37.9% were described as working class, 45.0% as middle class, and the remaining 12.1% as split between poor and upper class. The group was roughly evenly divided between patients who had graduated from high school, attended but not completed college, completed college, and attended graduate school (22%–26% in each category). The patients were well known to the reporting clinicians and had been seen in treatment an average of 33.95 sessions before the SWAP-200 assessment (SD=36.14, median and mode=24).
Reliability of Diagnostic Prototypes and Composite Descriptions
The total group included 530 actual patients and 237 hypothetical, prototypical patients. By averaging or compositing hypothetical, prototypical patients, we created 15 diagnostic prototypes (one for each of the 14 personality disorders and one for healthy, high-functioning patients). Similarly, we created 15 composite descriptions of actual patients. The number of patients included in the diagnostic prototypes ranged from 15 (dependent personality disorder) to 20 (narcissistic personality disorder). The number of patients included in the composite descriptions of actual patient groups ranged from 24 (schizotypal personality disorder) to 43 (borderline personality disorder), with most in the high 30s. Sadistic personality disorder was the one exception; there were only 18 patients because we had difficulty obtaining a large group of sadistic patients.
Coefficient alpha measured the extent to which patients in each diagnostic group (e.g., borderline diagnostic prototype, borderline composite description, schizoid diagnostic prototype, schizoid composite description) resembled one another. With the exception of the composite descriptions of actual sadistic patients (alpha=0.85), all alphas for both the diagnostic prototypes and the composite descriptions were ≥0.90. Since alpha=0.80 is considered high reliability, the findings suggest that both the diagnostic prototypes and composite descriptions are robust, reliable, and relatively free of measurement error.
Examples of Composite Descriptions
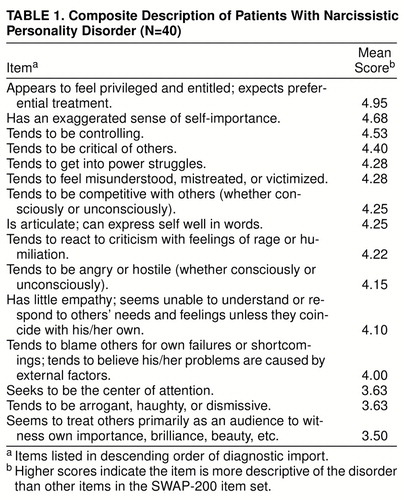
Tables 1 and 2 show the composite descriptions of actual patients who were diagnosed by their clinicians as having narcissistic personality disorder (table 1) and borderline personality disorder (table 2). The tables list the items that are most descriptive of the patients in each of these two groups in descending order of magnitude. (Recall that the score for each SWAP-200 item was obtained by averaging the values for that item across all patients included in the composite description. We thus arranged the items in descending order of diagnosticity, beginning with those items most descriptive of the average borderline or narcissistic patient.) Subsequent publications will describe the profiles of these and the other axis II disorders in more detail and compare them to current criteria and findings from other research programs.
As table 1 illustrates, the empirically derived portrait of narcissistic personality disorder is highly similar to its DSM-IV description, suggesting that the axis II work groups have, in fact, captured most of the important features of the disorder seen in clinical practice. The major difference is that narcissistic patients appear to be more controlling, more likely to get into power struggles, and more competitive than DSM-IV suggests. The narcissistic composite also includes a defense, externalization, that is missing from the DSM-IV description, and it includes a strength, namely, the tendency to be articulate.
In contrast, the empirically derived portrait of actual patients with borderline personality disorder is substantially different from its DSM-IV description. The data show that actual borderline patients are most distinguished by their intense, poorly modulated affect and, more generally, by their omnipresent dysphoria and desperate efforts to regulate it. This suggests that questions about the comorbidity of borderline personality disorder and depression may be somewhat artifactual, since intense affect states, including depression (and related interpersonal concerns such as abandonment), are, in fact, defining features of borderline personality disorder. It is interesting to note that the original name proposed for what came to be called borderline personality disorder in DSM-III was “emotional dyscontrol disorder.”
Validity: Relations Between Diagnostic Prototypes and Composite Descriptions
We tested the validity of the SWAP-200 in three ways. First, we examined the relations between the diagnostic prototypes and composite descriptions of actual patients. Evidence of convergent and discriminant validity is provided in table 3. For a measure to be valid, correlations along the diagonal of the table (which are correlations between the diagnostic prototype and composite descriptions for the same disorder—i.e., convergent validity coefficients) should be higher than correlations off the diagonal (which are correlations between the diagnostic prototype and composite descriptions for different disorders—i.e., discriminant validity coefficients). As table 3 shows, evidence for convergent and discriminant validity is strong: With the exception of self-defeating personality disorder, which has never been included in the text of axis II, the correlations (validity coefficients) along the diagonal ranged from 0.79 to 0.93, with an average correlation of 0.83. In contrast, the average correlation off the diagonal was 0.25.
Table 3 also reveals areas of diagnostic difficulty. Sadistic personality disorder (a personality disorder in the appendix to axis II) is not empirically distinct from antisocial and narcissistic personality disorders, which supports the decision of the DSM-IV task force to exclude it. In addition, schizoid, schizotypal, and avoidant personality disorders were not adequately distinct from one another. Finally, several disorders that appear to share a dysphoric core—avoidant, dependent, depressive, and self-defeating personality disorders—correlate highly with each other. These problematic discriminant validity coefficients could reflect either a lack of distinctness of the disorders themselves or an inability of the SWAP-200 to make distinctions. In part II of this series we report results of a cluster analysis (empirical classification of patients into naturally occurring groups), which suggests that by first refining the personality disorder categories and criteria to reflect more accurately the categories that occur in nature, we can substantially reduce these problems of discriminant validity.
Validity: Relations Between Personality Disorder Scores and Clinicians’ Ratings
As a second way of assessing validity, we examined the relation between SWAP-200 personality disorder scores and clinicians’ 7-point ratings of the extent to which patients met criteria for each personality disorder. (Recall that a personality disorder score indicates the degree of match between a patient’s SWAP-200 description and a diagnostic prototype.) Table 4 reports the convergent/discriminant validity matrix for this analysis. As table 4 shows, the results largely replicate those of the previous analysis. Correlations on the diagonal (convergent validity coefficients) are, on average, more than 0.50 larger than correlations off the diagonal (discriminant validity coefficients). The average correlation on the diagonal is 0.56, while the average correlation off the diagonal is 0.02.
Validity: Predicting Global Assessment of Functioning Scale Ratings
In a third analysis, we correlated each patient’s SWAP-200 profile with the diagnostic prototype for healthy, high-functioning patients in order to obtain a personality disorder score that reflects level of psychological health. The correlation between the Global Assessment of Functioning Scale and this SWAP-200-based measure of psychological health was r=0.48 (p<0.001), indicating convergence between the two health measures.
We also examined the relationship between Global Assessment of Functioning Scale and other personality disorder scores. The last column of table 4 shows these correlations. As table 4 shows, personality disorder scores have implications for level of functioning. The data suggest that the current axis II disorders might form a hierarchy of adjustment, from schizotypal, schizoid, borderline, and paranoid personality disorders at one end, to narcissistic and obsessive (two disorders that often allow patients to succeed in Western cultures, particularly the United States) at the other.
Using the SWAP-200 to Diagnose an Individual Patient
SWAP-200 personality disorder scores can be used to diagnose an individual patient and can provide both categorical and dimensional personality disorder diagnoses. The reader will recall that personality disorder scores measure the “match” between the description of an individual patient and the diagnostic prototype for a personality disorder. The higher the personality disorder score, the more closely the patient matches the description of the personality disorder.
The personality disorder scores can be graphed to create a personality disorder profile, resembling an MMPI profile, in which each point on the graph indicates the level of match between the patient and one personality disorder diagnostic prototype. For ease of interpretation, we have transformed the raw personality disorder scores (which are correlation coefficients) into T scores, which have a mean of 50 and standard deviation of 10. Thus, the average patient will have a T score of 50 for each personality disorder (50 is the reference score); the more a T score is elevated above 50, the greater the match between the patient and the diagnostic prototype. A T score of 60 means the patient’s personality disorder score is one standard deviation above average, a T score of 70 means it is two standard deviations above average, and so on. T scores are the metric used by the MMPI and many other psychological tests and are familiar to personality researchers and many clinicians.
In fact, the diagnostic procedure is very much analogous to the MMPI, since diagnosis depends on the match between a patient’s characteristics and those of a criterion group. The difference is that the SWAP-200 relies on clinician observation, not self-report. Our data indicate that a T score elevation of 60 (one standard deviation above the mean) is an appropriate cutoff for making a categorical personality disorder diagnosis using the current axis II categories, because the average patient with a personality disorder diagnosis (by the treating clinician) has a T score above 60 for that personality disorder and T scores below 60 for other personality disorders. If a patient has several personality disorder scores above 60 but one significantly higher than the others, this peak score is considered the primary diagnosis.
Figure 1 shows a personality disorder profile for a patient who was diagnosed by her psychologist with borderline personality disorder. The patient is a 32-year-old white woman from a working class family. She has a graduate education but a Global Assessment of Functioning Scale score of only 55, indicating relatively poor functioning. Examining the personality disorder score profile, we see a marked elevation in the patient’s borderline personality disorder score (T=72.15, more than two standard deviations above the reference score of 50). The score indicates a very strong match between the patient’s SWAP-200 description and the diagnostic prototype for borderline personality disorder. We also see a strong elevation in the histrionic personality disorder score (T=61.15), although not as high as for the borderline personality disorder score. Thus, the diagnosis is borderline personality disorder with histrionic features. It is also noteworthy that the patient’s healthy, high-functioning personality disorder T score of 39.27 is a full standard deviation below the mean, indicating relatively poor functioning (consistent with her low score on the Global Assessment of Functioning Scale).
DISCUSSION
Summary of Findings
The findings provide support for the validity of the SWAP-200 as an instrument for assessing personality disorders. Our first validity analysis showed that SWAP-200 descriptions of 30–40 actual patients who shared a diagnosis (composite descriptions of actual patients) matched the hypothesized portraits of prototypical patients with the same axis II diagnosis (diagnostic prototypes), which were provided by different clinicians. In addition, it showed that the SWAP-200 descriptions for these patients did not match the diagnostic prototypes for unrelated diagnoses.
A second, complementary validity analysis showed that SWAP-200 personality disorder scores (which measure the match between patients and diagnostic prototypes) showed high convergent and discriminant validity with clinicians’ ratings of the degree to which patients met diagnostic criteria for each personality disorder. Personality disorder scores correlated highly with clinicians’ ratings for the same diagnosis and weakly with clinicians’ ratings for unrelated diagnoses. Each correlation for this analysis relied on data from all 530 actual patients and all 267 hypothetical, prototypical patients, rather than the 30–40 patients per group used in the first validity analysis.
A third assessment of validity examined the relation between SWAP-200-based psychological health scores (obtained by correlating each patient’s SWAP-200 description with the diagnostic prototype of a healthy, high-functioning patient) and the Global Assessment of Functioning Scale. There was a strong relation between the two measures of health.
Potential Objections
A critic might object to these findings on a number of grounds. One objection is that the SWAP-200 descriptions were provided by clinicians, whose biases might make them unreliable. Several considerations limit the impact of this criticism. First, all observers have biases. Ideally, one would want to rely on as many credible data sources as possible, and future research assessing the validity of the SWAP-200 should draw upon a combination of clinician observation, self-report, informant report, and research interviews. However, we believe the judgments of experts with an average of over 18 years’ practice experience, who have known the patient over an extended period of time (in this case, for more that 33 sessions on average), are likely to be at least as informative as either self-reports or judgments made in 30 to 90 minutes by research assistants using structured interviews. This is particularly true given the potential confounds of state and trait that make assessment of personality disorders especially difficult (15). One would expect that knowing a patient over an extended time would limit diagnostic “noise” reflecting the vagaries of current axis I state conditions. Such states can bias judgments when diagnosis rests exclusively on a brief cross-sectional snapshot of a patient at a single time.
Second, statistical analyses demonstrate that clinicians can, in fact, use the SWAP-200 to provide reliable descriptions of a disorder. High values for coefficient alpha show that there is good agreement from clinician to clinician, with relatively little measurement error or noise in the composite descriptions (i.e., in the diagnostic prototypes or composite descriptions of actual patients). This does not mean that an individual clinician’s description of a single patient is necessarily reliable; it means that if one averages across the descriptions provided by a group of clinicians, the resulting composite is highly reliable. The high alpha coefficients we obtained—above 0.90 for 14 of 15 diagnoses, and 0.85 for the other—demonstrate that we used large enough groups to accomplish this. These high alpha coefficients are particularly meaningful given that the clinicians differed substantially in their theoretical orientations, training, practice settings, and so on.
Using large samples of clinicians to refine axis II categories and criteria makes sound psychometric sense. The reliability of 797 experienced clinicians is going to be much higher than the reliability of a small number of experts sitting at a committee table, regardless of how knowledgeable the experts are. The reason is strictly mathematical (49): The more clinicians, the more errors (i.e., idiosyncrasies of individual clinicians) will cancel themselves out.
Third, the gulf between clinical and research approaches to assessing personality disorders is wide (10). If DSM is to guide clinical diagnosis, it should have clinical relevance, and we know of no better way to guarantee its fidelity to clinical reality than to harness clinical observation to refine it.
Another potential objection is that the high validity coefficients we report are artifactual, because the SWAP-200 descriptions of actual patients may have been based on the clinicians’ implicit prototypes or theories about their patients’ personality disorders, not on the actual characteristics of their patients. If so, then the SWAP-200 descriptions of actual patients would necessarily resemble the descriptions of hypothetical, prototypical patients with the same personality disorder.
This is unlikely for several reasons. First, the SWAP-200 includes 200 items, whereas any given axis II diagnosis includes only seven to 10 criteria. Thus, clinician-respondents in this study were on their own for the other 190, which our prior item analyses had demonstrated are nonredundant and are thus not simply amplifications of the criteria in axis II.
Second, our validity analysis based on clinicians’ ratings (of the extent to which patients met criteria for each personality disorder) is not vulnerable to this potential criticism. The results of this analysis do not depend on the clinicians’ primary diagnosis of their patients. Instead, we found that ratings of 15 different personality disorders correlated in expected ways with SWAP-200 personality disorder scores (which reflect the ranking of 200 different SWAP-200 items). To imagine that instead of describing an actual patient, clinicians were juggling 15 prototypes in their minds while trying to sort 200 items is implausible. If anything, the findings from this second validity analysis would have been biased downward if clinicians who described actual patients were really describing their implicit prototypes or theories about diagnoses, since clinicians would have skewed their understanding of the patient toward the primary diagnosis and away from any secondary diagnoses, leading to poor convergent and discriminant validity estimates on the other 14 dimensional ratings.
Third, as table1 and table2 clearly illustrate, clinicians did not simply reproduce the criteria from DSM-IV when describing actual patients. This also tells us that they were describing their patients and not idealized prototypes. For example, the composite description of borderline patients (table2) bears only a family resemblance to the DSM-IV description. Only three of the nine criteria in axis II for borderline personality disorder were reproduced among the top nine items that empirically described these patients through use of the SWAP-200.
Fourth, although composite descriptions of actual patients correlated highly with diagnostic prototypes of the same disorder, the correlations between any two patients within a given category ranged from slightly negative to as high as 0.70. This tremendous variation also suggests that clinicians who described actual patients were not simply describing their prototypes and ignoring the attributes of the patient in front of them.
Fifth, even when we ignored the diagnoses and simply examined the relation between patients’ SWAP-200 mental health scores and Global Assessment of Functioning Scale ratings, we found a substantial relationship (r=0.48). A similar finding emerged in a pilot study (37) in which patients were described by both their therapists and independent interviewers through use of the SWAP-200. In that study, clinicians were not asked to choose a patient with any particular diagnosis, and the interviewers were blind with respect to which (if any) axis II diagnosis or diagnoses the therapist believed the patient to have. Nevertheless, the SWAP-200 descriptions by the treating clinician and the independent interviewers correlated on average r>0.50.
Another potential criticism focuses on the content of the SWAP-200. Many experts have contributed to axis II, whereas one could argue that the SWAP-200 was devised by a task force of two. Can we show that we have included all the necessary items and have not included items that are unnecessary? No. Nor can the developers of any other measure. What we can say is the following. First, we used methods for scale construction devised and refined by personality psychologists and psychometricians over the past 50 years, e.g., making successive approximations, trying them out, adding new items where gaps existed, eliminating redundant items based on correlation matrices, eliminating items with minimal variance, and so on. Second, we included items from a broad range of sources, including, but not limited to, DSM-III-R and DSM-IV. The item set is far more inclusive than the items that make up the diagnostic criteria for axis II because it includes some version of all of the axis II criteria plus roughly 130 additional items. Third, over 950 clinician-consultants have used the instrument at this point and provided feedback about its comprehensiveness (e.g., we asked the clinicians if there was anything important they wished to express about a patient that was not covered in the SWAP item set).
Fourth, we asked clinicians in the present study to rate how well the SWAP-200 item set allowed them to describe their patients’ personalities through use of a 4-point rating scale (1=I was able to express most of the things I consider important about this patient, 2=I was able to express some of the things I consider important about this patient, 3=I was able to express relatively few of the things I consider important about this patient, 4=I was not able to express the things I consider important about this patient). Most clinicians found the SWAP-200 to be quite comprehensive (as one would hope, since by that time we had already had feedback from almost 200 clinicians on prior versions of the item set): 72.7% gave the SWAP-200 a rating of 1, and 26.7% gave it a rating of 2. Only 0.6% gave it a rating of 3, and none gave it a rating of 4. We do not have comparable ratings for the current DSM criteria but we plan to collect those data shortly; we doubt they will fare as well despite their far greater familiarity.
Finally, in assessing the utility of a new method, the question one must ask is how it compares to existing methods, not how it compares to a perfect, nonexistent method. Given that we designed this measure to avoid the pitfalls of current instruments, and given that the data for convergent and discriminant validity are strong, we believe it represents a potential advance. As both Livesley (1, pp. v–x) and Tyrer (50) have argued, one of the greatest hindrances to further advances in the field of personality disorders is that research attempting to refine axis II has focused almost exclusively on the taxonomy established by convention in the DSMs, without addressing some of the fundamental conceptual and psychometric problems built into it or attempting to explore alternative methods of classification.
A nosology of personality pathology should provide a language for describing personality that is clinically useful and experience-near. Axis II has come a long way in that direction, but we believe alternative methods may allow us to move at least a small step closer toward a clinically useful, empirically sound method for describing personality and personality disorders.
Received Jan. 14, 1998; revision received June 22, 1998; accepted Aug. 25, 1998. From the Department of Psychiatry, Harvard Medical School, Boston; and The Cambridge Hospital/Cambridge Health Alliance, Address reprint requests to Dr. Westen, Department of Psychiatry, The Cambridge Hospital, 1493 Cambridge St., Cambridge, MA 02139; [email protected] (e-mail). The authors acknowledge the assistance of the over 950 clinicians who helped to refine the SWAP-200 assessment instrument, including the 797 who participated in the present study. They also thank several research assistants who helped in the collection of the data, particularly Michelle Levine, Alan Reyes, Lisa Goldstein, and Elizabeth Schafer.
 |
 |
 |
 |

FIGURE 1. Sample Personality Disorder Score Profile for a Patient With Borderline Personality Disordera
aMean T score=50 (SD=10).
1. Livesley WJ (ed): The DSM-IV Personality Disorders. New York, Guilford Press, 1995Google Scholar
2. Blais M, Norman D: A psychometric evaluation of the DSM-IV personality disorder criteria. J Personality Disorders 1997; 11:168–176Crossref, Medline, Google Scholar
3. Clark L: Resolving taxonomic issues in personality disorders: the value of larger scale analyses of symptom data. J Personality Disorders 1992; 6:360–376Crossref, Google Scholar
4. Harkness A: Fundamental topics in the personality disorders: candidate trait dimensions from lower regions of the hierarchy. Psychol Assess 1992; 4:251–259Crossref, Google Scholar
5. Livesley W, Jackson D: Guidelines for developing, evaluating, and revising the classification of personality disorders. J Nerv Ment Dis 1992; 180:609–618Crossref, Medline, Google Scholar
6. Morey LC: Personality disorders in DSM-III and DSM-III-R: convergence, coverage, and internal consistency. Am J Psychiatry 1988; 145:573–577Link, Google Scholar
7. Bell E, Jackson D: The structure of personality disorders in DSM-III. Acta Psychiatr Scand 1992; 85:279–287Crossref, Medline, Google Scholar
8. Oldham JM, Skodol AE, Kellman HD, Hyler SE, Rosnick L, Davies M: Diagnosis of DSM-III-R personality disorders by two structured interviews: patterns of comorbidity. Am J Psychiatry 1992; 149:213–220Link, Google Scholar
9. Davis R, Blashfield R, McElroy R: Weighting criteria in the diagnosis of a personality disorder: a demonstration. J Abnorm Psychol 1993; 102:319–322Crossref, Medline, Google Scholar
10. Westen D: Divergences between clinical and research methods for assessing personality disorders: implications for research and the evolution of axis II. Am J Psychiatry 1997; 154:895–903Link, Google Scholar
11. Westen D, Arkowitz-Westen L: Limitations of axis II in diagnosing personality pathology in clinical practice. Am J Psychiatry 1998; 155:1767–1771Link, Google Scholar
12. Meehl P: Bootstraps taxometrics: Solving the classification problem in psychopathology. Am Psychol 1995; 50:266–275Crossref, Medline, Google Scholar
13. Perry JC: Problems and considerations in the valid assessment of personality disorders. Am J Psychiatry 1992; 149:1645–1653Link, Google Scholar
14. First M, Spitzer R, Gibbon M, Williams J, Davies JB, Howes M, Kane J, Pope H, Rounsaville B: The Structured Clinical Interview for DSM-III-R Personality Disorders (SCID-II), part II: multi-site test-retest reliability study. J Personality Disorders 1995; 9:92–104Crossref, Google Scholar
15. Zimmerman M: Diagnosing personality disorders: a review of issues and research methods. Arch Gen Psychiatry 1994; 51:225–245Crossref, Medline, Google Scholar
16. Skodol A, Oldham J, Rosnick L, Kellman D, Hyler S: Diagnosis of DSM-III-R personality disorders: a comparison of two structured interviews. Int J Methods Psychiatr Res 1991; 1:13–26Google Scholar
17. Spitzer RL: Psychiatric diagnosis: are clinicians still necessary? Compr Psychiatry 1983; 24:399–311Google Scholar
18. Cohen J: A coefficient of agreement for nominal scales. Educational and Psychol Measurement 1960; 20:37–46Crossref, Google Scholar
19. Torgersen S, Alnaeus R: The relationship between the MCMI personality scales and DSM-III, axis II. J Pers Assess 1990; 55:698–707Crossref, Medline, Google Scholar
20. Stangl D, Pfohl B, Zimmerman M: A structured interview for DSM-III personality disorders: a preliminary report. Arch Gen Psychiatry 1985; 42:591–596Crossref, Medline, Google Scholar
21. First M, Spitzer R, Gibbon M, Williams J: The Structured Clinical Interview for the DSM-III-R Personality Disorders (SCID-II), part I: description. J Personality Disorders 1995; 9:83–91Crossref, Google Scholar
22. Westen D: Case formulation and personality diagnosis: two processes or one? in Making Diagnosis Meaningful. Edited by Barron J. Washington, DC, American Psychological Association Press,1998, pp 111–138Google Scholar
23. Gunderson JG, Kolb JE, Austin V: The Diagnostic Interview for Borderline Patients. Am J Psychiatry 1981; 138:896–903Link, Google Scholar
24. Westen D: A clinical-empirical model of personality: life after the Mischelian ice age and the NEO-lithic era. J Personality 1995; 63:495–524Crossref, Medline, Google Scholar
25. Schacter D: Understanding implicit memory: a cognitive neuroscience approach. Am Psychol 1992; 47:559–569Crossref, Medline, Google Scholar
26. Westen D: The scientific legacy of Sigmund Freud: toward a psychodynamically informed psychological science. Psychol Bull 1998; 124:333–371Crossref, Google Scholar
27. Dozier M, Kobak R: Psychophysiology in attachment interviews: converging evidence for deactivating strategies. Child Dev 1992; 63:1473–1480Crossref, Medline, Google Scholar
28. Shedler J, Mayman M, Manis M: The illusion of mental health. Am Psychol 1993; 48:1117–1131Crossref, Medline, Google Scholar
29. Weinberger DA: The construct validity of the repressive coping style, in Repression and Dissociation: Implications for Personality Theory, Psychopathology, and Health. Edited by Singer JL. Chicago, University of Chicago Press, 1995, pp 337–386Google Scholar
30. Block J: Lives Through Time. Berkeley, Calif, Bancroft, 1971Google Scholar
31. Block J: The Q-Sort Method in Personality Assessment and Psychiatric Research. Palo Alto, Calif, Consulting Psychologists Press, 1978Google Scholar
32. Block J, Gjerde P, Block J: Personality antecedents of depressive tendencies in 18-year-olds: a prospective study. J Pers Soc Psychol 1991; 60:726–738Crossref, Medline, Google Scholar
33. Colvin R, Block J, Funder D: Overly positive self evaluations and personality: negative implications for mental health. J Pers Soc Psychol 1995; 68:1152–1162Crossref, Medline, Google Scholar
34. John O, Robins RW: Accuracy and bias in self-perception: individual differences in self-enhancement and the role narcissism. J Pers Social Psychol 1994; 66:206–219Crossref, Medline, Google Scholar
35. Shedler J, Block J: Adolescent drug use and psychological health: a longitudinal inquiry. Am Psychol 1990; 45:612–630Crossref, Medline, Google Scholar
36. Clark LA, Livesley WJ, Schroeder ML, Irish SL: Convergence of two systems for assessing specific traits of personality disorders. Psychol Assess 1996; 8:94–103Google Scholar
37. Shedler J, Westen D: Refining the measurement of axis II: a Q-sort procedure for assessing personality pathology. Assessment 1998; 5:335–355Crossref, Google Scholar
38. Kernberg O: Borderline Conditions and Pathological Narcissism. New York, Jason Aronson, 1975Google Scholar
39. Kernberg O: Severe Personality Disorders. New Haven, Conn, Yale University Press, 1984Google Scholar
40. Kohut H: The Analysis of the Self. New York, International Universities Press, 1971Google Scholar
41. Perry JC, Cooper SH: Empirical studies of psychological defense mechanisms (1987), in Psychiatry, vol 1. Edited by Michels R, Cooper AM, Guze SB, Judd LL, Solnit AJ, Stunkard AJ, Weissman MM. Philadelphia, Lippincott-Raven, 1995Google Scholar
42. Vaillant G (ed): Ego Mechanisms of Defense: A Guide for Clinicians and Researchers. Washington, DC, American Psychiatric Press, 1992Google Scholar
43. Westen D, Muderrisoglu S, Fowler C, Shedler J, Koren D: Affect regulation and affective experience: individual differences, group differences, and measurement using a Q-sort procedure. J Consult Clin Psychol 1997; 65:429–439Crossref, Medline, Google Scholar
44. Westen D: Social cognition and object relations. Psychol Bull 1991; 109:429–455Crossref, Google Scholar
45. Westen D, Lohr N, Silk K, Gold L, Kerber K: Object relations and social cognition in borderlines, major depressives, and normals: a TAT analysis. Psychol Assess 1990; 2:355–364Crossref, Google Scholar
46. John O: The “big five” factor taxonomy: dimensions of personality in the natural language and in questionnaires, in Handbook of Personality: Theory and Research. Edited by Pervin L. New York, Guilford Press, 1990, pp 66–100Google Scholar
47. McCrae R, Costa P: Personality in Adulthood. New York, Guilford Press, 1990Google Scholar
48. Cronbach LJ: Coefficient alpha and the internal structure of tests. Psychometrika 1951; 16:297–334Crossref, Google Scholar
49. Wiggins J: Personality and Prediction: Principles of Personality Assessment. Reading, Mass, Addison-Wesley, 1973Google Scholar
50. Tyrer P: Are personality disorders well classified in DSM-IV? in The DSM-IV Personality Disorders. Edited by Livesley WJ. New York, Guilford Press, 1995, pp 29–44Google Scholar