Increasing Required Neural Response to Expose Abnormal Brain Function in Mild Versus Moderate or Severe Alzheimer's Disease: PET Study Using Parametric Visual Stimulation
Abstract
OBJECTIVE: The authors examined the interaction of Alzheimer's disease severity and visual stimulus complexity in relation to regional brain function. METHOD: Each subject had five positron emission tomography [15]H2O scans while wearing goggles containing a grid of red lights embedded into each lens. Regional cerebral blood flow (CBF) was measured at 0 Hz and while lights were flashed alternately into the two eyes at 1, 4, 7, and 14 Hz. Changes in regional CBF from the 0-Hz baseline were measured at each frequency in 19 healthy subjects (mean age=65 years, SD=11), 10 patients with mild Alzheimer's disease (mean age=69, SD=5; Mini-Mental State score ≥20), and 11 patients with moderate to severe Alzheimer's disease (mean age=73, SD=12; Mini-Mental State score ≤19). RESULTS: As pattern-flash frequency increased, CBF responses in the comparison group included biphasic rising then falling in the striate cortex, linear increase in visual association areas, linear decrease in many anterior areas, and a peak at 1 Hz in V5/MT. Despite equivalent resting CBF and CBF responses to low frequencies among all groups, the groups with Alzheimer's disease had significantly smaller CBF responses than the comparison group at the frequency producing the largest response in the comparison group in many brain regions. Also, patients with moderate/severe dementia had smaller responses at frequencies producing intermediate responses in comparison subjects. CONCLUSIONS: Functional failure was demonstrated in patients with mild dementia when large neural responses were required and in patients with moderate/severe dementia when large and intermediate responses were required.
Alzheimer's disease is the most common dementia of old age. Memory and attention are affected early, other cognitive domains—including language, executive, and visuospatial functions—become impaired later, and clinical deterioration progresses to death after about 10 years.
The brains of patients with Alzheimer's disease have regionally distributed intraneural fibrillary tangles composed of paired helical filaments, parenchymal amyloid-bearing plaques, neuron loss, and amyloid in blood vessels (1–3). Multiple neurotransmitter and metabolic abnormalities are consistent with widespread neural dysfunction and synaptic failure (4–9). Disease severity and cognitive impairment correlate positively with progressive synaptic dropout and dysfunction (10, 11). Compared with association cortical areas, the visual, sensorimotor, and auditory primary cortical areas are relatively spared. Quantitative studies of visual cortex demonstrate 20- to 40-fold fewer neurofibrillary tangles in primary striate cortex than in visual association areas; neuritic plaque density, however, is comparable in the striate and association areas (2).
“Resting” positron emission tomography (PET) studies of patients with Alzheimer's disease show low rates of regional cerebral glucose metabolism and low regional cerebral blood flow (CBF) proportional to regional brain pathology (12–19).
In PET activation studies, stimulus complexity and severity of Alzheimer's disease independently influence regional CBF responses. In an earlier study (20), we presented an alternating pattern-flash stimulus to a group of patients with Alzheimer's disease who had scores on the Mini-Mental State (21) ranging from 0 to 28. Despite normal regional CBF values at rest and at low levels of stimulation (low flash frequency), at high stimulation levels the striate cortex in the Alzheimer's disease group had significantly lower CBF values than those in healthy comparison subjects. In other visual activation studies, visual association areas in mildly demented patients had CBF responses similar to those of healthy subjects at modest activation levels (22, 23), whereas the CBF responses of moderately to severely demented patients in the same areas at the same modest activation were significantly smaller than those of healthy subjects (23).
Will increasing the level of stimulus activation (neural stress test) expose brain dysfunction in mildly demented patients with Alzheimer's disease who have normal regional CBF at rest and at modest activation levels, and will this method extend to preclinical diagnosis? Within the widely distributed heterogeneous pathology of Alzheimer's disease, will increasing stimulus complexity improve diagnostic sensitivity in regions with less pathology? The aim of this study was to extend previous findings and more fully evaluate the effect of the interaction of disease severity and stimulus complexity on regional brain function in Alzheimer's disease. Abstracts of part of this work have been presented earlier (24, 25).
METHOD
Subjects
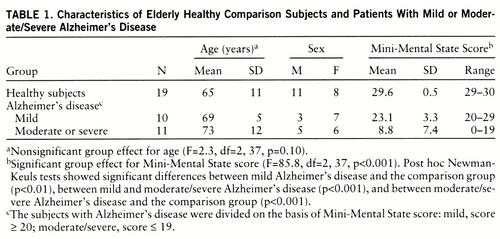
The consent forms were approved by the institutional review board. All subjects or their legal guardians gave written consent for participation in a protocol to evaluate regional CBF responses to a temporally graded visual stimulus. Subjects were recruited without regard for race, gender, or religion through advertisements in newspapers and on bulletin boards in local community buildings, from physician referrals, from other protocols in our laboratory, and from social service agencies. The patients with Alzheimer's disease met the criteria of the National Institute of Neurological and Communicative Disorders and Stroke and the Alzheimer's Disease and Related Disorders Association (26). Twenty-one patients were compared with 19 healthy subjects. The Alzheimer's disease group was divided into two subgroups on the basis of scores on the Mini-Mental State (21): a mildly demented group that had scores of 20 or higher (N=10) and a combined moderately/severely demented group that had scores of 19 or lower (N=11). Demographic characteristics of the three groups are presented in table 1. Age and sex were not statistically different among the groups.
No subject had a major medical disorder other than Alzheimer's disease, as determined by history, physical examination, chest X-ray, ECG, magnetic resonance imaging, and laboratory tests (complete blood count; measurement of sedimentation rate, electrolytes, glucose, blood urea nitrogen, creatinine, liver-associated enzymes, cholesterol, triglyc~erides, antinuclear antibodies, serum B12, and folate; thyroid function, VDRL, and HIV tests; and urinalysis). No subject had a visual abnormality as assessed by history and examination (ophthalmoscopy, tests of pupillary function and extraocular movement, acuity charts, and field integrity determined by confrontation response).
Pattern-Flash Stimulus
Each subject was scanned five times during a PET scan session. During each scan, a flashing stimulus was administered alternately to the two eyes at a single frequency by a pair of goggles (model S10VS B, Grass Instrument Co., Quincy, Mass.) taped to a thermoplastic face mask. Five scans for each subject were obtained at frequencies of 0, 1, 4, 7, and 14 Hz, administered in random order and counterbalanced across subjects.
Stimulus characteristics, CBF responses, and subjective percepts for the healthy subjects have been presented elsewhere in detail (27). Briefly, the stimulus was delivered by goggles that contained a 6×5 rectilinear grid (1.52 cm by 1.27 cm) of 30 monochromatic red-light-emitting diodes, mean peak 655 nm, embedded into each eyepiece. The grids subtended an arc of illumination of about 50° and were flashed alternately into the left and right eyes, and the number of flashes presented to one eye per second determined the flash frequency in hertz. Flash frequency was varied by changing the duration of the interval between flashes. Flash duration was fixed at 5 msec. The luminous intensity of each flash remained constant at 3.6 mcd; therefore, as flash frequency increased, so did luminous intensity per unit time. The subjects were told to watch the flashing lights, no specific fixation point was required, and the test-retest reliability of the CBF responses in all brain regions was very high (27).
The subjects, when able, described the subjective perception of the alternating pattern-flash stimulus as follows. At 0 Hz it appeared dark. From 1 through 14 Hz the image brightness steadily increased, reflecting increases in luminance. At 1 Hz the grids were seen as formless, dull red rectangles. As the flash frequency increased, the individual light-emitting diodes (LEDs) became visible and the LED pattern gradually emerged. That is, the form became more complex as the flash frequency increased. Many shades of orange and yellow, in addition to bright red, were reported at high frequencies, whereas at low frequencies the only color reported was dull red. Thus, as the flash frequency increased, image brightness (luminance) increased, form complexity increased, and multiple colors were perceived. At 1 Hz the dull red rectangle was seen alternately by the left and right visual fields and was reported to “oscillate” or move. This apparent motion occurred because the LED grids were not centered over each fovea. At higher frequencies the rate of the alternation of flashes between the left and right fields was too rapid for apparent motion and the two rectangles were perceived as a single larger flickering rectangle.
PET Scan
Regional CBF was measured by using [15]H2O with a positron emission tomograph (model PC2048-15B, Scanditronix, Uppsala, Sweden) that has reconstructed transverse and axial resolutions of 6.5 mm. Head movement was minimized during and between scans with a thermoplastic mask molded to each subject's head and attached to the scanner bed. A transmission scan was obtained during rotation of a 68Ge/68Ga source around the subject's head to correct for photon attenuation by skull and cerebral tissue. Eight subjects from each group received 30 mCi of [15]H2O intravenously as a bolus; the rest received 40 mCi. During the 4 minutes after the [15]H2O was injected, data were collected simultaneously in 15 planes spaced 6.5 mm apart and parallel to the inferior orbitomeatal line. Sixteen images were obtained, 12 10-second images followed by four 30-second images. Automatic arterial blood sampling with an indwelling catheter was initiated at the time of injection and was continued throughout the scanning period. Data from the 16 images and the arterial time-activity curve were used to reconstruct the set of 15 slices composing each scan. Regional CBF was calculated by using a rapid least squares method (28, 29).
Data Analysis
Values for CBF in all brain voxels across the five pattern-flash frequencies were compared in the patients with mild Alzheimer's disease, the patients with moderate or severe Alzheimer's disease, and the healthy comparison group. As we used arterial lines, we could compare group values of absolute mean global CBF in milliliters per 100 g per minute before data transformation. The group main effect for mean values was significant (F=31.3, df=2,197, p<0.001). According to post hoc Newman-Keuls tests, the patients with moderate or severe Alzheimer's disease had significantly lower global CBF than the patients with mild Alzheimer's disease (p<0.001), and the mildly demented group in turn had lower global CBF than the healthy comparison group (p<0.001). As a global difference reflects the disease process, a significant global CBF difference should not be ignored or minimized by normalization or scaling procedures before between-group regional CBF comparisons (21, 30). Therefore, we performed the following stereotaxic normalization and data transformation.
By using statistical parametric mapping (31), the images were registered, stereotaxically normalized into the space of the Talairach and Tournoux atlas (32), and smoothed by 20 mm × 20 mm × 12 mm in the X, Y, and Z axes (X=left/right, Y=posterior/anterior, and Z=inferior/superior). To reduce effects of differences in global CBF between runs while maintaining the effect of the significant between-group global CBF difference, CBF at each voxel was normalized to the whole brain value (CBF at each voxel was divided by the global CBF of the scan from which it was derived) and then multiplied by the mean global CBF of the appropriate group (comparison, mild Alzheimer's disease, moderate/severe Alzheimer's disease). This procedure standardized values of regional CBF in milliliters per 100 g per minute (21, 30).
The patient groups with mild and moderate/severe Alzheimer's disease were compared with the healthy comparison group at 0 Hz (resting scan) by using statistical parametric mapping (31).
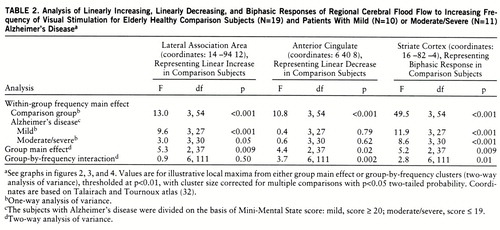
We previously demonstrated four major patterns of CBF response in different brain areas of healthy subjects as flash frequency increased (27): 1) a biphasic rising then falling, 2) a linear rising, 3) a linear falling, and 4) a peak at 1 Hz in the middle temporal region V5/MT. Using appropriate contrasts in within-group statistical parametric mapping analyses (biphasic pattern, –2 1 2 1 –2; linearly increasing pattern, –2 –1 0 1 2; linearly decreasing pattern, 2 1 0 –1 –2), we identified areas displaying each of those regional CBF response patterns in the comparison group, the mildly demented patients, and the moderately or severely demented patients. In the analyses, voxels were thresholded at p<0.001, uncorrected for multiple comparisons, and then activation clusters that exceeded a p<0.05 two-tailed probability, corrected for multiple comparisons, were reported. To evaluate between-group differences, we performed a two-way repeated measures analysis of variance (ANOVA), with the variables group and frequency (repeated), at every voxel by means of a computer program written in C (formulae from a standard textbook [33]). In separate analyses, voxels having a significant group main effect or a significant group-by-frequency interaction were thresholded at p<0.01. Significant group main effects or group-by-frequency clusters of voxels that exceeded a p<0.05 two-tailed probability, corrected for multiple comparisons, were determined by using the NIH Functional Imaging Data Analysis Platform (written by Dr. J. Maisog) based on the analytic method of statistical parametric mapping (31, 34). To illustrate the different CBF response curves in different brain regions, we analyzed local maxima from within the significant group main effect or group-by-frequency clusters. For each local maximum we present a graph of the CBF response that includes simple effects of group (Newman-Keuls test), and we also present the group main effect (two-way ANOVA), the group-by-frequency interaction (two-way ANOVA), and the main effect of frequency within each group (one-way ANOVA).
RESULTS
Figure 1 shows the brain areas in which regional CBF at rest (dark, 0 Hz) was significantly lower in the mildly demented and moderately/severely demented patients than in the comparison group.
Figure 2 identifies the brain areas in which CBF showed linearly increasing change as flash frequency increased. From the striate cortex, significant responses in the comparison group extended inferiorly along the lingual and fusiform gyri (Brodmann areas 18 and 19) and laterally into the orbital gyrus, middle occipital gyrus, and cuneus (Brodmann areas 18 and 19). Similar regions, but with smaller volumes, were activated in both Alzheimer's disease groups. At a representative local maximum (lateral association area), derived from the voxels with a significant group main effect, the change in CBF increased significantly as flash frequency increased in all three groups (figure 2 graph, table 2 within-group frequency main effects). In relation to the comparison group, CBF change was significantly less in the patients with mild Alzheimer's disease at 7 and 14 Hz and in the patients with moderate/severe Alzheimer's disease at 4, 7, and 14 Hz (New~man-Keuls tests, figure 2 and table 3).
Figure 3 shows that many “anterior” brain areas in the comparison group had linearly decreasing values for CBF change as flash frequency increased (cingulate, medial and lateral frontal, superior temporal, parietal), with greater volumes of significant activation in the right than left hemisphere. For both Alzheimer's disease groups, the areas with significant linearly decreasing values of CBF change were almost exclusively in the right hemisphere (figure 3). At a representative local maximum (anterior cingulate), derived from the voxels with a significant group-by-frequency interaction (figure 3 graph, table 2), regional CBF change significantly decreased with increasing pattern-flash frequency in the comparison group but not in the patients with mild or moderate/severe Alzheimer's disease (within-group frequency main effects). In relation to the comparison group, change in regional CBF was significantly less in the mildly demented patients at 14 Hz and in the moderately to severely demented patients at 7 and 14 Hz (figure 3 graph).
We have published the extent of significant biphasic changes in CBF in striate cortex Brodmann area 17 in healthy subjects (27). Figure 4 shows CBF change in the comparison, mild Alzheimer's disease, and moderate/severe Alzheimer's disease groups at a representative striate cortex local maximum derived from the voxels with a significant group main effect. The change in regional CBF was significant across all flash frequencies (within-group frequency main effects) and peaked at 7 Hz in all groups. In relation to the comparison group, both Alzheimer's disease groups had changes in regional CBF that were significantly smaller at 4, 7, and 14 Hz (figure 4).
We previously reported a significant CBF response in middle temporal (V5/MT) areas at 1 Hz (frequency of apparent motion) in healthy subjects (27) and demonstrated the absence of such activation in a group of patients with Alzheimer's disease of mixed severity (21). In this study, the comparison group had a significant regional CBF response (mean=4.29 ml/100 g per minute, SD=5.8) at 1 Hz (t=2.4, df=18, p<0.05), whereas the responses of both Alzheimer's disease groups were nonsignificant (p>0.05). The value at 1 Hz of the comparison group was significantly greater than the value for the two Alzheimer's disease groups combined (t=2.4, df=38, p=0.02).
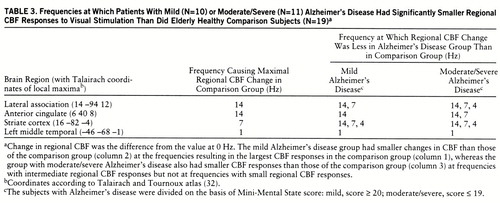
The first data column in table 3 lists the frequencies that resulted in the largest changes in regional CBF in the comparison group (largest neural responses). Columns 2 and 3 list the frequencies at which the mild and moderate/severe Alzheimer's disease groups, respectively, had significantly smaller changes in regional CBF than the comparison group. For each brain area, the mild Alzheimer's disease group had a significantly smaller change in regional CBF at the frequency that resulted in the largest change for the comparison group, whereas the moderate/severe Alzheimer's disease group had a significantly smaller change at that frequency (largest change in comparison group) and also at frequencies that resulted in intermediate amounts of change in regional CBF in the comparison group, but not at frequencies that resulted in small changes.
DISCUSSION
The pattern-flash stimulus and its effect on brain function in healthy subjects have been described in detail elsewhere (27). In summary, the subjects reported seeing a progressively more complex, bright, and colorful pattern as flash frequency increased, and at 1 Hz they reported seeing apparent motion. The CBF response to the pattern-flash stimulus in primary (striate) visual cortex was bimodal, increas~ing between 0 and 7 Hz and then falling at higher frequencies, reflecting the “activity-recovery cycle” (35) of retinostriate pathways (figure 4). CBF steadily increased from 0 through 14 Hz in Brodmann visual association areas 18 and 19 (lingual, fusiform, orbital, middle occipital gyrus, and cuneus), reflecting the increas~ing neural activity required to process increasingly complex images (figure 2). Apparent motion caused CBF increases in the motion-processing area (V5/MT) at 1 Hz, and CBF decreased from 0 to 14 Hz in many anterior brain areas irrelevant for processing the visual stimulus (figure 3).
In relation to the comparison group, the mildly demented patients with Alzheimer's disease had lower CBF values at rest (dark, 0 Hz) in temporoparietal regions (figure 1), whereas the moderately to severely demented patients had significantly lower resting CBF extending bilaterally from the temporoparietal areas into the frontal lobes anteriorly and into the occipital lobes posteriorly (figure 1). These results confirm findings from many previous studies of resting subjects conducted with PET and [15]H2O or [18F]fluorodeoxy~glucose, and they are consistent with postmortem findings that the greatest density of Alzheimer's disease pathology is found in the temporoparietal lobes.
In the mildly demented group, almost all of the posterior and anterior brain areas activated by the pattern-flash stimulus (figures 2 and 3) had normal at-rest CBF values (figure 1). In the group with moderate or severe Alzheimer's disease, the striate and visual extrastriate regions activated by the pattern-flash stimulus (figures 2 and 3) had normal at-rest CBF values (figure 1). All areas activated by the pattern-flash stimulus in both Alzheimer's disease groups had significantly smaller changes in regional CBF than did the comparison group at one or more levels of activation (graphs in figures 2, 3, and 4). Therefore, in both the mildly and severely demented patients, abnormal function can be exposed in areas considered normal at rest by increasing brain stimulation (neural stress test).
However, the degree of stimulation required to expose functional abnormality was greater in the mildly demented patients than in the moderately or severely demented patients. The group with mild Alzheimer's disease had changes in regional CBF that were smaller than those of the comparison group at the frequency resulting in the largest change in regional CBF (large neural response) in the comparison group, whereas the moderately or severely demented group also had changes smaller than those of the comparison group at frequencies eliciting intermediate changes in regional CBF in the comparison group but not at frequencies with small changes (table 3).
We previously demonstrated (20) that the middle temporal cortex (V5/MT), responsible for processing motion, was activated at 1 Hz in healthy subjects but not in patients with Alzheimer's disease for whom results were averaged across all levels of dementia severity. In the present study, significant activation in the middle temporal gyrus (V5/MT) was again seen in the comparison group (mean change in regional CBF=4.29 ml/100 g per minute, SD=5.8) (t=2.4, df=18, p<0.05) but not in either the mildly or moderately/severely demented Alzheimer's disease group.
In the following sections we discuss the pathophysiological implications of these results at the levels of cellular function, neural subpopulations, and subjective information processing.
Increasing Disease Severity and Neural Failure
It has been amply demonstrated that changes in regional CBF are correlated with changes in brain metabolism (36–40). Furthermore, during neural activation the largest metabolic changes occur in synaptic elements, and thus change in regional CBF reflects primarily changes in synaptic activity (41–45).
Alzheimer's disease causes progressive accumulation of neurofibrillary tangles, amyloid plaques, neural dropout, loss of neurotransmitters, and reduction of synaptic binding sites. These pathological changes interact cumulatively to impair neural function and interneural communication (synaptic activity) and thus reduce PET regional CBF. We found smaller changes in regional CBF in the patients with moderate or severe Alzheimer's disease than in those with mild Alzheimer's disease; as disease severity increased, synaptic activity became progressively impaired. Our findings for mild Alzheimer's disease suggest that synaptic responsiveness is within normal limits for stimuli normally eliciting small or moderate increments in regional CBF but fails when stimuli should elicit large regional CBF responses. In moderate to severe Alzheimer's disease, synaptic activity is within normal limits only for stimuli that should elicit small changes in regional CBF and fails with stimuli requiring moderate or large regional CBF responses.
In Alzheimer's disease, dendritic sprouting and new synapse formation or modification occur early in the disease and may be compensatory responses to loss of neurons and synaptic elements (46, 47). In a study of biopsied brain tissue from patients with Alzheimer's disease, DeKosky and Scheff (11) found that the total synaptic surface area contact per unit volume was maintained by enlarging mean apposition length; as presynaptic density decreased, the remaining synapses increased in size. However, in brain tissue biopsied postmortem (more severe disease), the volumetric compensation for numerical loss of presynaptic elements was exceeded and both synapse number and appositional length were reduced. These authors hypothesized that this neural plasticity was an attempt to maintain synaptic functional integrity as Alzheimer's disease pathology progressed.
Our data suggest that whatever neuroplastic changes occur in the course of Alzheimer's disease to maintain functional integrity, they do so imperfectly in mild dementia, as our patients with mild Alzheimer's disease had impaired function when the neural response required was large. Our finding that functional failure occurred with progressively smaller neural responses as disease severity increased is consistent with the finding by DeKosky and Scheff (11) that synaptic appositional length decreased in more severe disease.
Whether a neural stress test can expose abnormal neural function in preclinical subjects with minimal pathology is an important question for future research.
Differential Neural Subpopulation Vulnerability to Disease Pathology
In higher primates, including humans, most visual stimuli are transmitted by retinal cells along two separate neural pathways. Neurons in the magnocellular pathway have high contrast sensitivity, fast temporal resolution, and low spatial resolution and are color insensitive. Neurons in the parvocellular pathway have low contrast sensitivity, slow temporal resolution, and high spatial resolution and are color sensitive (48–51). Each of these separate pathways conducts visual information from the retina to the striate cortex via a single synapse in the lateral geniculate nucleus. From the striate cortex, magno- and parvocellular neurons project to all extrastriate visual association areas except the middle temporal area (V5/MT), which has an almost exclusively magnocellular input (52, 53). Both magno- and parvocellular neurons can respond to low-frequency visual stimuli, but at high frequencies the magnocellular system is more efficient (48, 49, 54).
In agreement with our earlier findings (21), the CBF change in the striate cortex in each of the Alzheimer's disease groups was more impaired at high than low frequencies (figure 4), suggesting that magnocellular function is more impaired than parvocellular function in the striate cortex in Alzheimer's disease. As the middle temporal area (V5/MT) has an almost exclusively magnocellular input, failure to activate middle temporal areas in both Alzheimer's disease groups at 1 Hz, the frequency at which apparent motion occurs, supports severe magnocellular dysfunction even early in Alzheimer's disease.
Passive Visual Information Processing
In healthy subjects the linear increase in neural function (change in regional CBF) in inferior and lateral association areas (figure 2) in response to increasing flash frequency likely represents the neural biology underlying increasingly complex form, color, and luminance processing (27). Smaller changes in regional CBF in the Alzheimer's disease groups, especially at higher frequencies, may reflect an inability to integrate percepts of luminance, color, and form as they become more complex. Change in regional CBF was significantly less for the mildly demented patients than for the healthy subjects at 7 and 14 Hz, suggesting that mildly demented patients have perceptual problems only at high levels of visual image complexity.
In the healthy subjects the anterior brain regions showed linearly decreasing changes in CBF as the flash frequency increased (figure 3), reflecting progressive reduction in neural function in brain areas irrelevant for processing the passive visual stimulus (27). The Alzheimer's disease groups were unable to decrease frontal neural activity to the same extent as the comparison group at high flash frequencies, that is, when the visual percepts were most complex. The neurophysiological mechanisms or circuits underlying these functional changes in healthy subjects are unknown.
Progressive abnormalities in high-level cognition, including memory, language, attention, and visuospatial and executive functions, characterize the dementia of Alzheimer's disease (26) and are major foci of clinical research. However, the present study identifies functional abnormalities in Alzheimer's disease in striate and immediate extrastriate association areas (Brodmann areas 18 and 19), suggesting dysfunction in perceptual processes. As accurate perception facilitates accurate memory and visuospatial and executive functions, perceptual dysfunction likely contributes to the dementia of Alzheimer's disease. Successful drug treatment might be directed toward modulating perceptual networks in addition to those underlying the more traditional cognitive and attentional processes.
Conclusion
Using a passive parametric visual stimulus, we were able to systematically vary CBF response, an index of neural activity, in many brain regions. We exposed functional failure in brain regions that had normal function at rest and at modest levels of activation and that typically have modest (frontal and extrastriate cortex, Brodmann areas 18 and 19) or minimal (striate cortex) Alzheimer's disease pathology. Stimuli that resulted in large changes in regional CBF in healthy subjects were necessary to elicit functional failure in mild dementia, whereas stimuli resulting in intermediate as well as large changes in regional CBF elicited functional failure in moderate to severe dementia.
This stress test approach holds promise for screening preclinical at-risk subjects to identify functional abnormalities in the presence of minimal pathology and for evaluating drug therapies, for which changes in regional CBF responses to varying work loads might be used as objective physiological measures of drug efficacy.
 |
 |
 |
Received March 17, 1997; revisions received Oct. 15 and Dec. 29, 1997; accepted Jan. 8, 1998. From the Laboratory of Neurosciences, National Institute on Aging, Bethesda, Md. Address reprint requests to Dr. Mentis, Department of Neurology, North Shore University Hospital, Suite 206, 444 Community Dr., Manhasset, NY 11030; [email protected] (e-mail).

FIGURE 1. Brain Areas in Which Cerebral Blood Flow During 0-Hz Visual Stimulation (Dark) Was Less in Patients With Either Mild or Moderate/Severe Alzheimer's Disease Than in Elderly Healthy Comparison Subjectsa
aThe subjects with Alzheimer's disease were divided on the basis of Mini-Mental State score: mild, score ≥ 20; moderate/severe ≤ 19. PC, posterior commissure; AC, anterior commissure; R, right side. Grid numbers are millimeters relative to AC plane in sagittal projections, AC-PC plane in coronal projections, and midline sagittal plane in transverse projections. Voxels were thresholded at p<0.001 (uncorrected for multiple comparisons), and then activation clusters that exceeded a p<0.05 two-tailed probability (corrected for multiple comparisons) were reported.

FIGURE 2. Brain Areas With Linearly Increasing Responses of Cerebral Blood Flow to Increasing Frequency of Visual Stimulation for Elderly Healthy Comparison Subjects and Subjects With Mild or Moderate/Severe Alzheimer's Diseasea
aThe subjects with Alzheimer's disease were divided on the basis of Mini-Mental State score: mild, score ≥ 20; moderate/severe ≤ 19. PC, posterior commissure; AC, anterior commissure; R, right side. Grid numbers are millimeters relative to AC plane in sagittal projections, AC-PC plane in coronal projections, and midline sagittal plane in transverse projections. Voxels were thresholded at p<0.001 (uncorrected for multiple comparisons), and then activation clusters that exceeded a p<0.05 two-tailed probability (corrected for multiple comparisons) were reported. The graph is for a representative local maximum derived from voxels with a significant group main effect. ΔrCBF is the change in regional cerebral blood flow from that during the 0-Hz scan; values shown are group means. The coordinates are of local maxima according to the Talairach and Tournoux atlas (32). Significance levels are from Newman-Keuls tests comparing each Alzheimer's disease group with the comparison group.
*p<0.05. **p<0.001.

FIGURE 3. Brain Areas With Linearly Decreasing Responses of Cerebral Blood Flow to Increasing Frequency of Visual Stimulation for Elderly Healthy Comparison Subjects and Subjects With Mild or Moderate/Severe Alzheimer's Diseasea
aThe subjects with Alzheimer's disease were divided on the basis of Mini-Mental State score: mild, score ≥ 20; moderate/severe ≤ 19. PC, posterior commissure; AC, anterior commissure; R, right side. Grid numbers are millimeters relative to AC plane in sagittal projections, AC-PC plane in coronal projections, and midline sagittal plane in transverse projections. Voxels were thresholded at p<0.001 (uncorrected for multiple comparisons), and then activation clusters that exceeded a p<0.05 two-tailed probability (corrected for multiple comparisons) were reported. The graph is for a representative local maximum derived from voxels with a significant group-by-frequency interaction. ΔrCBF is the change in regional cerebral blood flow from that during the 0-Hz scan; values shown are group means. The coordinates are of local maxima according to the Talairach and Tournoux atlas (32). Significance levels are from Newman-Keuls tests comparing each Alzheimer's disease group with the comparison group.
*p<0.05. **p<0.01. ***p<0.001.

FIGURE 4. Biphasic Response of Cerebral Blood Flow in Striate Cortex to Increasing Frequency of Visual Stimulation for Elderly Healthy Comparison Subjects and Subjects With Mild or Moderate/Severe Alzheimer's Diseasea
aThe subjects with Alzheimer's disease were divided on the basis of Mini-Mental State score: mild, score ≥ 20 (N=10); moderate/severe ≤ 19 (N=11). The comparison group consisted of elderly healthy subjects (N=19). ΔrCBF is the change in regional cerebral blood flow from that during the 0-Hz scan; values shown are group means. Significance levels are from Newman-Keuls tests comparing each Alzheimer's disease group with the comparison group.
*p<0.01. **p<0.001.
1 Terry RD, Peck A, DeTeresa R, Schechter MD, Horoupian DS: Some morphometric aspects of the brain in senile dementia of the Alzheimer type. Ann Neurol 1981; 10:184–192Crossref, Medline, Google Scholar
2 Lewis DA, Campbell MJ, Terry RD, Morrison JH: Laminar and regional distributions of neurofibrillary tangles and neuritic plaques in Alzheimer's disease: a quantitative study of visual and auditory cortices. J Neurosci 1987; 7:1799–1808Crossref, Medline, Google Scholar
3 Morrison JH, Hof PR, Campbell MJ, DeLima AD, Voigt T, Bouras C, Cox K, Young WG: Cellular pathology in Alzheimer's disease: implications for corticocortical disconnection and differential vulnerability, in Imaging, Cerebral Topography and Alzheimer's Disease. Edited by Rapoport SI, Petit H, Leys D, Christen Y. Berlin, Springer-Verlag, 1990, pp 19–40Google Scholar
4 Yates CM, Simpson J, Gordon A, Maloney AFJ, Allison Y, Ritchie IM, Urquhart A: Catecholamines and cholinergic enzymes in pre-senile and senile Alzheimer-type dementia and Down's syndrome. Brain Res 1983; 280:119–126Crossref, Medline, Google Scholar
5 Chandrasekaran K, Giordano T, Brady DR, Stoll J, Martin LJ, Rapoport SI: Impairment in mitochondrial cytochrome oxidase gene expression in Alzheimer disease. Brain Res Mol Brain Res 1994; 24:336–340Crossref, Medline, Google Scholar
6 Greenamyre JT, Penney JB, Damato CJ, Young AB: Dementia of the Alzheimer's type: changes in hippocampal L-[3H] glutamate binding. J Neurochem 1987; 48:543–551Crossref, Medline, Google Scholar
7 DeKosky ST, Scheff SW, Markesbery WR: Laminar organization of cholinergic circuits in human frontal cortex in Alzheimer's disease and aging. Neurology 1985; 35:1425–1431Crossref, Medline, Google Scholar
8 Whitehouse PJ, Price DL, Struble RG, Clark AW, Coyle JT, DeLong MR: Alzheimer's disease and senile dementia: loss of neurons in the basal forebrain. Science 1982; 215:1237–1239Crossref, Medline, Google Scholar
9 Whitehouse PJ: Neurotransmitter receptor alterations in Alzheimer disease: a review. Alzheimer Dis Assoc Disord 1987; 1:9–18Crossref, Medline, Google Scholar
10 Terry RD, Masliah E, Salmon DP, Butters N, DeTeresa R, Hill R, Hansen LA, Katzman R: Physical basis of cognitive alterations in Alzheimer's disease: synapse loss is the major correlate of cognitive impairment. Ann Neurol 1991; 30:572–580Crossref, Medline, Google Scholar
11 DeKosky ST, Scheff SW: Synapse loss in frontal cortex biopsies in Alzheimer's disease: correlation with cognitive severity. Ann Neurol 1990; 27:457–464Crossref, Medline, Google Scholar
12 Frackowiak RSJ, Pozzilli C, Legg NJ, Du Boulay GH, Marshall J, Lenzi GL, Jones T: Regional cerebral oxygen supply and utilization in dementia: a clinical and physiological study with oxygen-15 and positron tomography. Brain 1981; 104:753–778Crossref, Medline, Google Scholar
13 Farkas T, Ferris SH, Wolf AP, De Leon MJ, Christman DR, Reisberg B, Alavi A, Fowler JS, George AE, Reivich M: 18F-2-Deoxy-2-fluoro-D-glucose as a tracer in the positron emission tomographic study of senile dementia. Am J Psychiatry 1982; 139:352–353Link, Google Scholar
14 de Leon MJ, Ferris SH, George AE, Reisberg B, Christman DR, Kricheff II, Wolf AP: Computed tomography and positron trans~axial tomography evaluations of normal aging and Alzheimer's disease. J Cereb Blood Flow Metab 1983; 3:391–394Crossref, Medline, Google Scholar
15 Benson DF, Kuhl DE, Hawkins RA, Phelps ME, Cummings JL, Tsai SY: The fluorodeoxyglucose 18F scan in Alzheimer's disease and multi-infarct dementia. Arch Neurol 1983; 40:711–714Crossref, Medline, Google Scholar
16 Friedland RP, Budinger TF, Ganz E, Yano Y, Mathis CA, Koss B, Ober BA, Huesman RH, Derenzo SE: Regional cerebral metabolic alterations in dementia of the Alzheimer type: positron emission tomography with [18F]fluorodeoxyglucose. J Comput Assist Tomogr 1983; 7:590–598Crossref, Medline, Google Scholar
17 Chase TN, Foster NL, Fedio P, Brooks R, Mansi L, Di Chiro G: Regional cortical dysfunction in Alzheimer's disease as determined by positron emission tomography. Ann Neurol Suppl 1984; 15:S170–S174Google Scholar
18 Chase TN: Cortical glucose utilization patterns in primary degenerative dementia of the anterior and posterior types. Arch Gerontol Geriatr 1987; 6:289–297Crossref, Medline, Google Scholar
19 Duara R, Grady C, Haxby J, Sundaram M, Cutler NR, Heston L, Moore A, Schlageter N, Larson S, Rapoport SI: Positron emission tomography in Alzheimer's disease. Neurology 1986; 36:879–887Crossref, Medline, Google Scholar
20 Mentis MJ, Horwitz B, Grady CL, Alexander GE, VanMeter JW, Maisog JM, Pietrini P, Schapiro MB, Rapoport SI: Visual cortical dysfunction in Alzheimer's disease evaluated with a temporally graded “stress test” during PET. Am J Psychiatry 1996; 153:32–40Link, Google Scholar
21 Folstein MF, Folstein SE, McHugh PR: “Mini-Mental State”: a practical method for grading the cognitive state of patients for the clinician. J Psychiatr Res 1975; 12:189–198Crossref, Medline, Google Scholar
22 Rapoport SI, Grady CL: Parametric in vivo brain imaging during activation to examine pathological mechanisms of functional failure in Alzheimer disease. Int J Neurosci 1993; 70:39–56Crossref, Medline, Google Scholar
23 Pietrini P, Furey ML, Dani A, Freo U, Mentis MJ, Alexander GE, Rapoport SI, Schapiro MB: Functional response to audiovisual stimulation in Alzheimer patients: potential for therapeutic interventions. Abstracts of the Society for Neuroscience 1996; 22:1176Google Scholar
24 Mentis MJ, Alexander GE, Furey ML, Pietrini P, Strassburger T, Krasuski J, Dani A, Schapiro MB, Rapoport SI: Abnormal visual function from striate through frontal cortex in Alzheimer's disease (AD) during PET. Abstracts of the Society for Neuroscience 1996; 22:15Google Scholar
25 Mentis MJ, Alexander GE, Furey ML, Pietrini P, Levine B, Rapoport SI: Plastic compensation fails only at high activation levels in mild Alzheimer disease (abstract). Neurology 1997; 48:A339Google Scholar
26 McKhann G, Drachman D, Folstein M, Katzman R, Price D, Stadlan EM: Clinical diagnosis of Alzheimer's disease: report of the NINCDS-ADRDA Work Group under the auspices of the Department of Health and Human Services Task Force on Alzheimer's Disease. Neurology 1984; 34:939–944Crossref, Medline, Google Scholar
27 Mentis MJ, Alexander GE, Grady CL, Horwitz B, Krasuski J, Pietrini P, Strassburger T, Hampel H, Schapiro MB, Rapoport SI: Frequency variation of a pattern-flash visual stimulus during PET differentially activates brain from striate through frontal cortex. NeuroImage 1997; 5:116–128Crossref, Medline, Google Scholar
28 Carson RE, Berg GW, Finn RD, Patlak CS, Daube-Witherspoon ME, Stein SD, Simpson NR, Green MV, Larson SM: Tomographic measurement of LCBF with high-resolution PET and H215O: comparison of methods (abstract). J Cereb Blood Flow Metab 1987; 7:S578Google Scholar
29 Holden JE, Gatley SJ, Hichwa RD, Ip WR, Shaughnessy WJ, Nickles RJ, Polycn RE: Cerebral blood flow using PET measurements of fluoromethane kinetics. J Nucl Med 1981; 22:1084–1088Medline, Google Scholar
30 Mentis MJ, Alexander GE, Grady CL, Horwitz B: On analyzing and interpreting PET activation data in the presence of significant and biologically meaningful group global mean differences (abstract), in Human Brain Mapping: Second International Conference on Functional Mapping of the Human Brain. Edited by Toga AW, Frackowiak RS, Mazziotta JC. Boston, Academic Press, 1996, p S83Google Scholar
31 Friston KJ, Holmes AP, Worsley KJ, Poline JB, Frith CD, Frackowiak RS: Statistical parametric maps in functional neuroimaging: a general linear approach. Human Brain Mapping 1995; 2:189–210Crossref, Google Scholar
32 Talairach J, Tournoux P: Co-Planar Stereotaxic Atlas of the Human Brain. New York, Thieme Medical, 1988Google Scholar
33 Winer BJ, Brown DR, Michels KM: Statistical Principles in Experimental Design, 3rd ed. New York, McGraw-Hill, 1991Google Scholar
34 Friston KJ, Worsley KJ, Frackowiak RS, Mazziotta JC, Evans AC: Assessing the significance of focal activations using their spatial extent. Human Brain Mapping 1994; 1:210–220Crossref, Medline, Google Scholar
35 Fox PT, Raichle ME: Stimulus rate dependence of regional cerebral blood flow in human striate cortex, demonstrated by positron emission tomography. J Neurophysiol 1984; 51:1109–1120Crossref, Medline, Google Scholar
36 Roy CS, Sherrington CS: On the regulation of the blood supply of the brain. J Physiol (Lond) 1890; 11:85–105Crossref, Google Scholar
37 Reivich M: Blood flow metabolism couple in brain. Res Publ Assoc Res Nerv Ment Dis 1974; 53:125–140Medline, Google Scholar
38 Yarowsky P, Ingvar DH: Neuronal activity and energy metabolism. Fed Proc 1981; 40:2353–2362Medline, Google Scholar
39 Sokoloff L: Relationships among local functional activity, energy metabolism, and blood flow in the central nervous system. Fed Proc 1981; 40:2311–2316Medline, Google Scholar
40 Clarke DD, Sokoloff L: Circulation and energy metabolism of the brain, in Basic Neurochemistry, vol 5. Edited by Siegel GJ, Agranoff BW, Albers RW, Molinoff PB. New York, Raven Press, 1994, pp 645–680Google Scholar
41 Schwartz WJ, Smith CB, Davidsen L, Savaki H, Sokoloff L, Mata M, Fink DJ, Gainer H: Metabolic mapping of functional activity in the hypothalamo-neurohypophysial system of the rat. Science 1979; 205:723–725Crossref, Medline, Google Scholar
42 Kadekaro M, Crane AM, Sokoloff L: Differential effects of electrical stimulation of sciatic nerve on metabolic activity in spinal cord and dorsal root ganglion in the rat. Proc Natl Acad Sci USA 1985; 82:6010–6013Crossref, Medline, Google Scholar
43 Kadekaro M, Vance WH, Terrell ML, Gary H Jr, Eisenberg HM, Sokoloff L: Effects of antidromic stimulation of the ventral root on glucose utilization in the ventral horn of the spinal cord in the rat. Proc Natl Acad Sci USA 1987; 84:5492–5495Crossref, Medline, Google Scholar
44 Nudo RJ, Masterson RB: Stimulation-induced [14C]2-deoxyglucose labeling of synaptic activity in the central auditory system. J Comp Neurol 1986; 245:553–565Crossref, Medline, Google Scholar
45 Jeuptner M, Weiller C: Review: does measurement of regional cerebral blood flow reflect synaptic activity? implications for PET and fMRI. NeuroImage 1995; 2:148–156Crossref, Medline, Google Scholar
46 Geddes JW, Monaghan DT, Cotman CW, Lott IT, Kim RC, Chui HC: Plasticity of hippocampal circuitry in Alzheimer's disease. Science 1985; 230:1179–1181Crossref, Medline, Google Scholar
47 Cotman CW, Geddes JW, Kahle J: Axon sprouting in the rodent and Alzheimer's disease brain: a reactivation of developmental mechanisms? in Progress in Brain Research. Edited by Storm-Mathisen J, Zimmer J, Ottersen OP. Amsterdam, Elsevier Science, 1990, pp 427–434Google Scholar
48 Schiller PH, Logothetis NK, Charles ER: Functions of the colour-opponent and broad-band channels of the visual system. Nature 1990; 343:68–70Crossref, Medline, Google Scholar
49 Merigan WH: P and M pathway specialization in the macaque, in From Pigments to Perception. Edited by Valberg A, Lee BB. New York, Plenum Press, 1991, pp 117–125Google Scholar
50 Livingstone MS, Hubel DH: Psychophysical evidence for separate channels for the perception of form, color, movement and depth. J Neurosci 1987; 7:3416–3468Crossref, Medline, Google Scholar
51 Van Essen DC, Gallant JL: Neural mechanisms of form and motion processing in the primate visual system. Neuron 1994; 13:1–10Crossref, Medline, Google Scholar
52 Maunsell JHR, Nealey TA, DePriest DD: Magnocellular and parvocellular contributions to responses in the middle temporal visual area (MT) of the macaque monkey. J Neurosci 1990; 10:3323–3334Crossref, Medline, Google Scholar
53 Ferrera VP, Nealey TA, Maunsell JH: Responses in macaque visual area V4 following inactivation of the parvocellular and magnocellular LGN pathways. J Neurosci 1994; 14:2080–2088Crossref, Medline, Google Scholar
54 Nealey TA, Maunsell JH: Magnocellular and parvocellular contributions to the responses of neurons in macaque striate cortex. J Neurosci 1994; 14:2069–2079Crossref, Medline, Google Scholar