Using Computerized Adaptive Testing to Reduce the Burden of Mental Health Assessment
Psychiatric measurement has been based primarily on subjective judgment and classical test theory. Typically, impairment level is determined by a total score, which requires that the same items be administered to all respondents. An alternative to administration of a full scale is adaptive testing, in which individuals may receive different scale items that are targeted to their specific impairment level ( 1 , 2 ). In adaptive testing, a person's initial item responses are used to determine a provisional estimate of his or her standing on the measured trait (for example, depression or anxiety) to be used for the selection of subsequent items.
This form of testing has recently emerged in mental health research ( 3 , 4 ). Procedures based on item response theory ( 5 ) can be used to obtain estimates for items (for example, difficulty or discrimination) and individuals (for example, severity of depression) to more efficiently identify suitable item subsets for each individual. This approach to testing is referred to as computerized adaptive testing (CAT) and is immediately applicable to psychiatric services ( 6 , 7 , 8 , 9 , 10 ). For example, a depression inventory can be administered adaptively, such that an individual responds only to items that are most appropriate for assessing his or her level of depression. The net result is that a small, optimal number of items is administered to the individual without loss of measurement precision.
A complication of applying item response theory to psychiatric measurement problems is that unlike traditional ability testing (for example, mathematics achievement), for which approximately unidimensional scales are used, psychiatric measurement scales are generally multidimensional. A primary reason for the multidimensionality of psychiatric measurement scales is that items are often sampled from multiple domains (for example, various mood disorders). Bock and colleagues ( 11 , 12 ) extended the item response theory model to the multidimensional case, where each item is related to multiple underlying factors. Despite the availability of these item response theory models ( 11 , 12 , 13 , 14 ), they have not been well studied in the context of CAT. A major limitation of multidimensional CAT is that it involves selection of items that will increase precision of measurement simultaneously on all dimensions of interest. This difficulty arises from the complication of obtaining accurate item parameter and trait estimates across a large number of dimensions ( 11 , 12 ).
A plausible alternative factor structure is the "bifactor" model ( 15 ). The bifactor solution constrains each item to have a nonzero loading on the primary dimension (for example, depression) and a secondary loading on no more than one of the domain factors (for example, sleep disturbance) ( 16 ). The bifactor structure is plausible in psychiatric measurement, in which symptom items that are related to a primary dimension of interest are often selected from underlying measurement subdomains.
Gibbons and Hedeker ( 15 ) derived a bifactor model for binary response data, and Gibbons and colleagues ( 17 ) extended it for analysis of graded response data. Their estimation method permits the items to be sampled from any number of subdomains. In the context of psychiatric measurement, the advantage of the bifactor model is that it yields a measure of overall impairment that can be the focus of CAT. [Statistical details of the bifactor model are provided in an online appendix to this article at ps.psychiatryonline.org.]
In settings in which CAT is used, items are selected during the process of test administration for each individual. Specifically, CAT allows the test administrator to control measurement precision and to maximize the efficiency of the testing process. Characteristics of an adaptive test include a precalibrated item bank, an item selection procedure, a scoring method, and a criterion for terminating the test. Research since the 1970s has shown that these four characteristics are most easily achieved by using item response theory ( 18 , 19 , 20 ). Commercially available software for implementing CAT on the basis of item response theory has been developed ( 21 , 22 ), and research shows that adaptive tests are more efficient than conventional tests; for example, CAT reduces testing time and the number of administered items ( 20 , 23 ). Adaptive tests can result in a 50%–90% reduction in the number of items administered, with no decrease in measurement quality ( 23 ). In educational testing, more than one million tests were administered by using CAT in 1999; the number was projected to rise to ten million in the next few years ( 2 ).
Measurement models based on item response theory also include models that are applicable to personality instruments that are not dichotomously scored ( 24 , 25 , 26 , 27 , 28 ). In terms of psychiatric measurement, research has demonstrated that both item response theory and CAT ( 29 ) can be meaningfully applied to the measurement of attitudes and personality variables ( 30 , 31 ).
Notwithstanding the enormous utility of DSM-IV in advancing our understanding of the clinical course, biological bases, and treatment of mood disorders, there is increasing recognition that these disorders rarely come in the pure and seemingly isolated prototypes described in the current nomenclature. To this end Cassano and colleagues ( 32 , 33 ) defined the full "spectrum," or domain, of clinical features of mood and anxiety disorders.
The Mood and Anxiety Spectrum Scales (MASS) consist of 626 items and assess four domains: mood (161 items), panic-agoraphobia (114 items), obsessive-compulsive disorder (183 items), and social phobia (168 items). Traditional psychometric properties of the MASS have been reported ( 34 , 35 ). Test-retest and interrater reliability ranged from .89 to .99, and measures for each domain showed concurrent validity compared with established measures of comparable constructs. Excellent levels of agreement have been shown between structured clinical interviews and the more efficient self-report measures: mood, r=.97 ( 36 ); panic-agoraphobia, r=.94 ( 37 ); obsessive-compulsive, r=.96 ( 38 ); and social phobia, r=.97 ( 39 ). The instruments were co-developed in Italian and English, and cross-cultural validity has also been demonstrated ( 39 ).
The MASS has been shown to have substantial clinical utility, displaying associations with treatment outcome in unipolar depression ( 40 ), with functional impairment ( 37 ), and with treatment outcome in bipolar disorder ( 32 , 41 ) that persist after traditional DSM diagnostic comorbidity is controlled for ( 32 , 42 , 43 , 44 ). Thus the aim of the study reported here was to expand on this research by applying item response theory to test the scale's dimensionality and to investigate the utility of MASS scores derived in a CAT environment on the basis of the scale's empirical factor structure. More broadly, the aim of this article is to show that CAT can provide a new paradigm for conceptualizing and operationalizing psychiatric measurement.
Methods
Participants
Data were from 800 participants (568 women, or 71%) in outpatient treatment for a mood or anxiety disorder at the Western Psychiatric Institute and Clinic in Pittsburgh from January 2003 through December 2005. The mean age was 38.3±11.6 years (range 18–66 years), with a mean education level of 14.3±2.70 years. Medical charts from all patients were reviewed for diagnostic information. This study was conducted with institutional review board approval, and informed consent was obtained from all participants.
The sample was representative of patients seen at adult outpatient clinics at the Western Psychiatric Institute and Clinic and generalizable to the larger U.S. population of persons with depression. Across 14 published studies of population samples (that is, nontreatment samples), the median lifetime rate of major depression was found to be 10.8%, ranging from 9.0% to 24.4% ( 45 ). The average age of onset of recurrent unipolar major depression is between 30 and 35 years, whereas single-episode major depression usually begins some years earlier ( 46 , 47 ). Compared with men, women have an approximately twofold elevation in lifetime rates of depression, panic disorder, generalized anxiety disorder, agoraphobia, and simple phobia ( 45 , 46 , 47 , 48 , 49 ). The mean age of our sample is consistent with epidemiological findings regarding the age of patients with recurrent depression and anxiety.
Of the 859 participants who consented, 59 (7%) were excluded from analyses because they met exclusion criteria after a medical history review following study entry. Of these 59, 12 were excluded because they had schizophrenia or psychotic symptoms, 21 because of current drug or alcohol dependence, 19 because medical records were missing or there was no medical record to verify diagnoses, and five because they had an organic affective diagnosis; one person was excluded because of an antisocial personality diagnosis, and one was excluded because data were missing from the computer test.
Participants were recruited via flyers and clinician referrals from the Western Psychiatric Institute and Clinic. After a telephone screen to determine eligibility, ten participants declined to schedule an appointment. Thirty-six participants were screened and met eligibility criteria but did not show up for scheduled appointments.
The bifactor model uses all available item responses from each individual and can therefore handle missing item responses. However, because of the small number of patients with missing data (one patient), our analyses were restricted to patients with complete data.
Data analysis
The MASS factor structure was tested by comparing goodness of fit of a unidimensional item response theory model and a bifactor item response theory model. Comparison of -2 times the log-likelihood values were used to select the model that most accurately described the data ( 12 ), which was used for CAT administration of the MASS. Specifically, if the difference in log-likelihood value between the unidimensional and bifactor model was statistically significant, then it was concluded that the bifactor model more accurately described the scale's multidimensional factor structure. Model-data fit was also judged in terms of correspondence between the observed and expected proportion of item categorical frequencies ( 17 ).
The item parameters used in the CAT administration of the MASS were based on data collected from an optimal balanced incomplete block design ( 50 ) that maximized the number of pairings of 616 of the 626 individual items while minimizing the number of items administered to each person. The FastTEST Professional Testing System ( 22 ) was used to create 36 different test forms, each consisting of 154 items extracted from the four MASS subscales. These binary-scored items (1, yes; 0, otherwise; 9, not administered) were administered by computer to 36 randomly assigned subgroups of research participants. Sample sizes for the 36 groups varied from 17 to 28, with a median of 22 participants per group.
In addition to analyses of the total sample of 800, we also analyzed data from a previous study conducted in Italy ( 36 ) (sample A), as well as two subsamples of the 800 participants (samples B and C) that were used to test the efficiency of CAT administration of the MASS (testing time and reduction in administered items). Sample A refers to complete responses (paper-and-pencil administration) to all 626 MASS items from 148 patients with depression in an earlier study conducted jointly by the University of Pittsburgh (N=90) and the University of Pisa (N=58) ( 36 ). Of the 148 participants with depression, 100 were women (68%), 136 were Caucasian (92%), six were Hispanic (4%), 56 were married (38%), and 80 were working full-time (54%). The mean±SD age was 38.11±12.15, and the mean educational level was 13.93±3.47 years (some post-high school education). Sample B refers to complete responses (computer administration) from 204 depressed patients from the study reported here. These data were used to compare administration of the full test and a simulated CAT ( 51 )—that is, the comparison examined what would have happened if only a subset of responses had been administered with CAT. Sample C consisted of a subset of 156 research participants from sample B who were tested with live CAT administration (not simulated) of the bifactor-based CAT (mean of 5.5±1.3 months after administration of the full test).
Two analyses were used to investigate the validity of scores obtained with the CAT version of the MASS. First, CAT scores were correlated to full-scale MASS scores. This analysis provided a measure of the comparability of CAT scores to full-scale MASS scores, with values above .90 desired. Second, the utility of scores on the CAT version of the MASS for differentiating clinical groups was investigated on the basis of a contrasting-groups study. Specifically, differences in scores between two groups of patients with depression—one with bipolar disorder and one without—on the CAT version and the full-scale version of the mood disorder subscale were compared to identify significant differences and effect sizes.
Results
Demographic and clinical characteristics of the sample are shown in Table 1 . The proportion of African Americans in the study was twice the proportion in the greater Pittsburgh area (26%, or 209 participants, in the study compared with 13% in the Pittsburgh–Allegheny County area). The diagnostic categories shown in Table 1 are not mutually exclusive because some participants had comorbid diagnoses. Participants had a broad range of computer experience; 88 participants (11%) had never used a computer before the study.
 |
Nearly all participants (765 participants, or 95%) endorsed a preference for answering mental health questions using a computer rather by the paper-and-pencil method. The FastTEST Pro interface was rated as "good" or "excellent" by 90% (N=720) of the participants, and 85% (N=680) reported that the program was easy or very easy to complete and that they felt comfortable or very comfortable answering personal questions using a computer. Furthermore, 62% (N=496) felt that "a lot" or "a great deal" of insight into individual mental health symptoms could be gained if their clinician or physician reviewed the MASS items.
Item response theory calibration
Overall internal consistency (Kuder-Richardson-21) was .81. Correlations between the scales and the core affective domain ranged from .40 to .90. Both unidimensional and bifactor models (using the subscales as secondary dimensions) were fitted to the 616 item responses obtained from the 800 research participants. The bifactor model provided acceptable model-data fit and significantly improved model fit over the unidimensional model (p<.001), supporting the scale's multidimensional structure. That is, bifactor results supported the contribution of each of the four MASS domains (mood, panic-agoraphobia, obsessive-compulsive, and social phobia) in addition to the primary domain in accounting for the scale's underlying factor structure.
Comparison of types of administration
Results of the post hoc simulation analyses revealed that on average, 25 items in sample A (range 18–55 items) and 24 items in sample B (range 18–77 items) were needed to achieve convergence. This represents a savings of 96% (or approximately 591 items) over administration of the complete test. The overall correlation between the scores on the CAT version and the full-scale MASS was .92 for sample A and .93 for sample B.
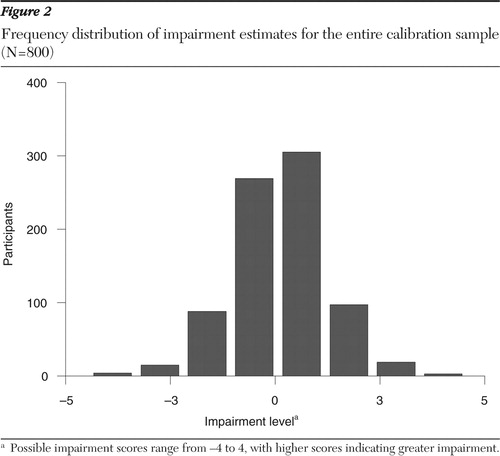
Similar results were obtained with live CAT administration. The average number of items required for sample C was 30, representing a 95% reduction (586 items) in test length. Actual test administration time was 115 minutes for the 616 items administered to sample B and 22 minutes for the same group of patients in the CAT administration to sample C—a time savings of one and one-half hours. Figure 1 illustrates an item-by-item CAT administration of the MASS for a single participant for the primary dimension of impairment. The session begins with an impairment estimate of zero. With administration of each new item the standard error shrinks, until after 26 items the impairment estimate is 1.26 with an SE of .297, just under the termination criterion of SE=.30. Figure 2 presents a frequency distribution of impairment estimates for the entire sample of 800 participants. Figure 2 shows good coverage of the entire impairment distribution, which should typically range from -4 to 4 since the impairment estimates are scaled to have a unit-normal distribution (that is, mean=0 and variance=1).

Clinical utility of CAT
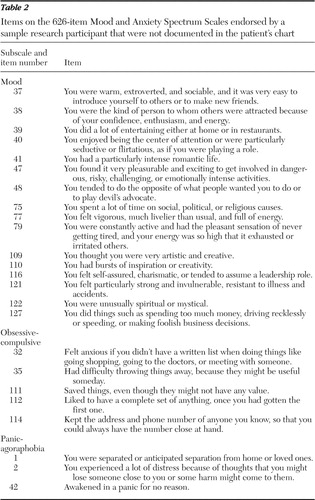
A chart review was performed for six patients with mood disorders (three had major depressive disorder and three had bipolar disorder) who were patients of one psychiatrist, and an interview was conducted with the psychiatrist. Most of the CAT items that were endorsed positive were not documented in the six patients' psychiatric evaluation report, progress notes, and Structured Clinical Interview for DSM-IV. These items included clinically important information, such as a history of manic symptoms, potentially risky behaviors, sexual dysfunction, and agoraphobic traits.
Table 2 reports the endorsed items of the first randomly selected participant, a 51-year-old African-American man with a diagnosis of major depressive disorder. Most of the lifetime symptoms endorsed by this patient on the MASS were not documented in his chart. The treating psychiatrist confirmed that he was unaware of a number of undocumented symptoms detected from the computerized assessment and acknowledged the importance of those symptoms.
 |
Subdomain scoring
CAT was used to assess individuals on both the primary and the secondary dimensions of the bifactor model. Each of the four MASS subscales on the CAT version correlated above .90 with impairment estimates from the full scales (r=.92 to r=.97). The average number of required items increased to 98 for sample A and to 118 for sample B—an approximately 85% reduction (524 items) from the full scale.
External validity
Scores from the CAT version and the full scale for patients with depression, with or without bipolar disorder, were compared on the mood disorder subdomain (161 items). For administration of the full scale, significant differences were found between the two diagnostic groups (with and without bipolar disorder) (t=3.20, df=154, p<.003; effect size of .63 SD units). Conversely, a much larger between-group difference was found in CAT scores (t=6.00, df=154, p<.001; effect size of 1.19 SD units). The effect size of the between-group difference in scores from the CAT version was almost double that from administration of the full test, with an 83% reduction (134 items) in items administered. This finding supports the conclusion of increased external validity of the CAT scores compared with scores on the full scale.
Discussion
The findings supported the utility and flexibility of multidimensional item response theory and CAT for the delivery of psychiatric measurements. Data on the MASS were used to demonstrate how a construct or constructs can be accurately measured by administering only items that are relevant to a given individual. This paradigm represents a distinct shift from the standard approach of administering fixed-length tests in psychiatric measurement. In the context of mental health services research, CAT may result in a drastic reduction in the time required to administer a collection of psychiatric instruments for mental health measurement and diagnostic purposes.
Although there have been some applications of unidimensional item response theory in the context of psychiatric measurement ( 52 , 53 , 54 , 55 , 56 ), this is one of the first applications of multidimensional item response theory (that is, the bifactor model). Simulated CAT administration for research participants who had completed the full scale revealed huge time savings—a 96% reduction in the number of items administered. The correlation between scores obtained from CAT and from administration of the full scale was high (<.90) in two independent samples, indicating no significant loss of information. Similar results were obtained for live CAT testing. It should be noted that similar results were obtained with a CAT version of the Beck Depression Inventory ( 57 ) and with other measures ( 3 , 4 ).
The study reported here also found that the CAT version of the MASS could obtain domain-specific impairment levels in addition to the primary measure of overall impairment. Specifically, the correlation between trait estimates from CAT and from administration of the full scale exceeded .90, with an approximate 85% reduction (524 items) in the number of items administered. Although work with multidimensional CAT is quite limited, Gardner and colleagues ( 58 ) reported similar results. Furthermore, in terms of external validity, CAT yielded a much larger difference in scores on the mood disorder subscale between a group of patients with depression and bipolar disorder and a group of patients with depression but without bipolar disorder, with an 83% reduction (134 items) in the number of items. This finding indicates that scores obtained via CAT have higher external validity. The most likely explanation is that the bifactor model has provided a purer measure of mood disorder that is not confounded with the primary dimension. The direct implication of these results is that the burden for both patient and clinician is dramatically decreased and that smaller sample sizes are required for between-group comparisons on the basis of CAT.
The primary limitation of this study was that results were based on a single measure of mood disorders. This scale was selected because it contained one of the largest preexisting collections of items that had been subjected to traditional psychometric analysis. A test of the scale's factor structure supported conceptualizing it in terms of the bifactor model, with the primary dimension representing a composite of four factors (mood, panic-agoraphobia, obsessive-compulsive, and social phobia). Of the 626 items, 161 had primary factor loadings in excess of .50. Of these items, 28 were mood, 33 were panic-agoraphobia, 45 were obsessive-compulsive, and 55 were social phobia items. As such, there are an ample number of good discriminating items from each of the four domains, and their jointly high loadings on the primary dimension validates the existence of this composite dimension, referred to as "mood anxiety spectrum."
There are three noteworthy limitations of the bifactor model. First, model specification relies on a priori information (for example, theory) to indicate the relationships between items and factors. This should not be a problem in mental health research because the sampling of items from well-established psychological domains is an established method of scale construction. Second, a primary dimension must exist. If the items have a simple factor structure in which subsets of items are related to a single factor alone, then the bifactor model will not be useful. This is empirically testable by comparing the fit of the bifactor model to corresponding unidimensional models and unrestricted multidimensional models by using either item response theory or confirmatory factor analysis methods. Third, the model requires each item to load on a primary dimension and on no more than one subdomain. If items are related to multiple subdomains, they will not be appropriate for the bifactor model. Nevertheless, research has shown the benefits of using the bifactor model to conceptualize health outcome measurements ( 15 , 17 , 59 ).
Conclusions
The importance of performing research in real-world clinical settings is widely recognized, as is the importance of measurement-based care outside the bounds of clinical research. However, in busy psychiatric practices and mental health clinics, the feasibility of conducting the kind of extensive evaluations typical of clinical research is questionable. Therefore, any strategy that reduces the burden of empirically based assessment has the potential to improve outcomes through measurement-based clinical decision making. Thus, apart from its research utility, CAT may complement routine clinical assessments and save clinicians time that may be more productively used for other activities. As we demonstrated in this study, CAT permits a clinician to gather important clinical information via self-report in a way that does not impose an excessive burden on the patient and that does not require the clinician to select items that are pertinent to the individual patient. CAT strategies may therefore be used to personalize virtually any kind of questionnaire. For instance, they can facilitate the creation of child mental health measures that are better adapted to a child's developmental stage than more traditional questionnaires.They can be used to assess the entire array of psychopathology and make a reliable dimensional diagnosis practical and feasible in almost any clinical setting.
Acknowledgments and disclosures
This work was supported by grants R01-MH-66302 and R01-MH-30915 from the National Institute of Mental Health.
The authors report no competing interests.
1. Schaeffer GA, Bridgeman B, Golub-Smith ML, et al: Comparability of Paper-and-Pencil and Computer Adaptive Test Scores on the GRE General test. GRE Board Professional Report 95-08P and ETS Research Report 98-38. Princeton, NJ, Educational Testing Service, 1998Google Scholar
2. Wainer H: CATs: whither and whence. Psicologica 21:121–133, 2000Google Scholar
3. Fliege H, Becker J, Walter OB, et al: Development of a computer-adaptive test for depression (D-CAT). Quality of Life Research 4:2277–2291, 2004Google Scholar
4. Ware JE, Bjorner JB, Kosinski MA: Practical implications of item response theory and computerized adaptive testing: a brief summary of ongoing studies of widely used headache impact scales. Medical Care 38:73–82, 2000Google Scholar
5. Weiss DJ: Adaptive testing by computer. Journal of Consulting and Clinical Psychology 53:774–789, 1985Google Scholar
6. Weiss DJ: Computerized adaptive testing for effective and efficient measurement in counseling and education. Measurement and Evaluation in Counseling and Development 37:70–84, 2004Google Scholar
7. Fliege H, Becker J, Walter OB, et al: Development of a computer-adaptive test for depression (D-CAT). Quality of Life Research 14:2277–2291, 2005Google Scholar
8. Gardner W, Shear K, Kelleher KJ, et al: Computerized adaptive measurement of depression: a simulation study. BMC Psychiatry 4:13, 2004Google Scholar
9. Walter OB, Becker J, Bjorner JB, et al: Development and evaluation of a computer adaptive test for "Anxiety" (Anxiety-CAT). Quality of Life Research 16(suppl 1):143–155, 2007Google Scholar
10. Petersen, MA, Groenvold M, Aaronson N, et al: Multidimensional computerized adaptive testing of the EORTC QLQ-C30: basic developments and evaluations. Quality of Life Research 15:315–329, 2006Google Scholar
11. Bock RD, Aitkin M: Marginal maximum likelihood estimation of item parameters: application of an EM algorithm. Psychometrika 46:443–459, 1981Google Scholar
12. Bock RD, Gibbons RD, Muraki E: Full-information item factor analysis. Applied Psychological Measurement 12:261–280, 1988Google Scholar
13. Hambleton RK, Swaminathan H: Item Response Theory: Principles and Applications. Boston, Kluwer-Nijhoff, 1985Google Scholar
14. Embretson S, Reise S: Item Response Theory for Psychologists. Mahwah, NJ, Erlbaum, 2000Google Scholar
15. Gibbons RD, Hedeker D: Full-information item bifactor analysis. Psychometrika 57:423–436, 1992Google Scholar
16. Holzinger KJ, Swineford F: The bifactor method. Psychometrika 2:41–54, 1937Google Scholar
17. Gibbons RD, Bock RD, Hedeker D, et al: Full-information item bifactor analysis of graded response data. Applied Psychological Measurement 31:4–19, 2007Google Scholar
18. Kingsbury GG, Weiss DJ: An Alternate-Forms Reliability and Concurrent Validity Comparison of Bayesian Adaptive and Conventional Ability Tests. Research Report 80-5. Minneapolis, University of Minnesota, Computerized Adaptive Testing Laboratory, 1980Google Scholar
19. Kingsbury GG, Weiss DJ: A comparison of item response theory-based adaptive mastery testing and a sequential mastery testing procedure, in New Horizons in Testing: Latent Trait Theory and Computerized Adaptive Testing. Edited by Weiss DJ. New York, Academic Press, 1983Google Scholar
20. McBride JR, Martin JR: Reliability and validity of adaptive ability tests in a military setting, in New Horizons in Testing: Latent Trait Theory and Computerized Adaptive Testing. Edited by Weiss DJ. New York, Academic Press, 1983Google Scholar
21. Manual for the MicroCAT Testing System, 3rd ed. St Paul, Minn, Assessment Systems Corp, 1987Google Scholar
22. The FastTEST Professional Testing System. St Paul, Minn, Assessment Systems Corp, 2001Google Scholar
23. Brown JM, Weiss DJ: An Adaptive Testing Strategy for Achievement Test Batteries. Research Report 77-6. Minneapolis, Minn, University of Minnesota, Computerized Adaptive Testing Laboratory, 1977Google Scholar
24. Andrich D: A rating formulation for ordered response categories. Psychometrika 43:561–571, 1978Google Scholar
25. Andrich D: Application of a psychometric rating model to ordered categories which are scored with successive integers. Applied Psychological Measurement 2:581–594, 1978Google Scholar
26. Andrich D: The application of an unfolding model of the item response theory type to the measurement of attitude. Applied Psychological Measurement 12:33–51, 1988Google Scholar
27. Muraki E: Fitting a polytomous item response model to Likert-type data. Applied Psychological Measurement 14:59–71, 1990Google Scholar
28. Samejima F: Estimation of latent ability using a response pattern of graded scores. Psychometrika Monograph Supplement 17:1–68, 1969Google Scholar
29. Baek SG: Computerized adaptive testing using the partial credit model for attitude measurement, in Objective Measurement: Theory Into Practice, vol 4. Edited by Wilson M, Engelhard Jr G, Draney K. Norwood, NJ, Ablex, 1997Google Scholar
30. Dodd BG, DeAyala RJ, Koch WR: Computerized adaptive testing with polytomous items. Applied Psychological Measurement 19:5–22, 1995Google Scholar
31. Reise SP, Waller NG: Fitting the two-parameter model to personality data. Applied Psychological Measurement 15:45–58, 1991Google Scholar
32. Cassano GB, Michelini S, Shear MK, et al: The panic-agoraphobic spectrum: a descriptive approach to the assessment and treatment of subtle symptoms. American Journal of Psychiatry 154(suppl 6):27–38, 1997Google Scholar
33. Frank E, Cassano GB, Shear MK, et al: The spectrum model: a more coherent approach to the complexity of psychiatric symptomatology. CNS Spectrums 3:23–34, 1998Google Scholar
34. Cassano GB, Banti S, Mauri M, et al: Internal consistency and discriminant validity of the Structured Clinical Interview for Panic-Agoraphobic Spectrum (SCI-PAS). International Journal of Methods in Psychiatric Research 8:138–145, 1999Google Scholar
35. Cyranowski JM, Shear MK, Rucci P, et al: Adult separation anxiety: psychometric properties of a new structured clinical interview. Journal of Psychiatric Research 36:77–86, 2002Google Scholar
36. Dell'Osso L, Armani A, Rucci P, et al: Measuring mood spectrum disorder: comparison of interview (SCI-MOODS) and self-report (MOODS-SR) instruments. Comprehensive Psychiatry 42:69–73, 2002Google Scholar
37. Shear MK, Frank E, Rucci P, et al: Panic-agoraphobic spectrum: reliability and validity of assessment instruments. Journal of Psychiatry Research 35:59–66, 2001Google Scholar
38. Dell'Osso L, Rucci P, Cassano GB, et al: Measuring social phobia and obsessive-compulsive disorders: comparison of interviews and self-report instruments. Comprehensive Psychiatry 43:81–87, 2002Google Scholar
39. Frank E, Shear MK, Rucci P, et al: Cross-cultural validity of the Structured Clinical Interview for Panic-Agoraphobic Spectrum. Social Psychiatry and Psychiatric Epidemiology 40:283–290, 2005Google Scholar
40. Frank E, Grochocinski VJ, Spanier CA, et al: Interpersonal psychotherapy and antidepressant medication: evaluation of a sequential treatment strategy in women with recurrent major depression. Journal of Clinical Psychiatry 61:51–57, 2000Google Scholar
41. Frank E, Cyranowski JM, Rucci P, et al: Clinical significance of lifetime panic spectrum symptoms in the treatment of patients with bipolar I disorder. Archives of General Psychiatry 59:905–912, 2002Google Scholar
42. Rucci P, Cassano GB, Frank E, et al: The mood spectrum in unipolar and bipolar patients. Bipolar Disorders 1:77–78, 2003Google Scholar
43. Cassano GB, Dell'Osso L, Frank E, et al: The bipolar spectrum: a clinical reality in search of diagnostic criteria and an assessment measure. Journal of Affective Disorders 54:319–328, 1999Google Scholar
44. Cassano GB, Rucci P, Frank E, et al: The mood spectrum in unipolar and bipolar disorder: arguments for a unitary approach. American Journal of Psychiatry 161:1264–1269, 2004Google Scholar
45. Dew MA, Martire LM, Hall M: Depression: epidemiology and risk factors, in Advances in the Management and Treatment of Depression. Edited by Potokar J, Thase ME. London, Dunitz, 2003Google Scholar
46. Merikangas KR: Anxiety disorders: epidemiology, in Comprehensive Textbook of Psychiatry, 8th ed. Edited by Sadock BJ, Sadock VA. Philadelphia, Lippincott Williams and Wilkins, 2005Google Scholar
47. Kessler RC, McGonagle KA, Zhao S, et al: Lifetime and 12-month prevalence of DSM-III-R psychiatric disorders in the United States. Archives of General Psychiatry 51:8–19, 1994Google Scholar
48. Kessler RC, Berglund P, Demler O, et al: The epidemiology of major depressive disorder: results from the National Comorbidity Survey Replication (NCS-R). JAMA 289:3095–3105, 2003Google Scholar
49. Kessler RC, Chiu WT, Jin R, et al: The epidemiology of panic attacks, panic disorder, and agoraphobia in the National Comorbidity Survey Replication. Archives of General Psychiatry 63:415–424, 2006Google Scholar
50. Cochran WG, Cox GM: Experimental Designs. New York, Wiley, 1957Google Scholar
51. Weiss DJ: Manual for POSTSIM: Post-Hoc Simulation of Computerized Adaptive Testing. St Paul, Minn, Assessment Systems Corp, 2005Google Scholar
52. Santor D, Ramsay J, Zuroff D: Nonparametric item analyses of the Beck Depression Inventory: evaluating gender item bias and response option weights. Psychological Assessment 6:255–270, 1994Google Scholar
53. Cooke DJ, Kosson DS, Michie C: Psychopathy and ethnicity: structural, item, and test generalizability of the Psychopathy Checklist Revised (PCL-R) in Caucasian and African-American participants. Psychological Assessment 13:531–542, 2001Google Scholar
54. Gibbons RD, Clark DC, Cavanaugh SV: Application of modern psychometric theory in psychiatric research. Journal of Psychiatric Research 19:43–55, 1985Google Scholar
55. Gibbons RD, Clark DC, Kupfer DJ: Exactly what does the Hamilton Depression Rating Scale measure? Journal of Psychiatric Research 27:259–273, 1993Google Scholar
56. Eisen SV, Normand S-LT, Belanger AJ, et al: The revised Behavior and Symptom Identification Scale (BASIS-24): reliability and validity. Medical Care 42:1230–1241, 2004Google Scholar
57. Gardner W, Shear K, Kelleher KJ, et al: Computerized adaptive measurement of depression: a simulation study. BMC Psychiatry 4:13–23, 2004Google Scholar
58. Gardner W, Kelleher KJ, Pajer KA: Multidimensional adaptive testing for mental health problems in primary care. Medical Care 40:812–823, 2002Google Scholar
59. Reise SP, Morizot J, Hays RD: The role of the bifactor model in resolving dimensionality issues in health outcomes measures. Quality of Life Research 16:19–31, 2007Google Scholar